- Related Products
- Log360
- AD360
- ADManager Plus
- ADAudit Plus
- ADSelfService Plus
- Exchange Reporter Plus
 Click here to expand
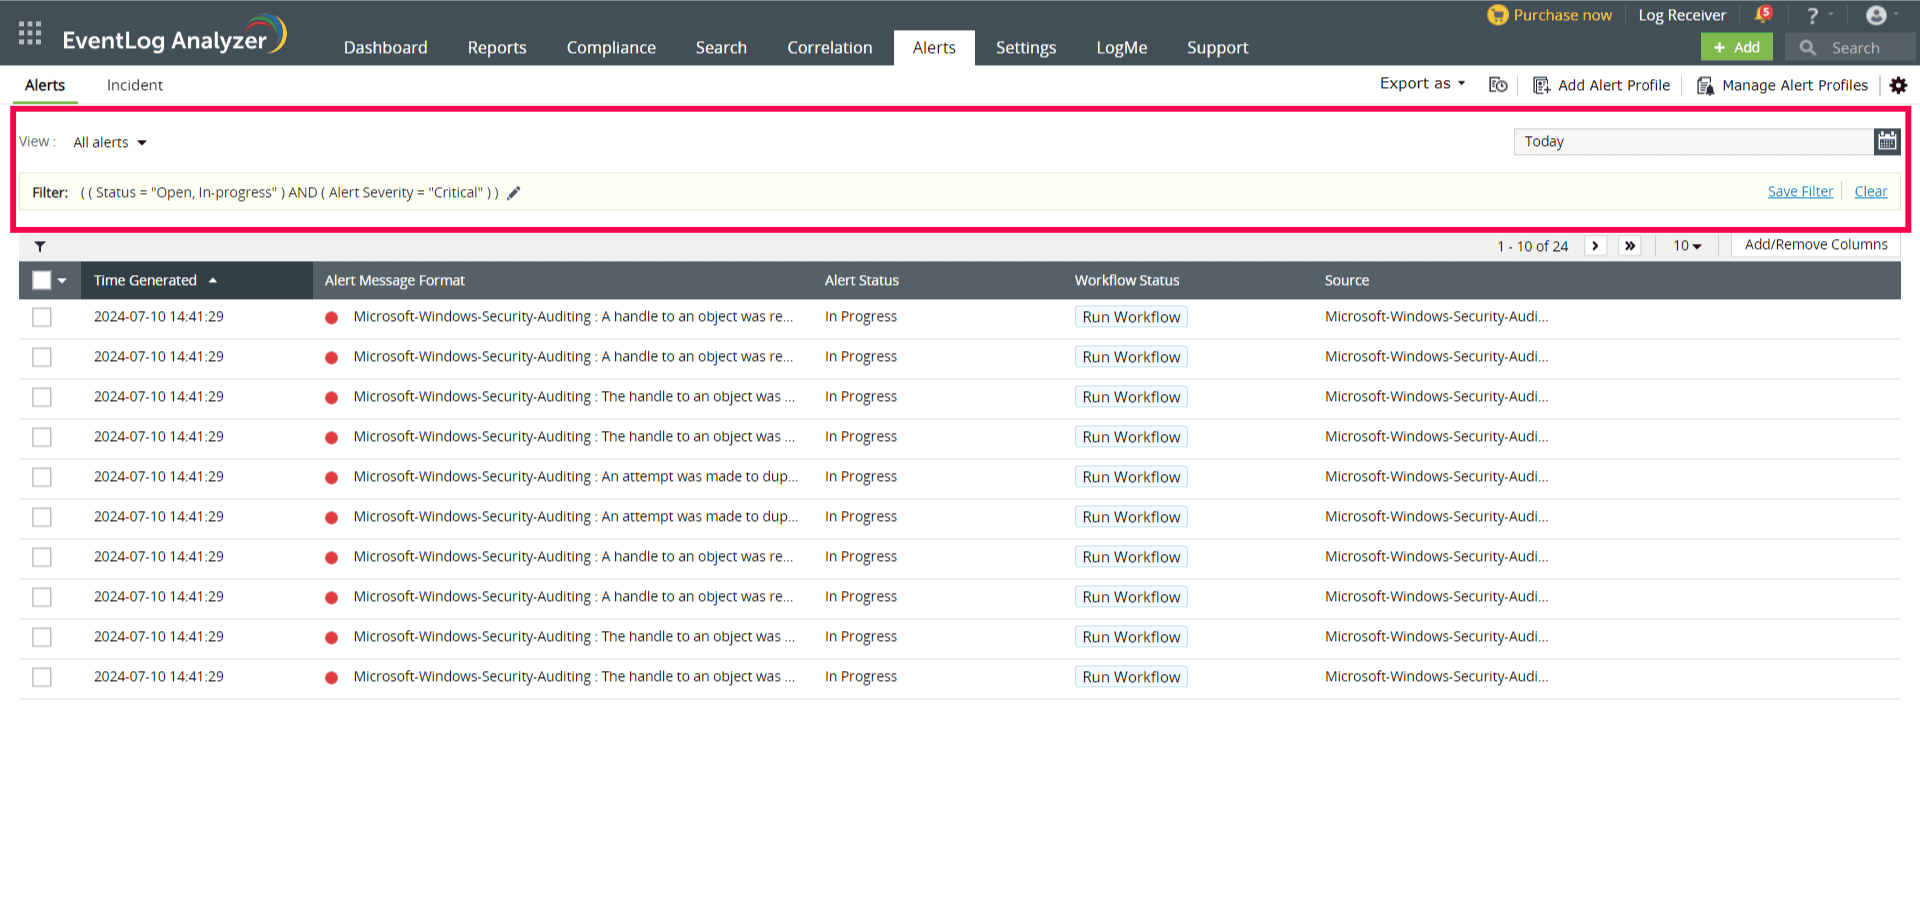
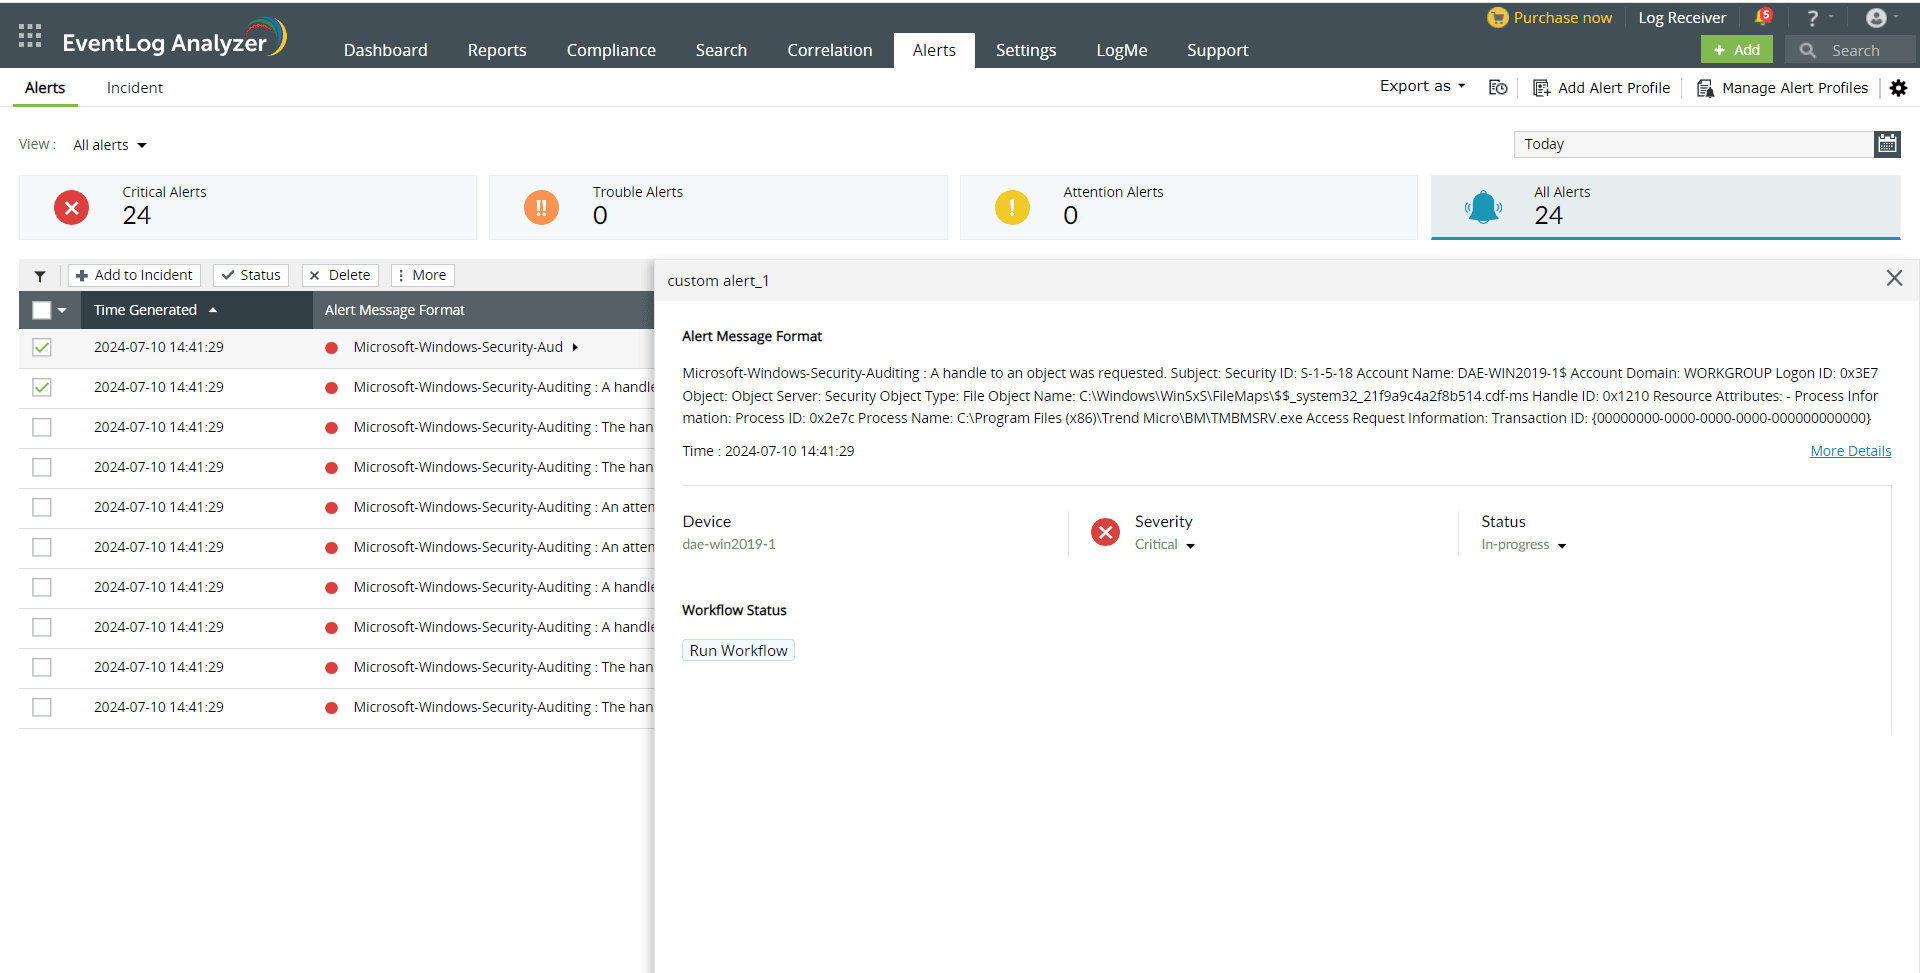
The Alerts tab lists details of all alerts triggered (if you have not set up any alert profiles, the tab directs you to do so). You can view the timestamp of the alert, the device which triggered it, the severity, the status of the alert, and the message.
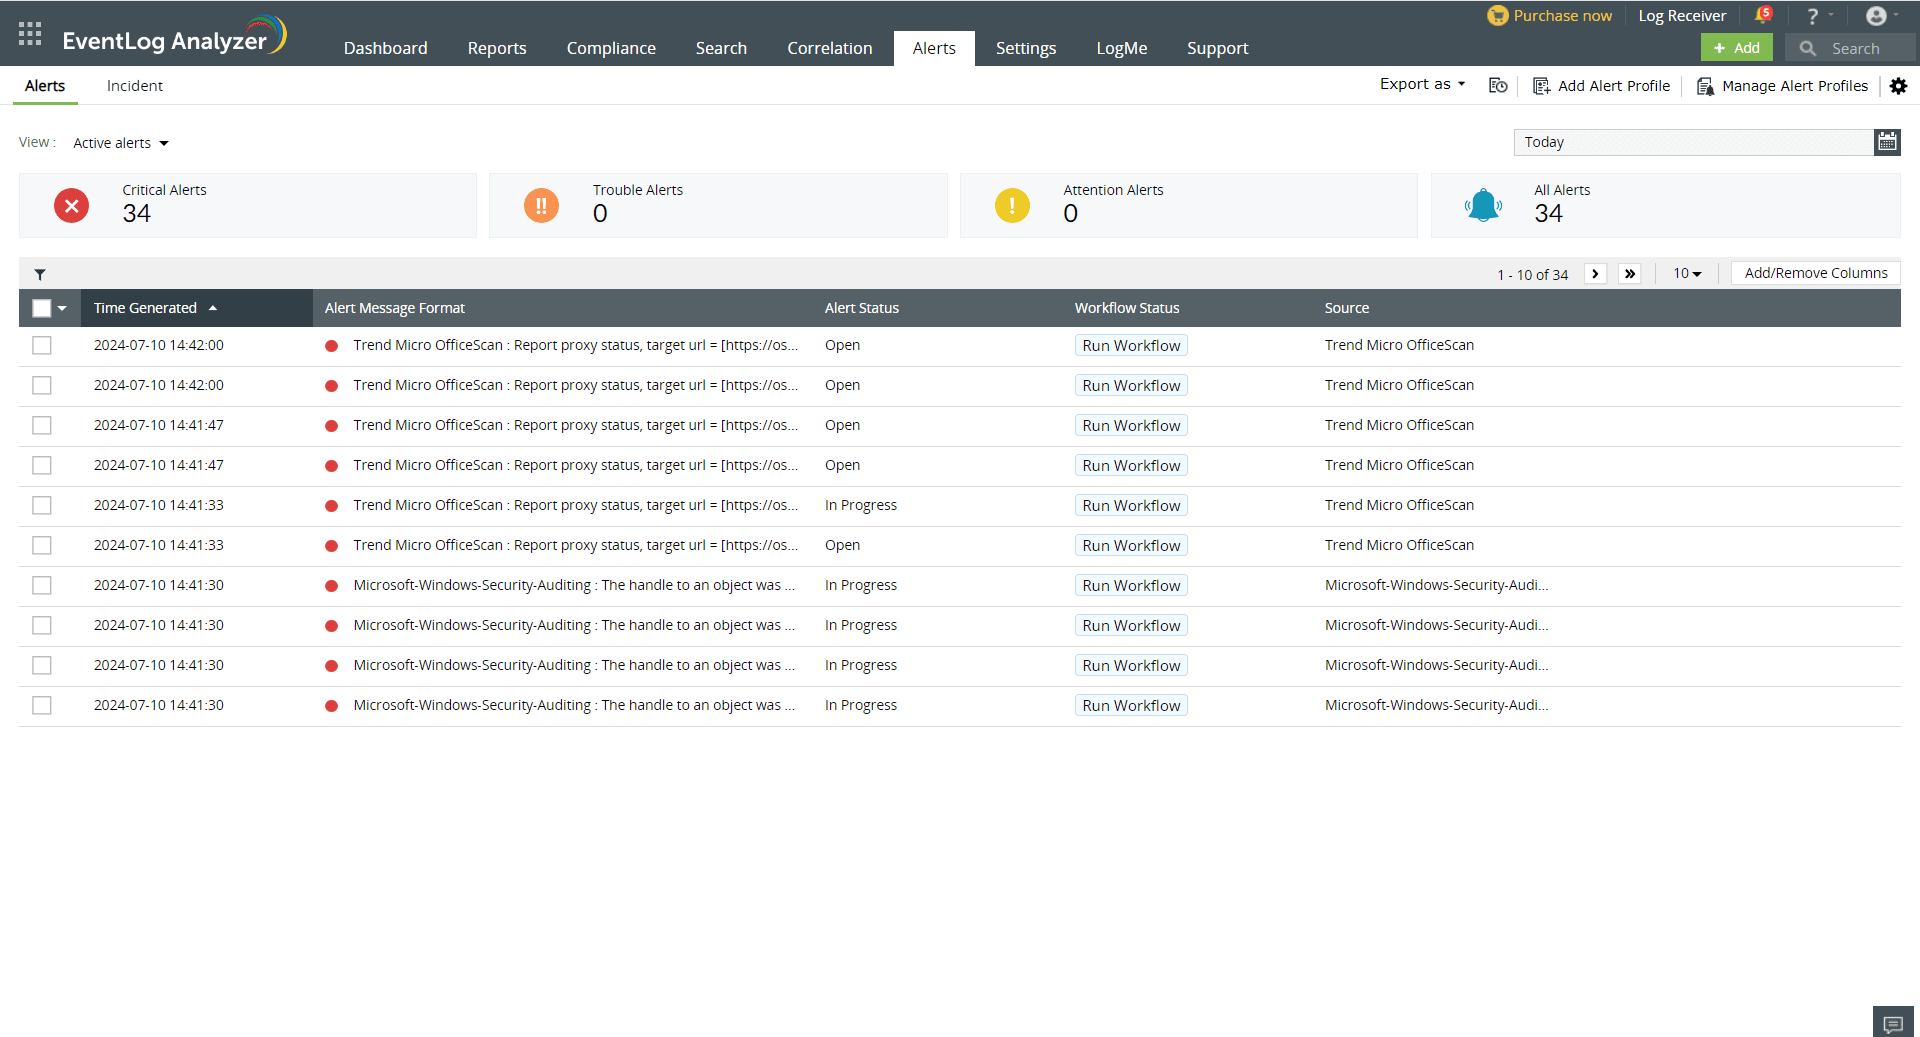

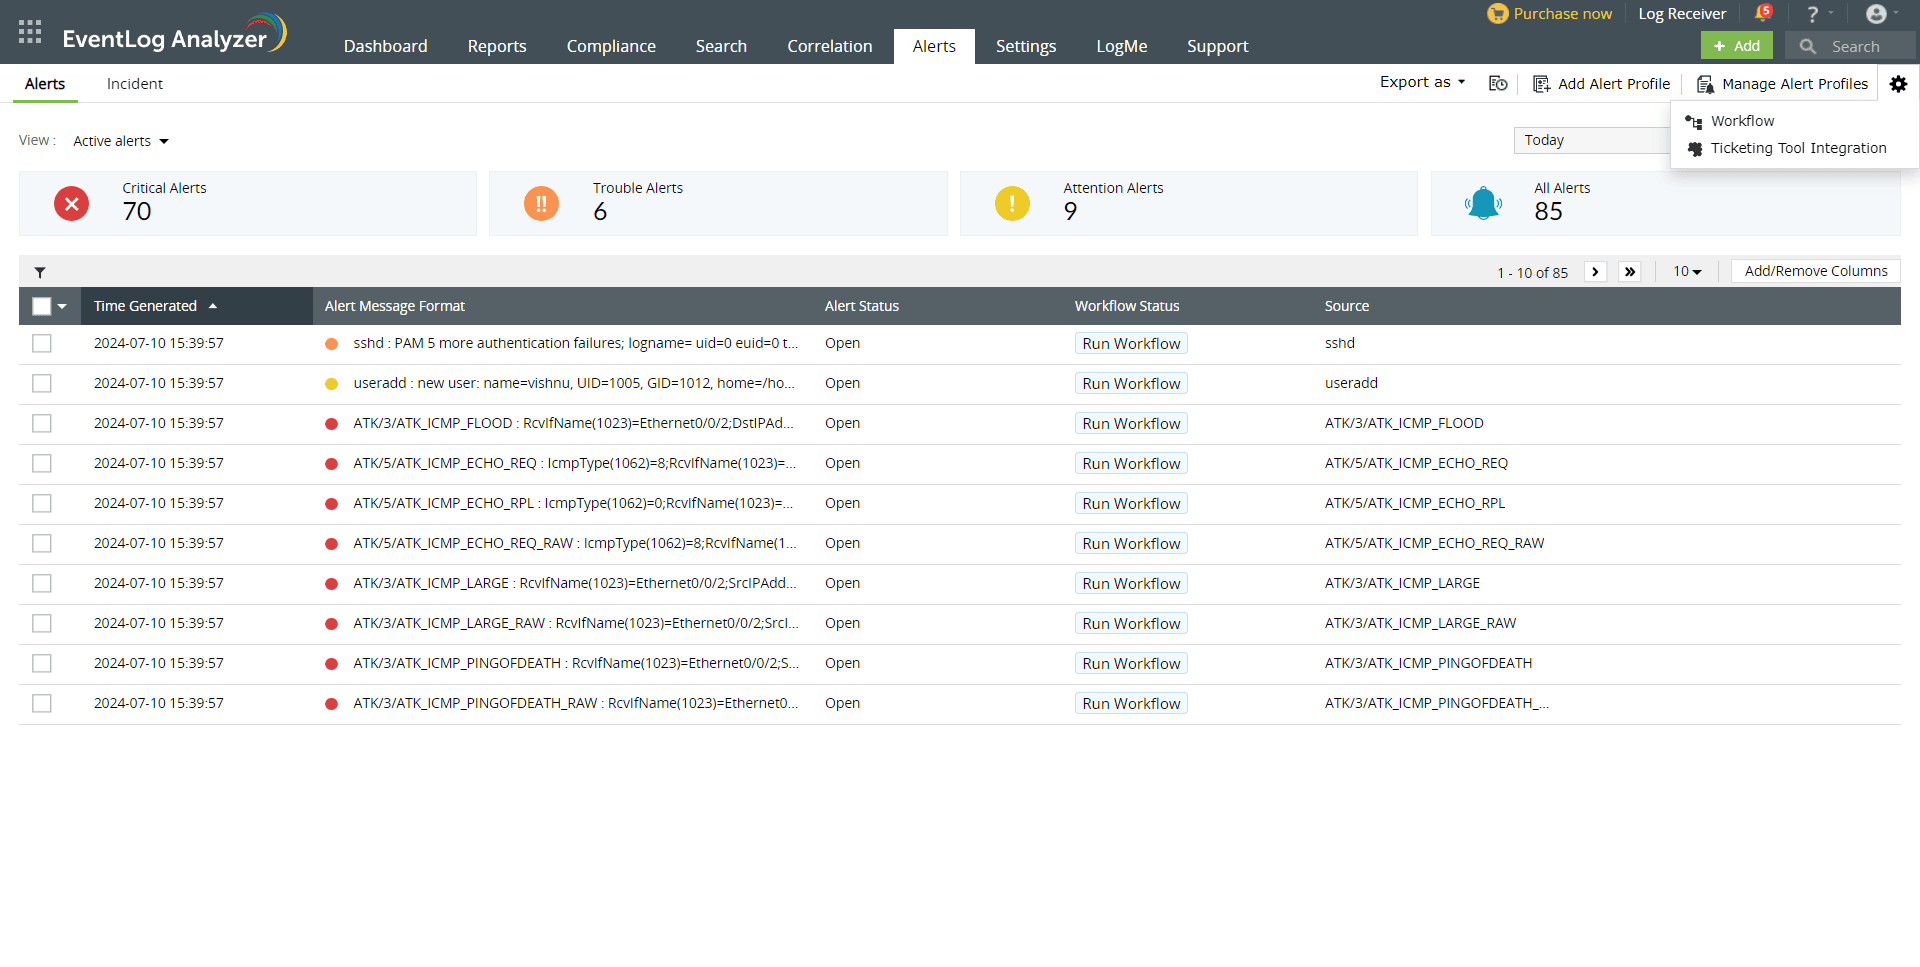
EventLog Analyzer categorizes the alerts as views Active alerts, Critical alerts, Trouble alerts, Critical alerts, Attention alerts, and All alerts. You can select the required view from the Select view drop-down menu.
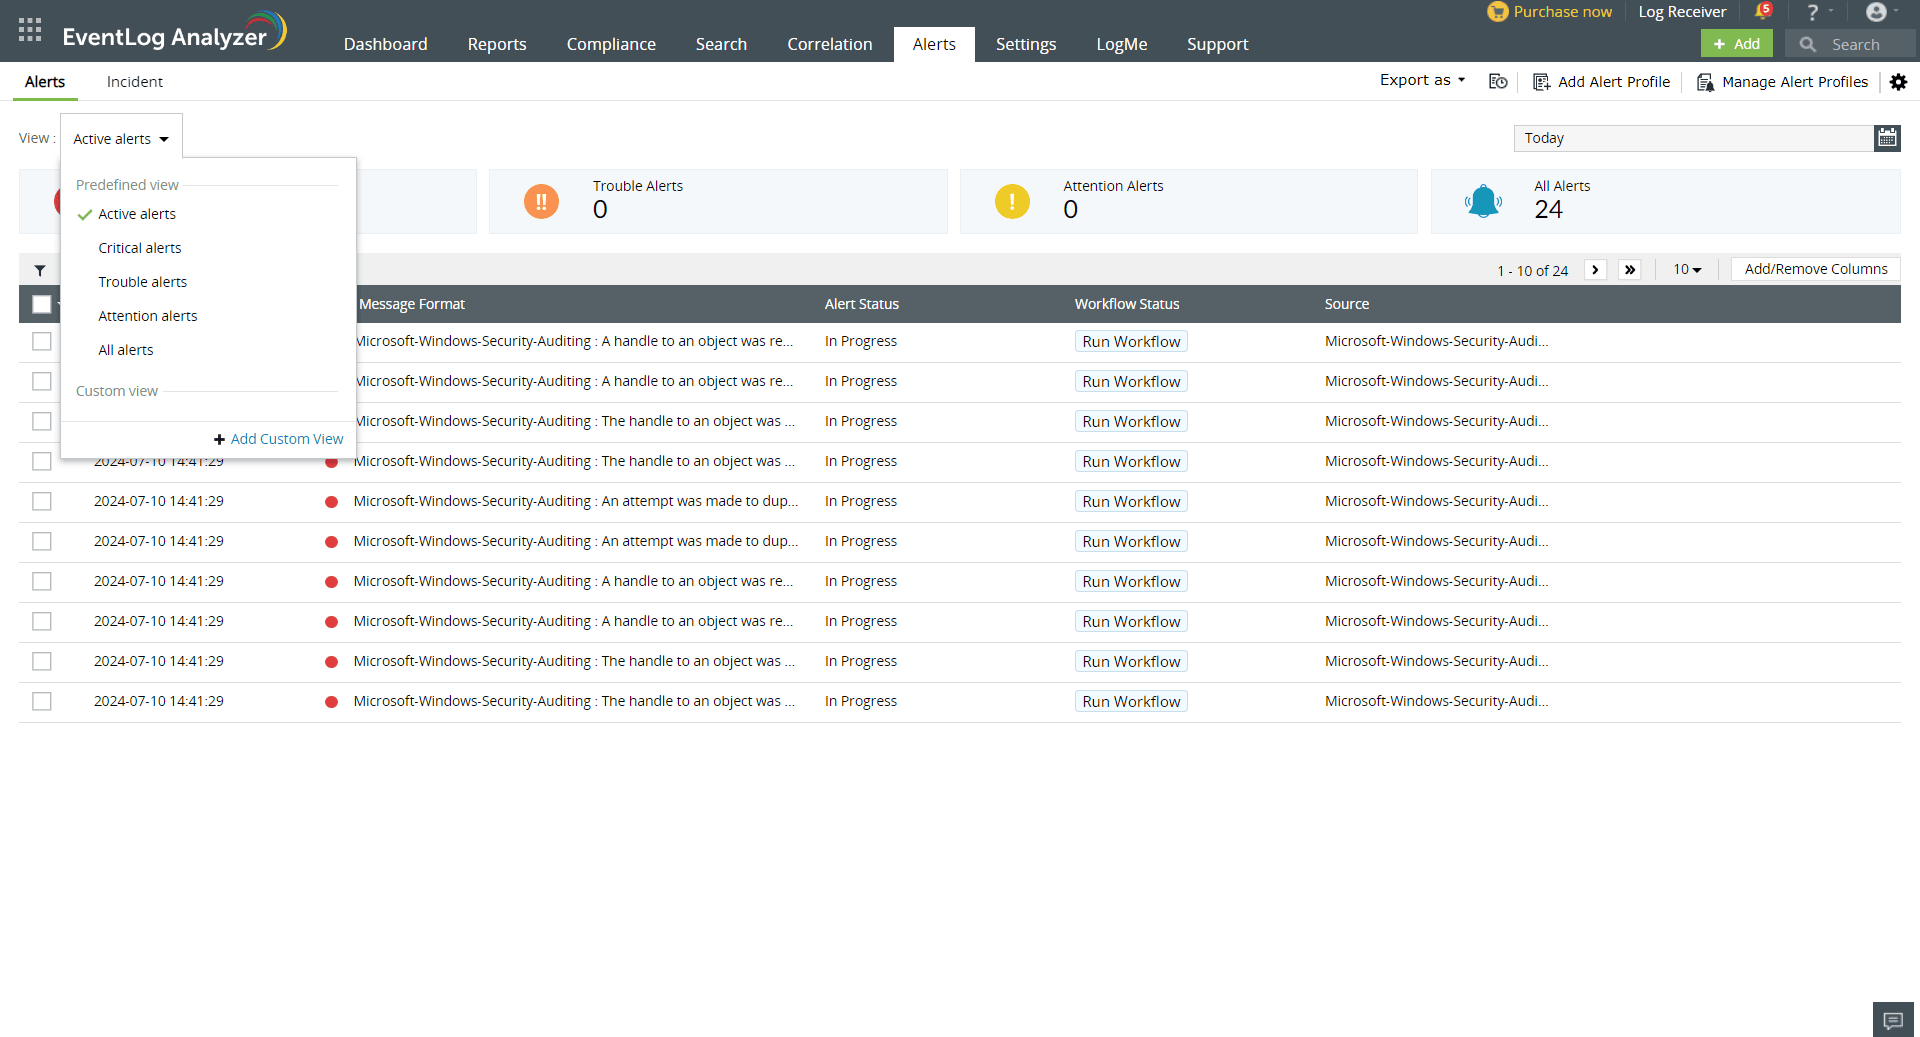
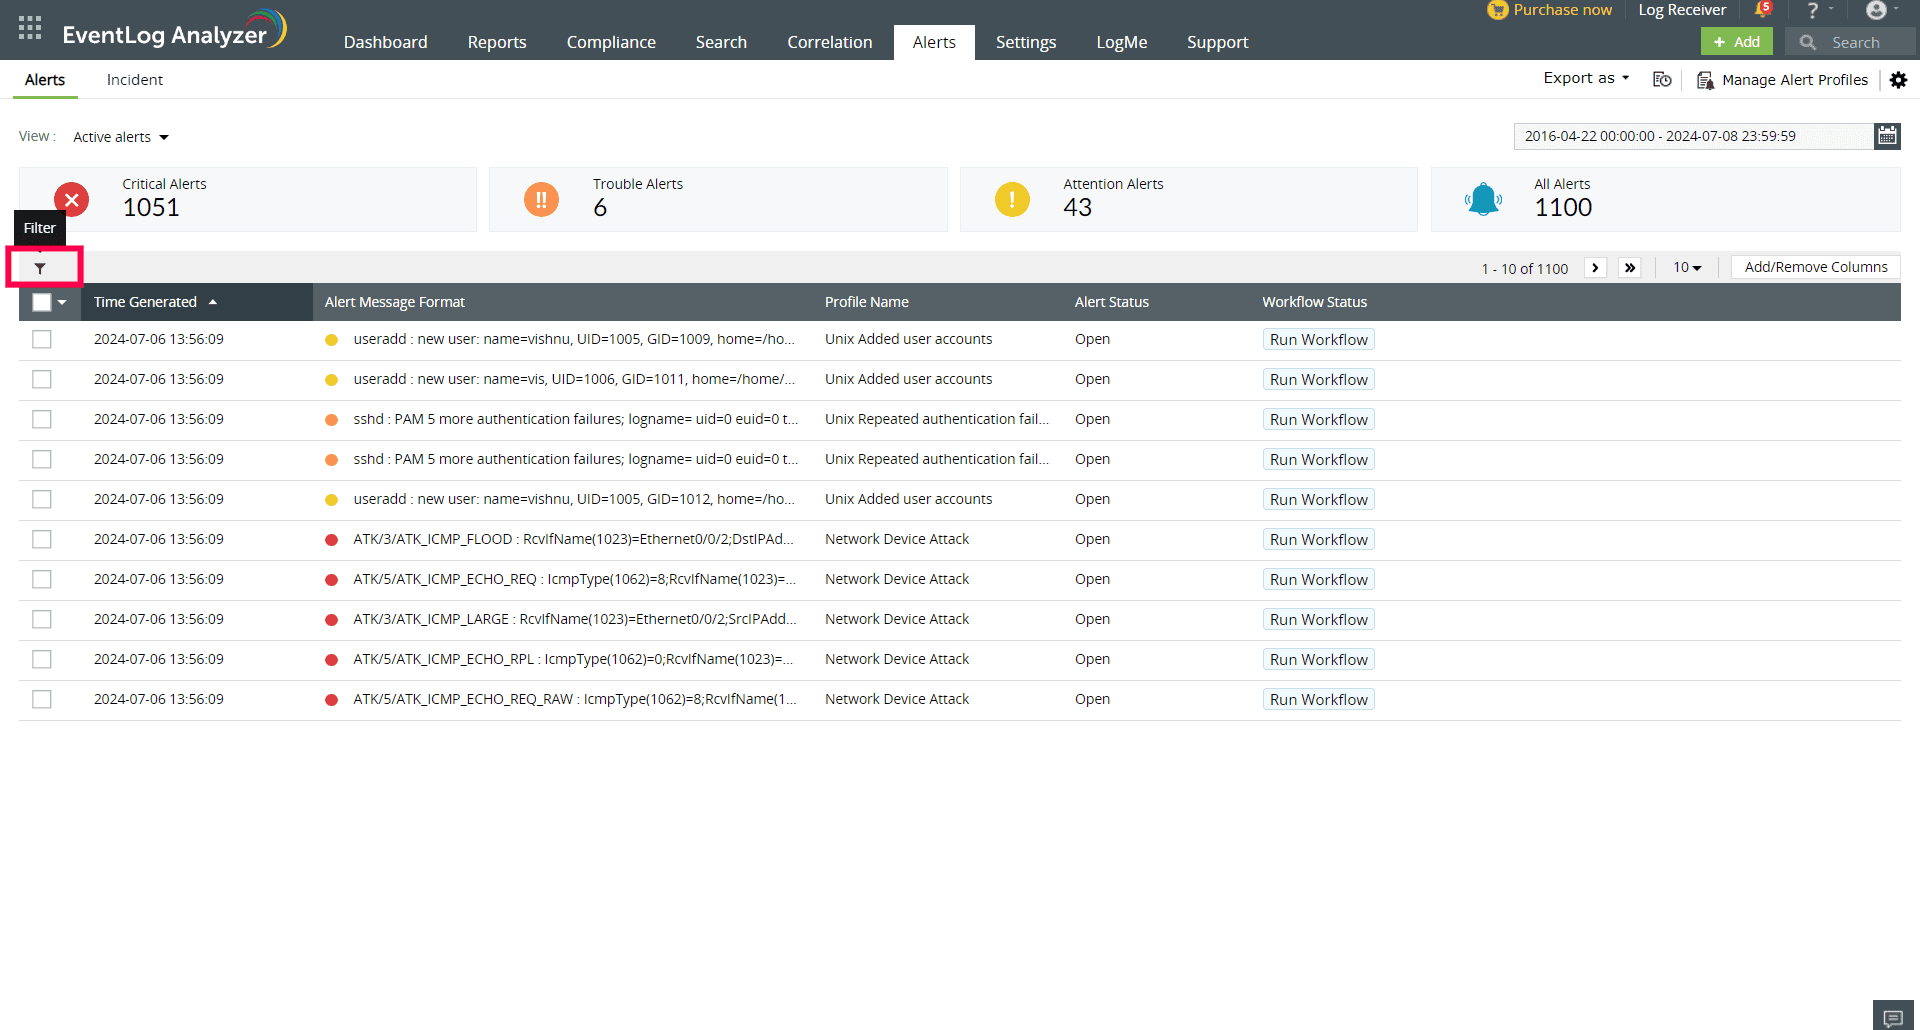
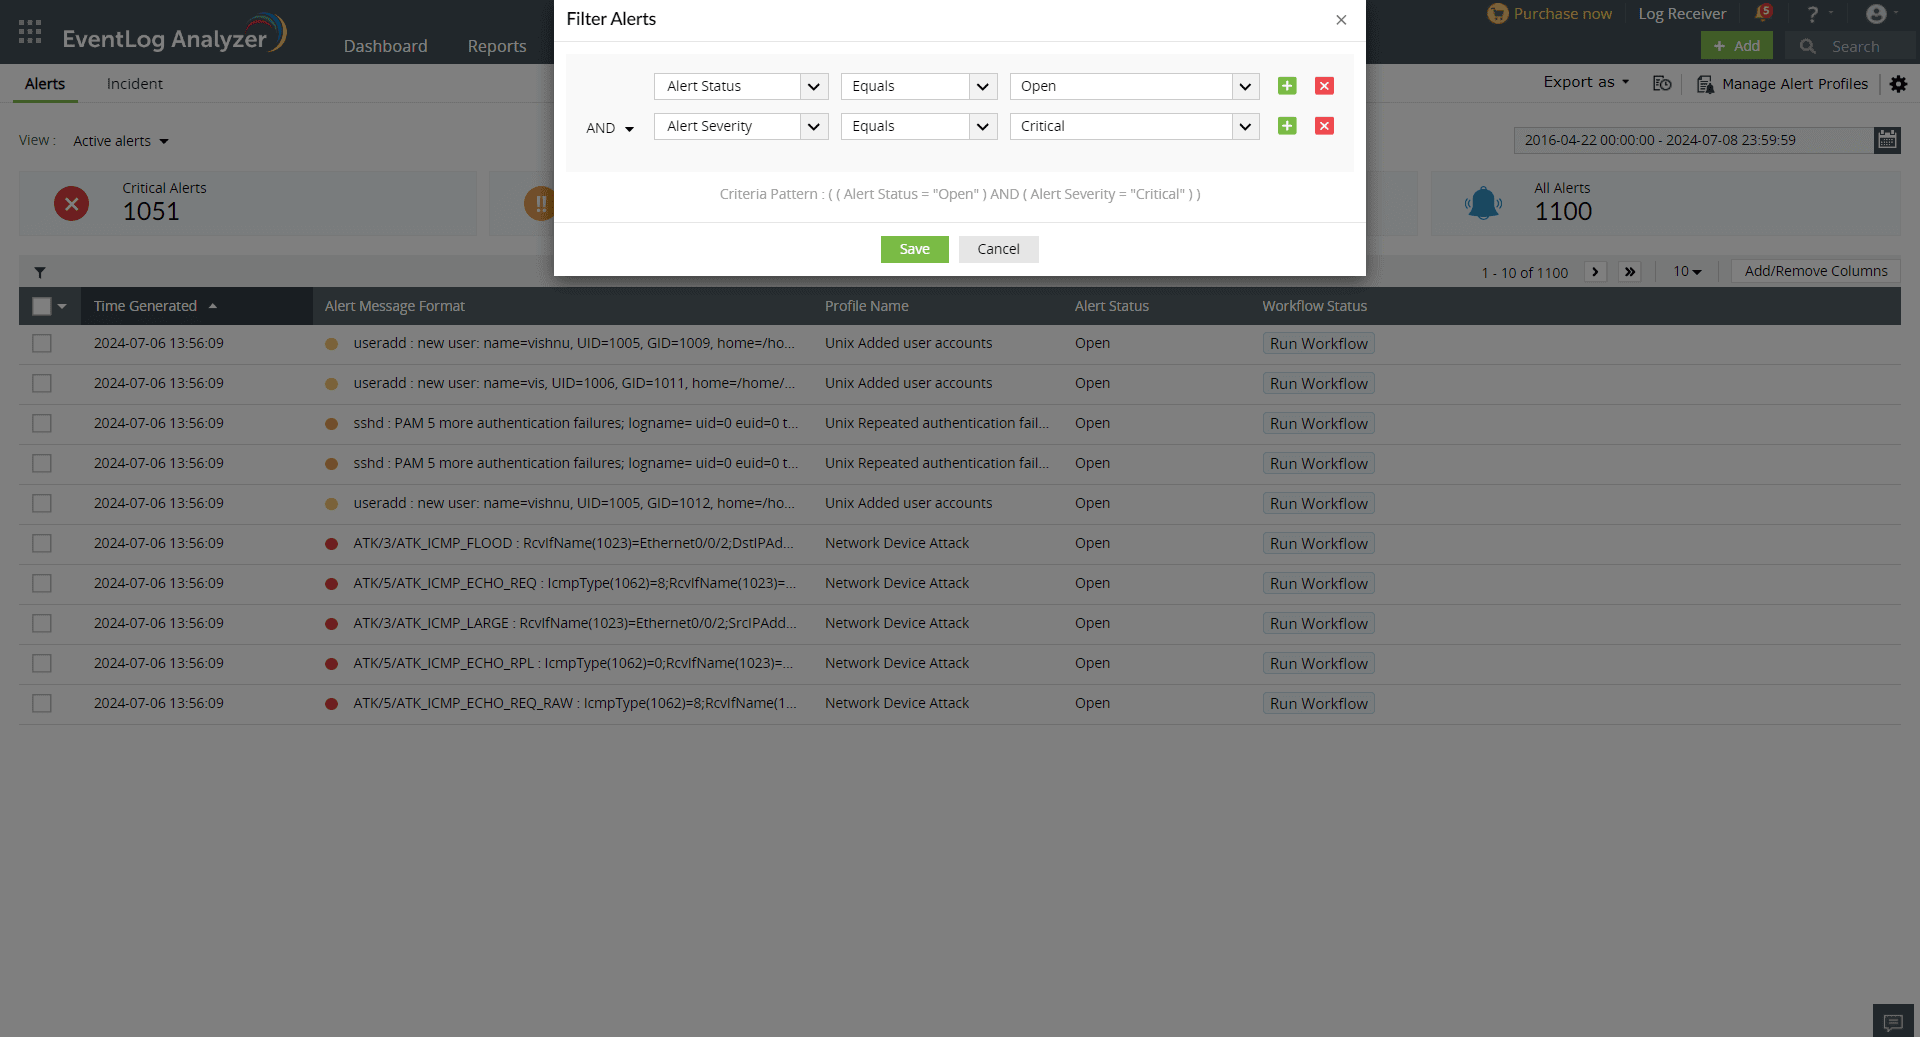
You can also create custom views for alerts by configuring a filter for the alert and clicking Apply. Click the Save As View link to enter a name for the view and click Save.
The custom views can only be viewed by the respective users who created the views. Hover your mouse pointer over the created view in the Select View drop-down menu to edit and delete the created views.
You can access the following options from the top right corner of the Alerts page:
Click the settings icon on the top right corner of the page to view the following options:
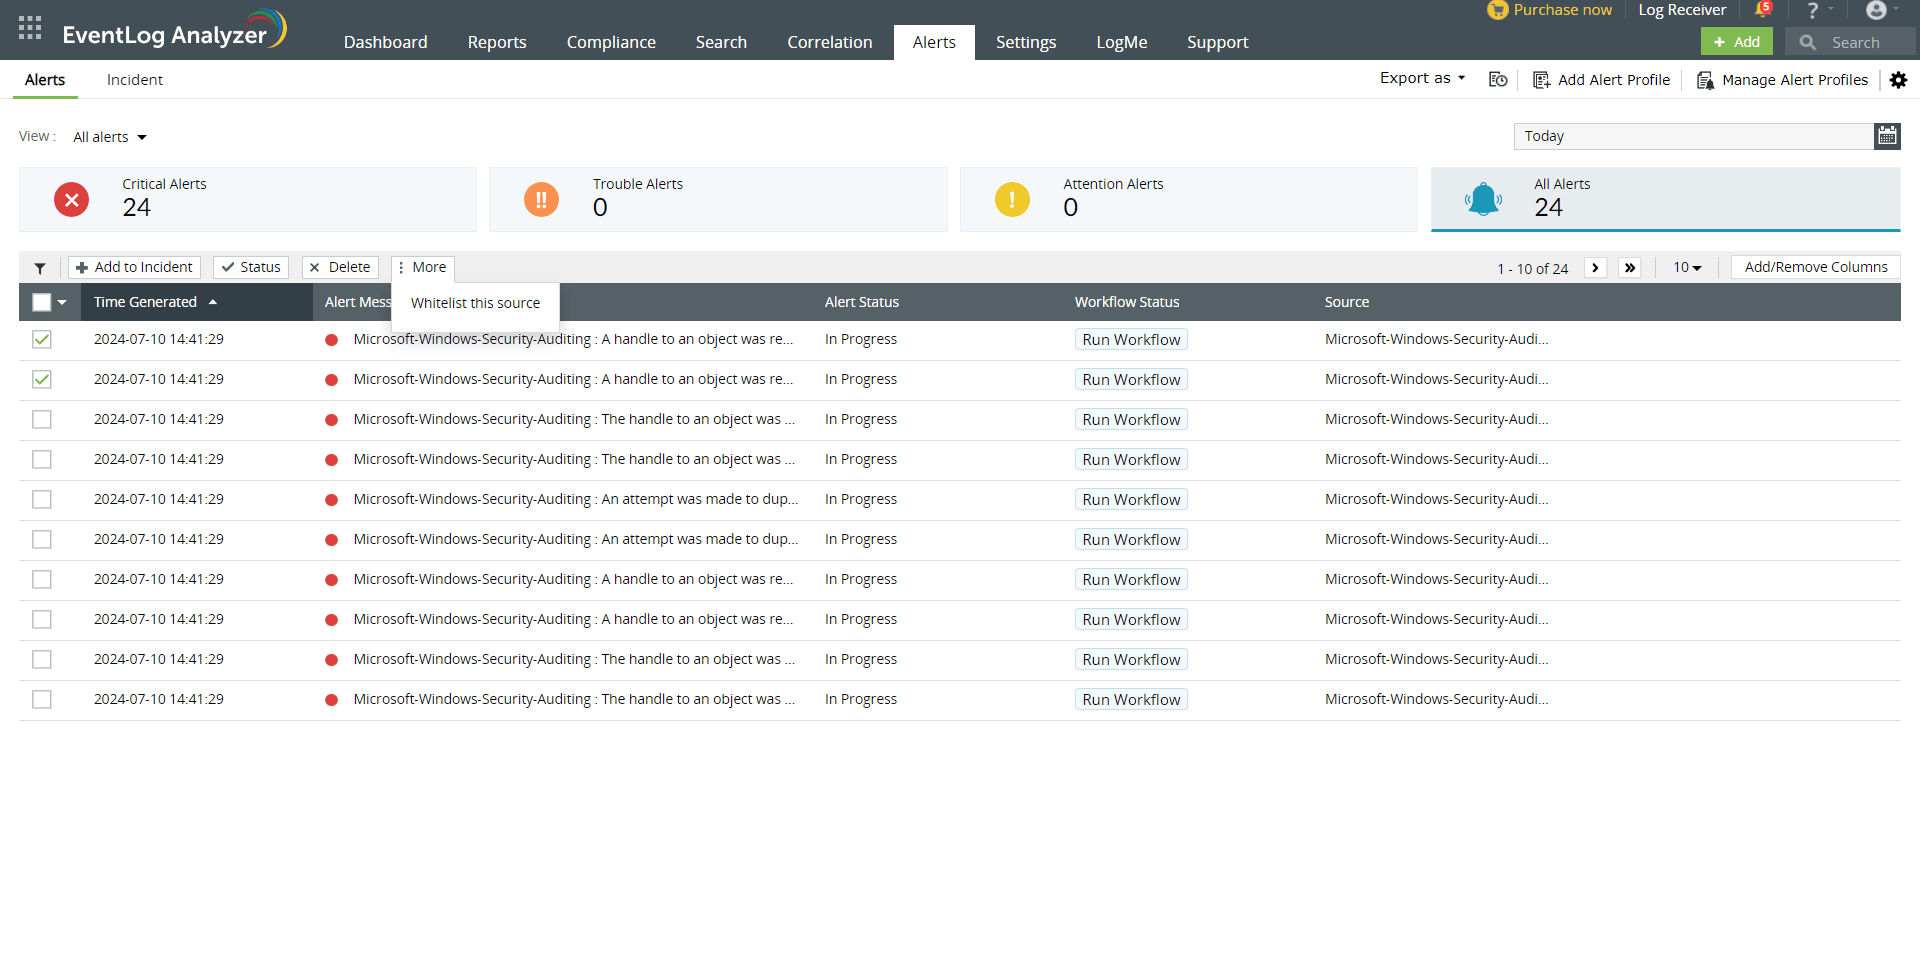
Click on the check boxes to select the required alerts. Once the alerts are selected, the options Assign, Status, Delete, and More will appear. You can assign the alert to an administrator, change the status, or delete the alerts by choosing the appropriate options.
Clicking on More will give you the option to Whitelist the Source. In case an alert is raised by Advanced Threat Analytics and you are convinced that the source is not malicious, you can whitelist it by choosing the option here.

Hovering over the alert gives additional information such as what triggered the alert, the domain, the device involved and more.
Clicking on an alert opens a pop-up titled Alert Format Message.
Details such as SL Event ID, Logon Type and more can be obtained by clicking on More Details.
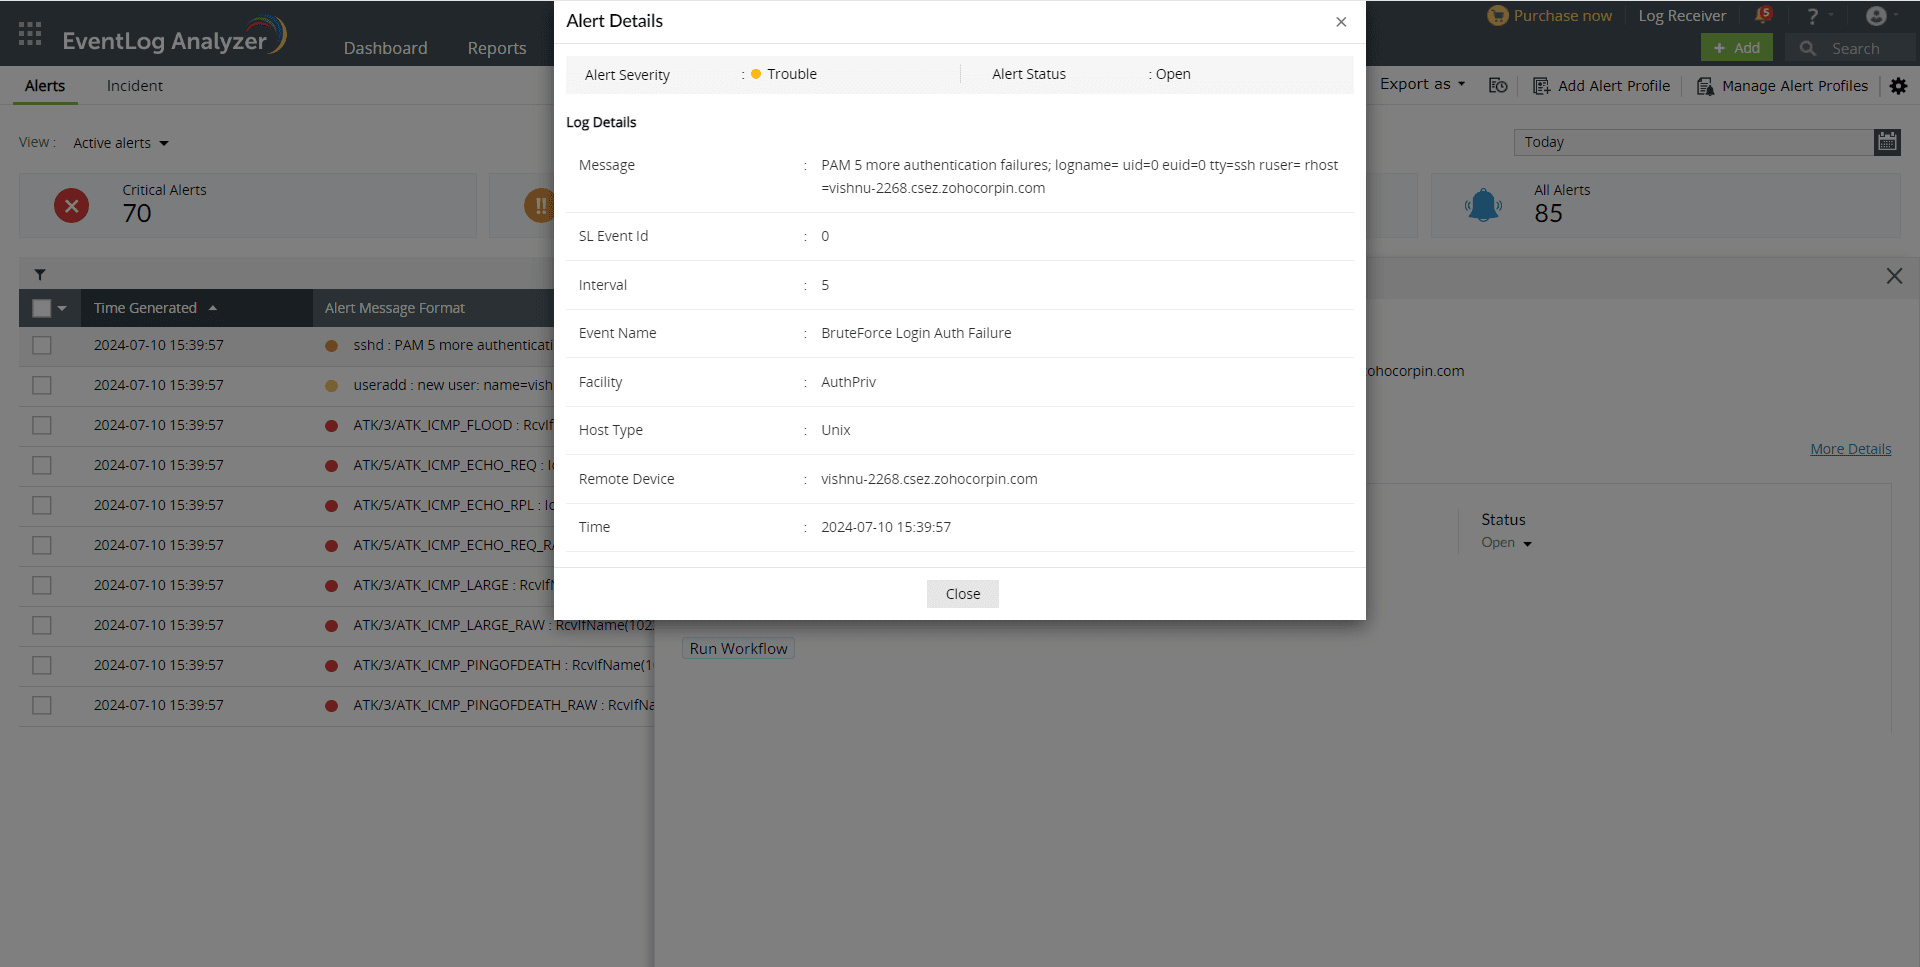
In case a workflow is configured for the alert, the status of the workflow can be viewed in the Alert Format Message pop-up.
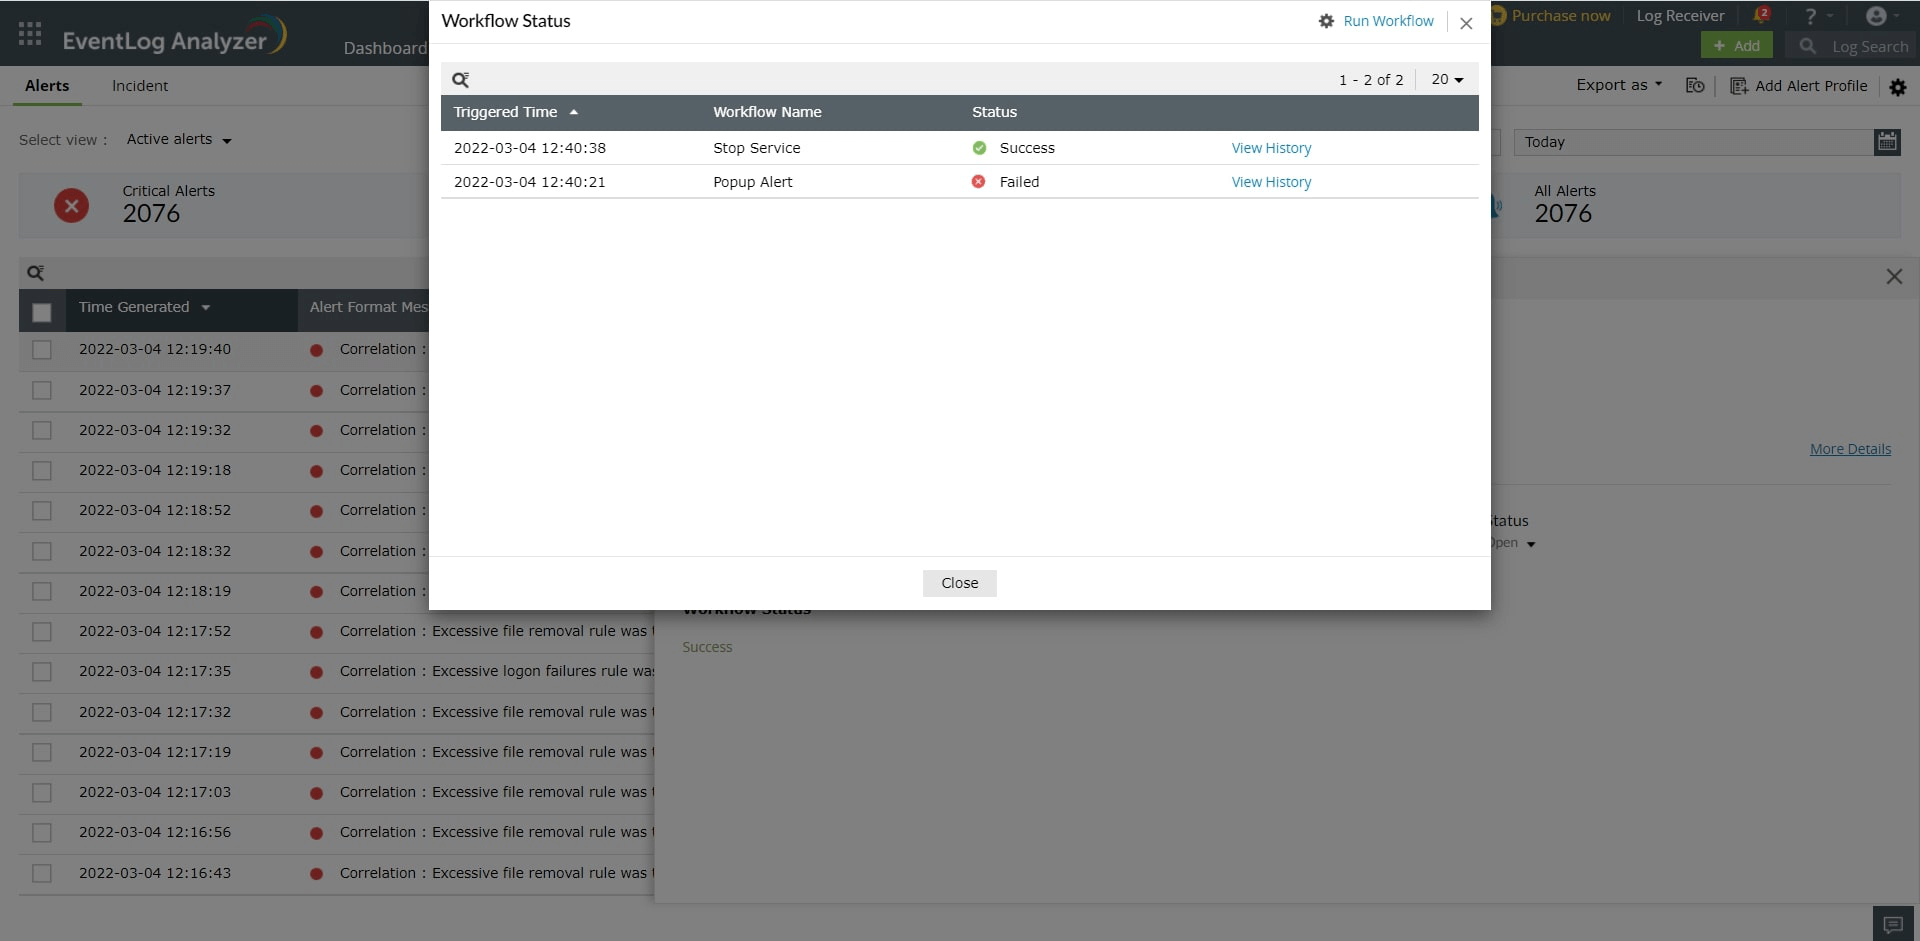
Click the status of the workflow for more information. Once clicked, a pop-up will open.
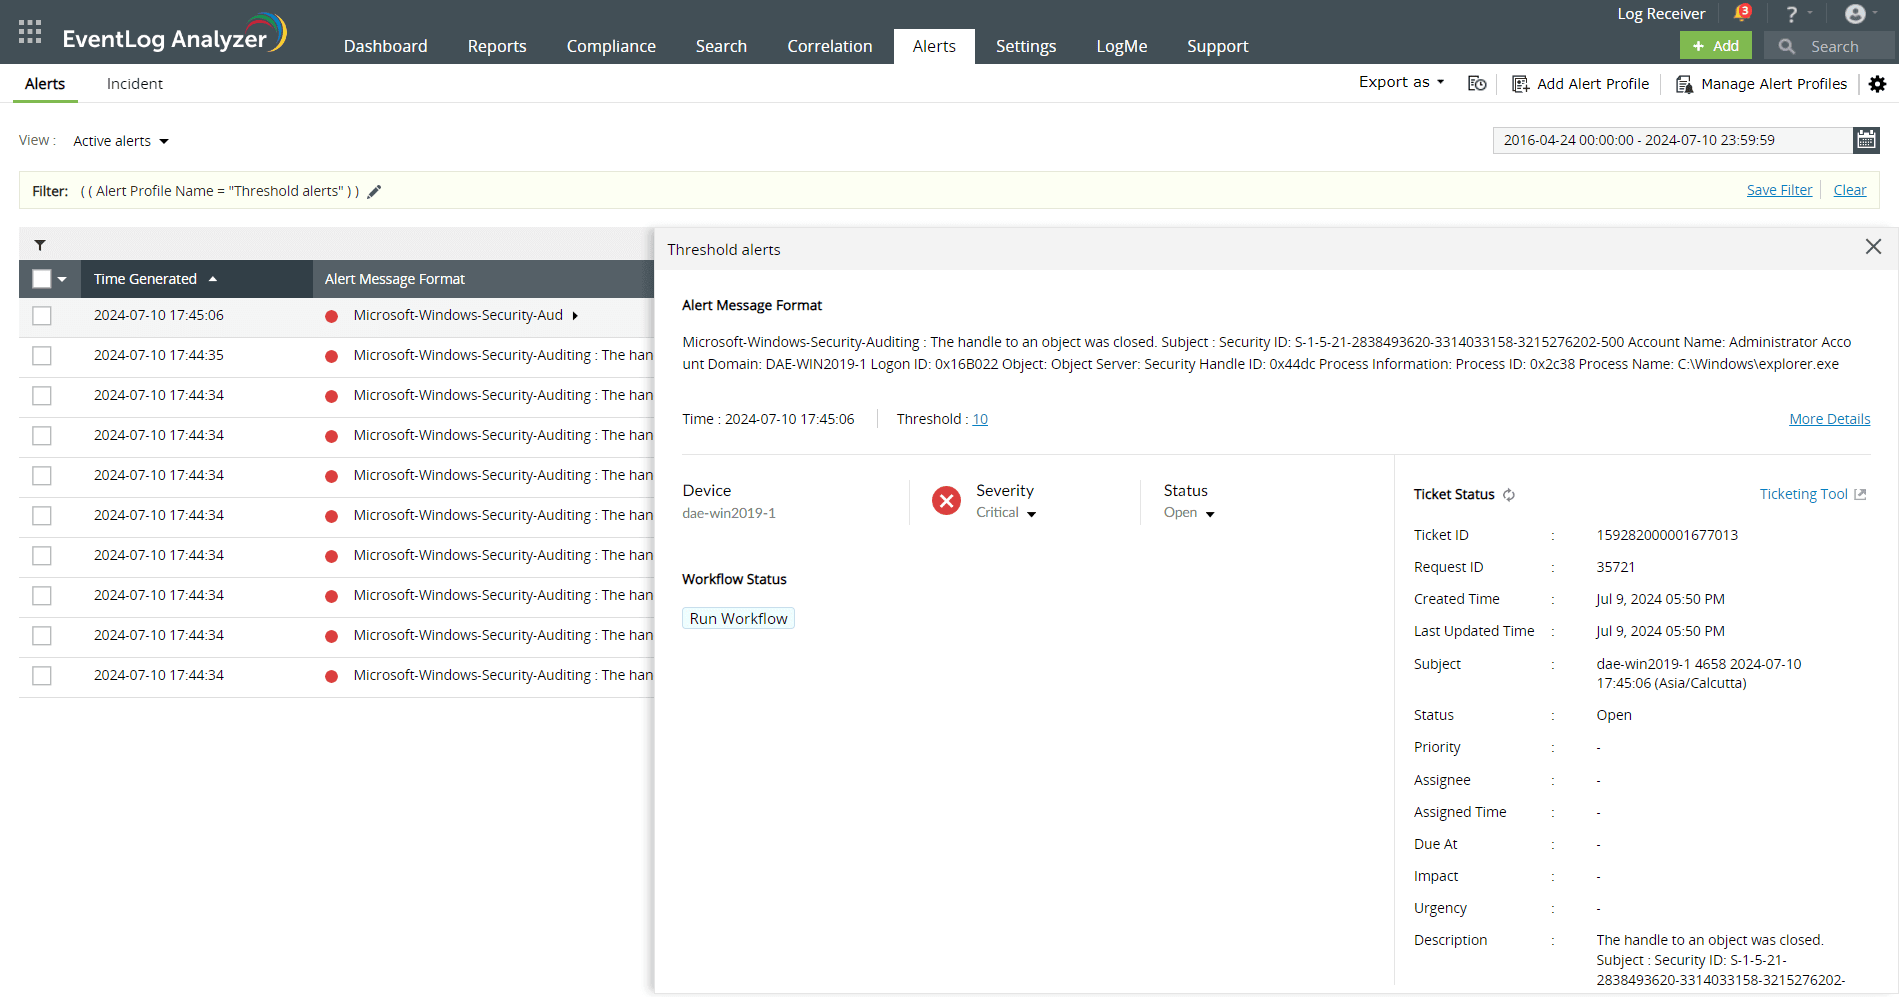
For Threshold based alerts, you can now view each instance by clicking on the alert. There will be a section called Threshold.
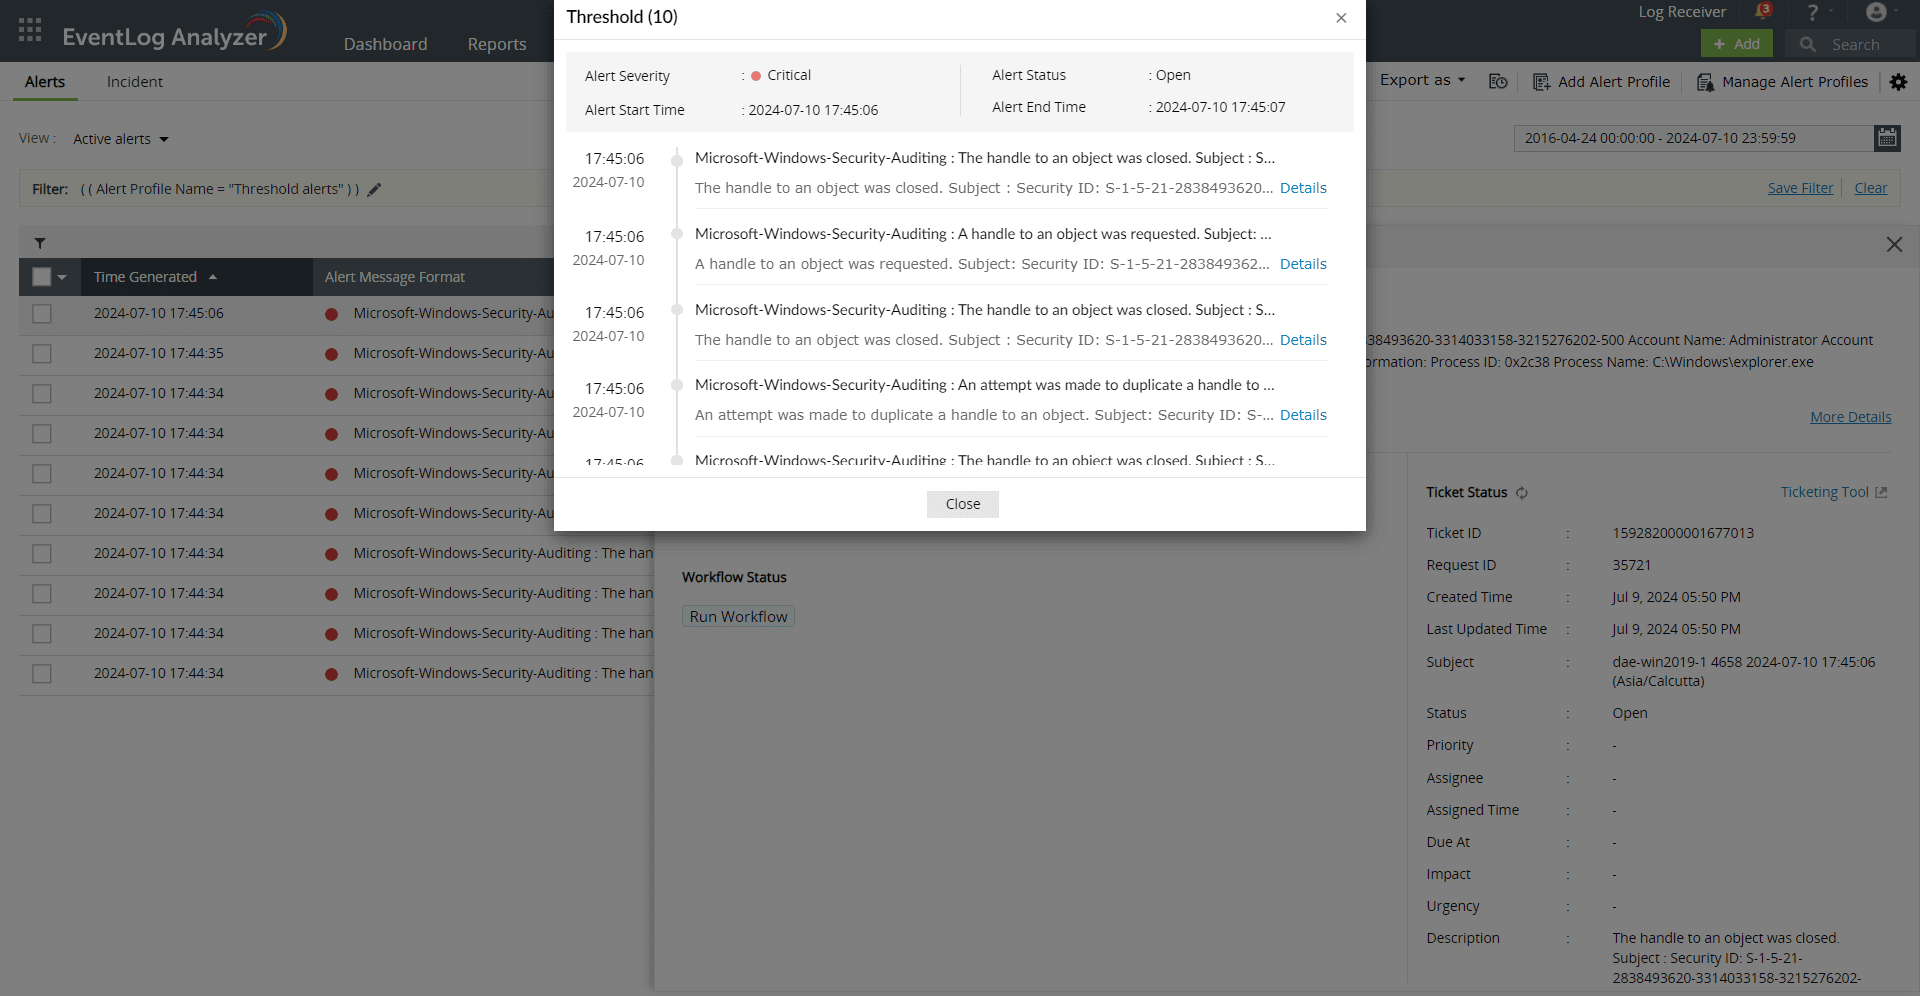
Clicking on the threshold number will give you a pop-up with more details.
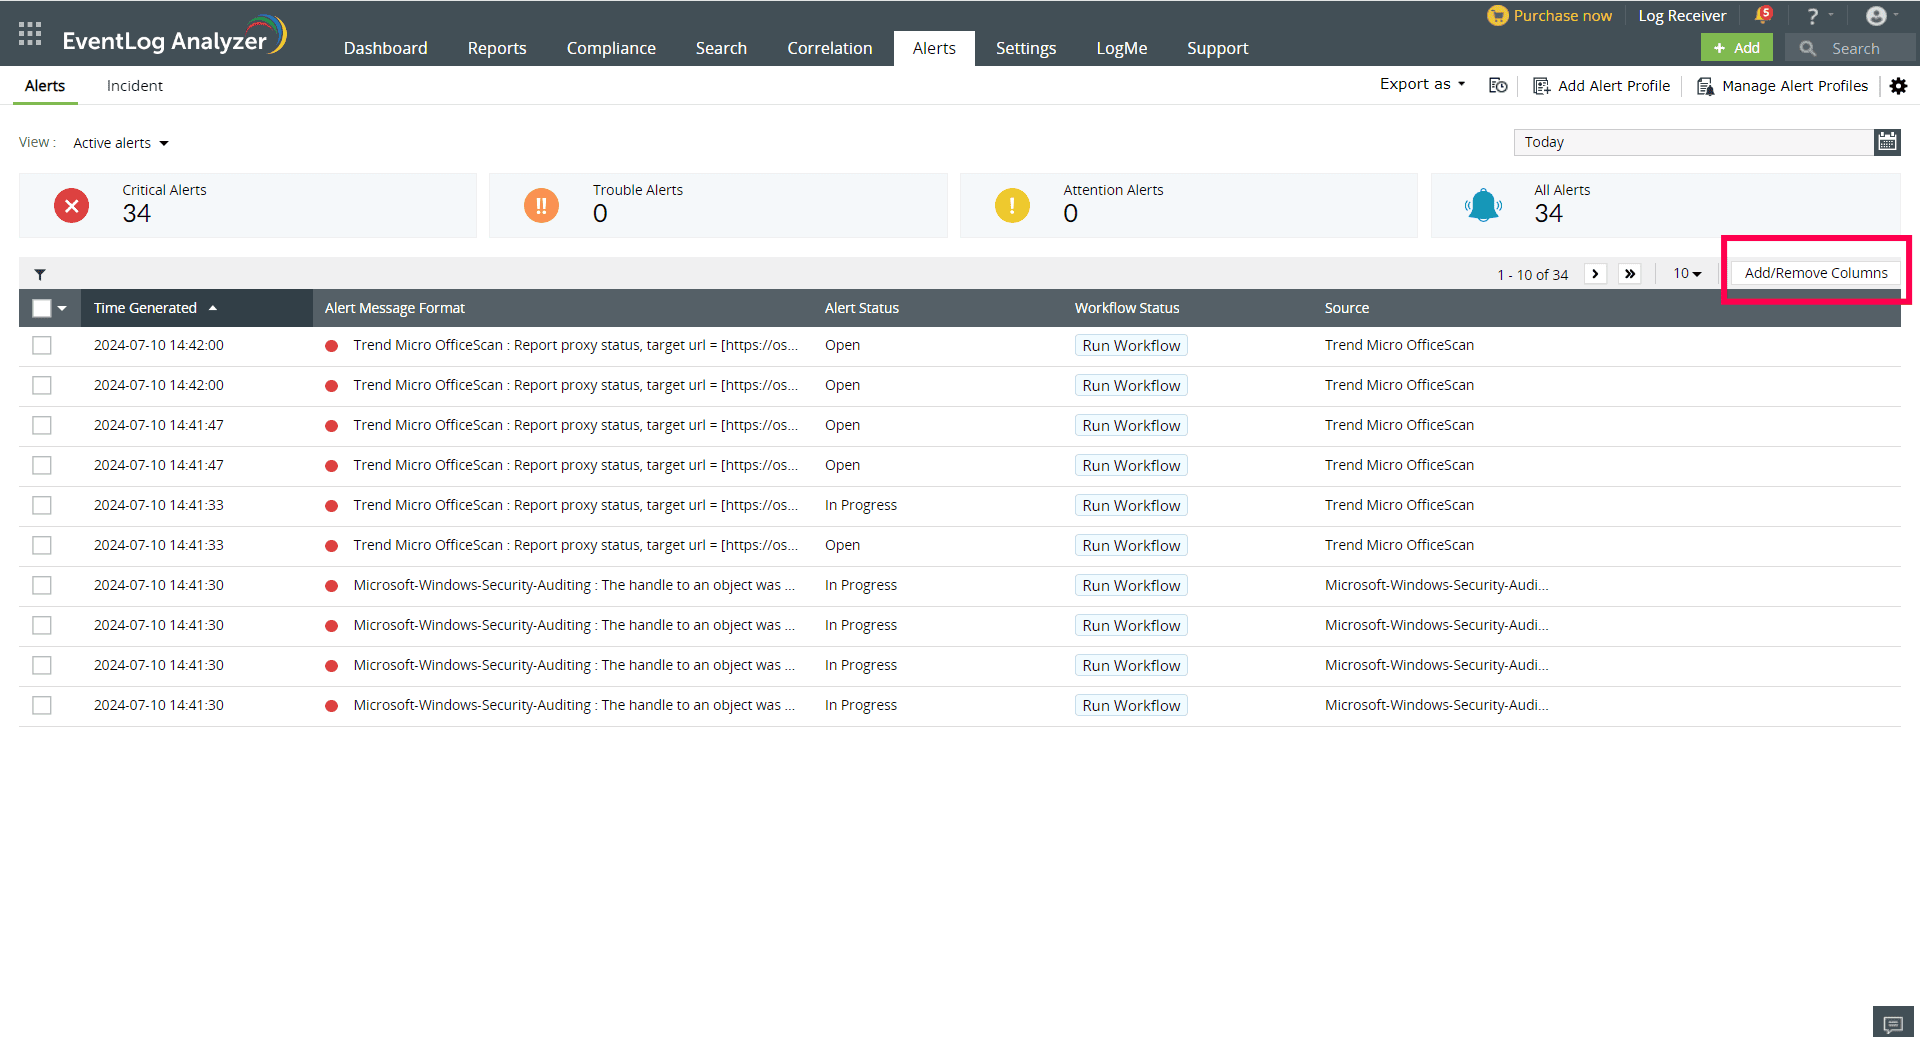
Cloumns can be added or removed by clicking on the Add / Remove option in the top right corner. You have the option to choose and rearrange the columns as needed. A minimum of 3 and maximum of 7 can be selected.
Note: The default columns cannot be removed and rearranged. The default columns are Time, Notes, and Alert Format message.
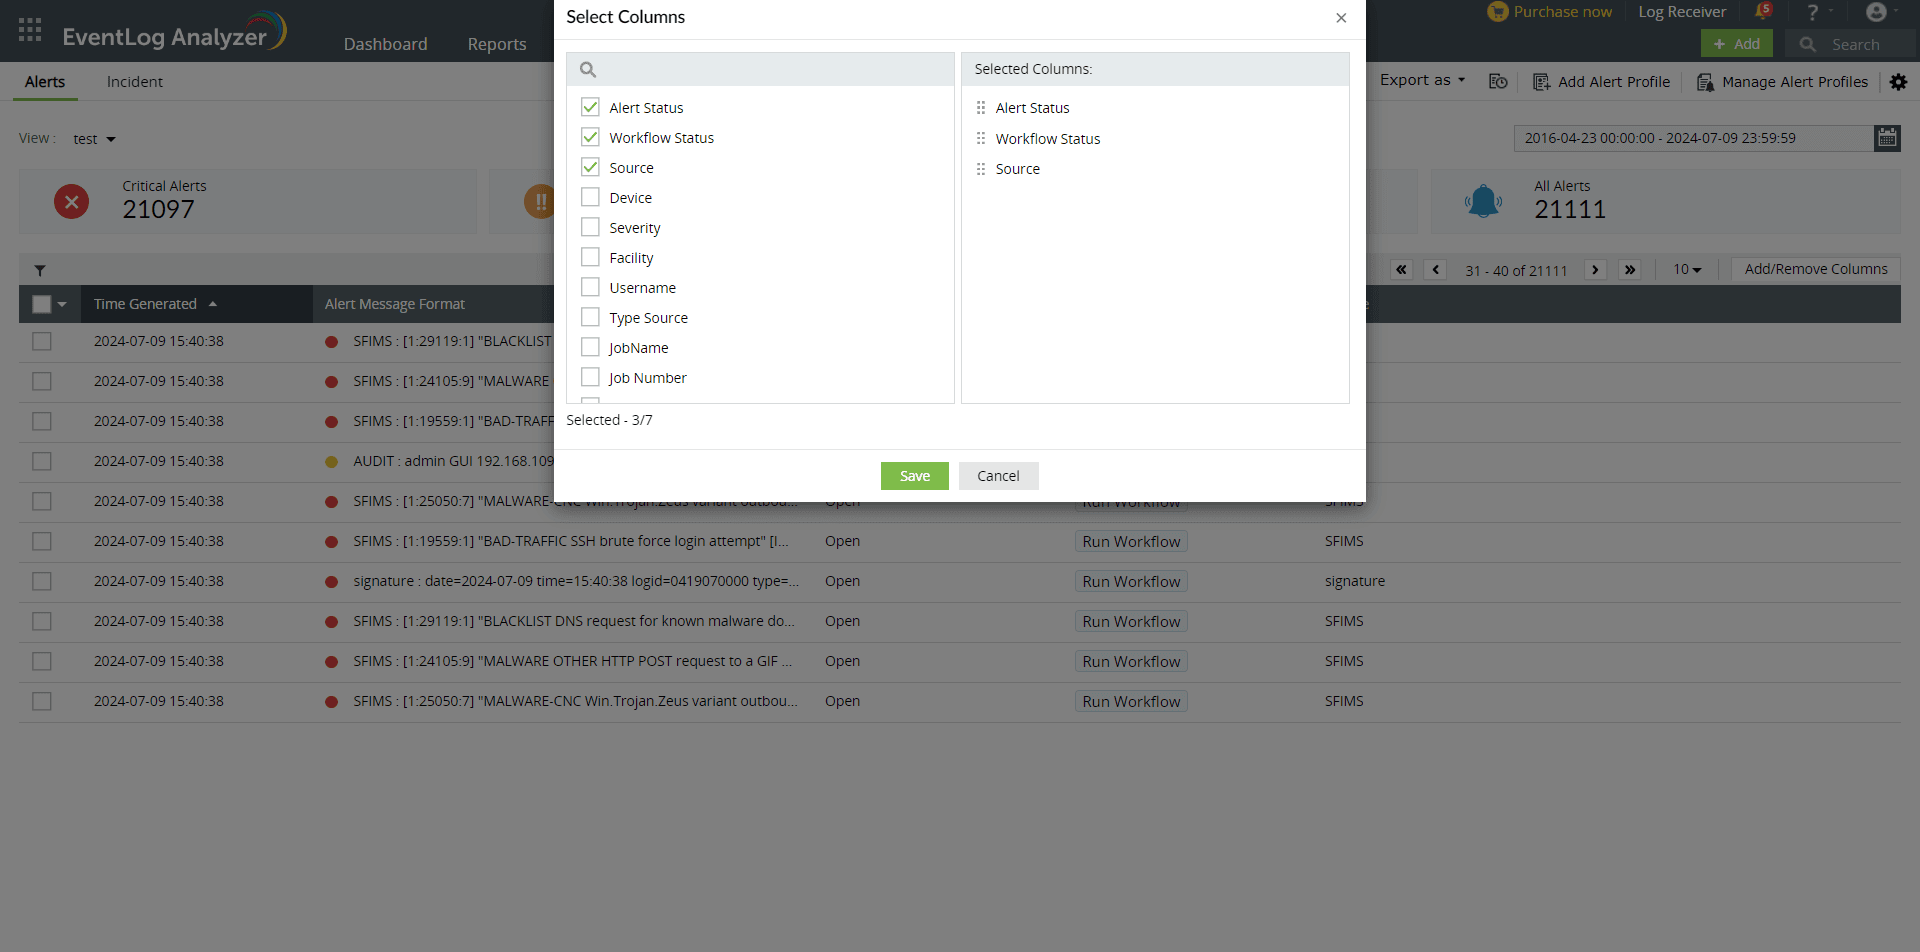
Clicking on this will give you a pop-up. Choose the required options by clicking on the checkboxes.
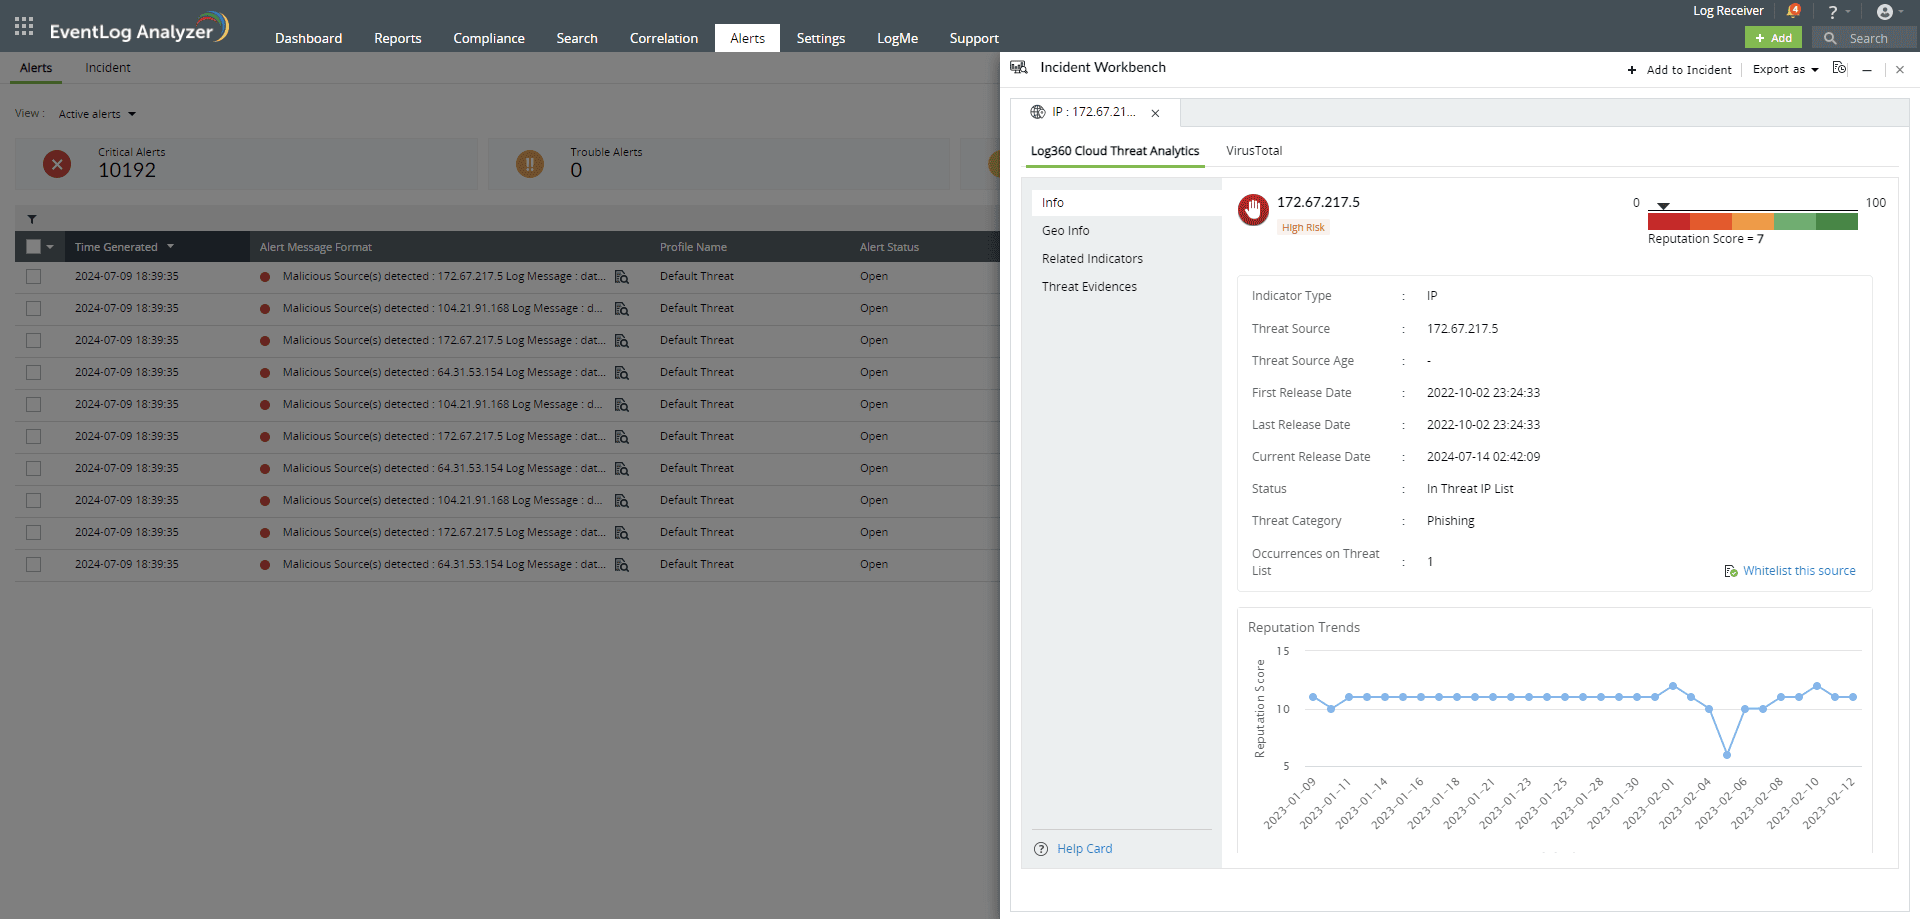
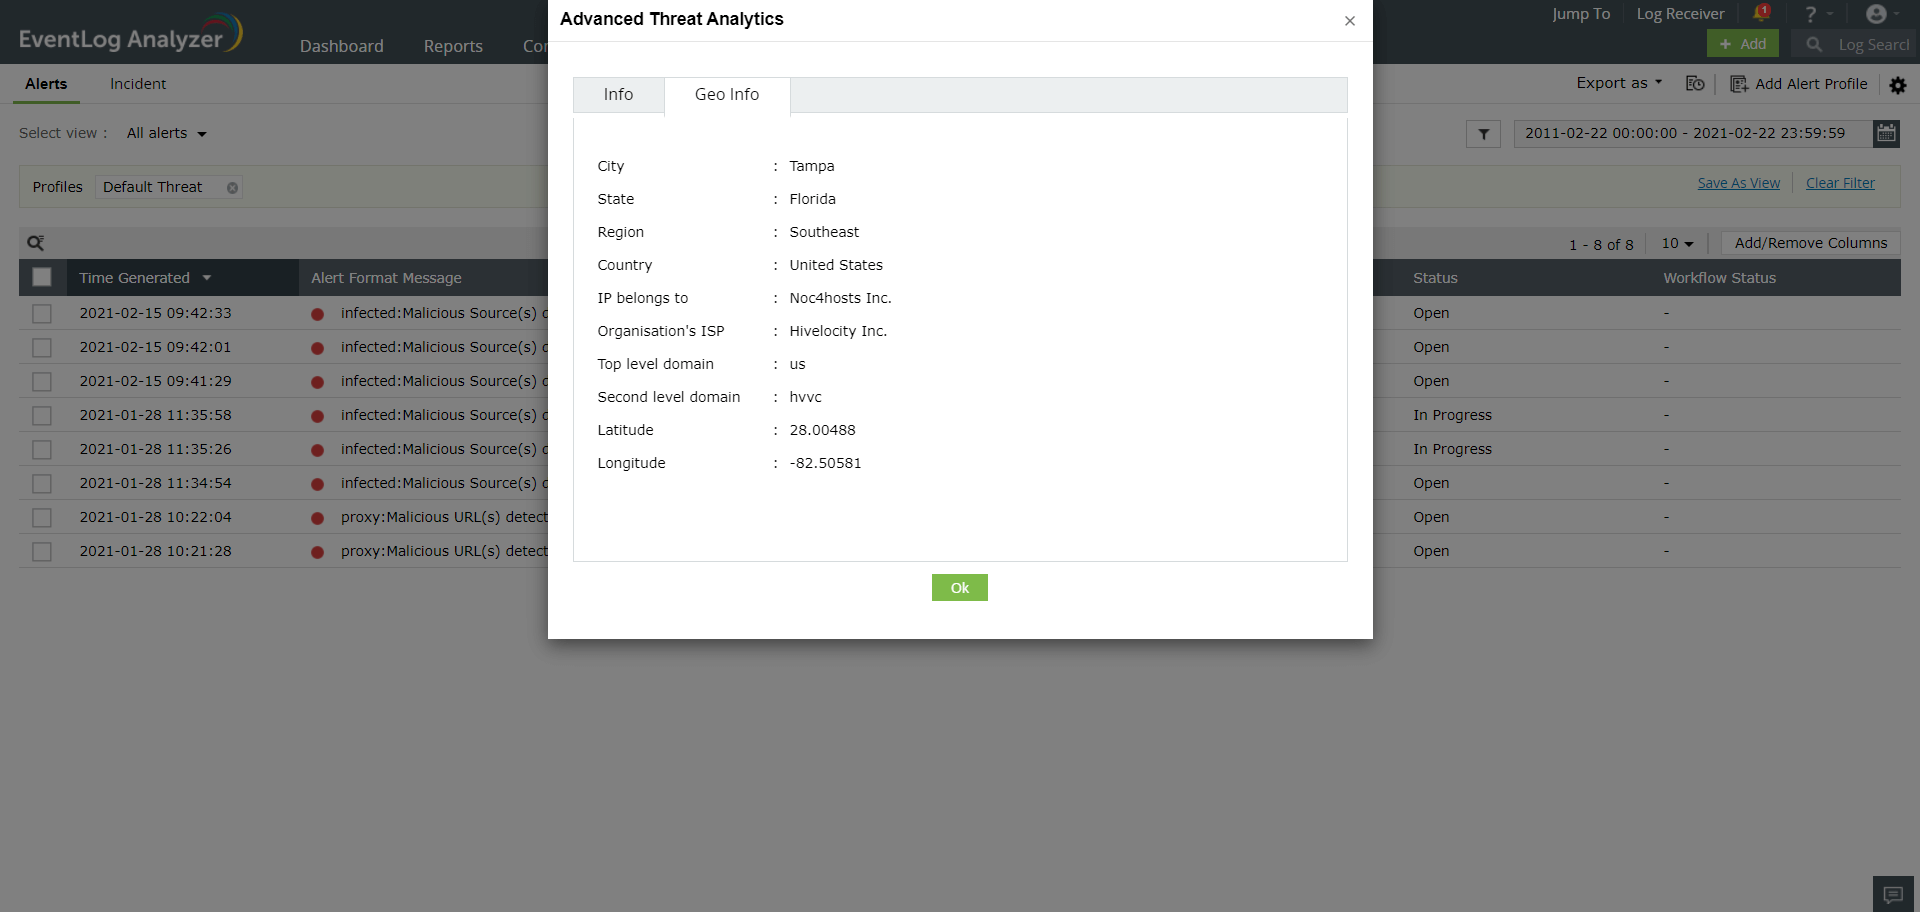
These alerts are raised when malicious domains, URLs, and IPs intrude into your network. Clicking on this alert will give you a reputation score, the number of times it had appeared on a threat list and more.
Copyright © 2020, ZOHO Corp. All Rights Reserved.