WatchGuard reports
EventLog Analyzer supports WatchGuard Firewall and provides out-of-box reports for the following categories of events:
- WatchGuard Events: The reports in this category provides Information on all events on WatchGuard devices.
- Firewall Allowed and Denied Traffic: The reports in these categories provide information on traffic based on source, destination, protocol and port. It also, provides information on traffic trends.
- Firewall Website Traffic: This category has traffic reports based on source, destination, and website traffic trend reports.
- Successful and Failed Logons: The reports in these categories provide information on successful and failed logins based on source and user. It also provides insights on logon trends.
- Firewall Accounts Management: The reports in this category provides information on added, deleted, or modified firewall administrator accounts.
- Firewall Policy Management: These reports provide information on added, deleted, or modified firewall policies.
- Firewall IDS/IPS Events: The reports in this category provide information on attacks based on source and destination IP address. It also provides insights on attack trends.
- System Events: These reports provide information on configuration changes, clock updates, system status, start and stop of services, features, and license status.
- Failed VPN Logon Reports: These reports provide information on the VPN activities from WatchGuard logs and offers out-of-the-box reports for failed VPN logons.
- Device Severity Reports: The reports in this category provide information on emergency, alerts, critical, error, warning, and notice events.
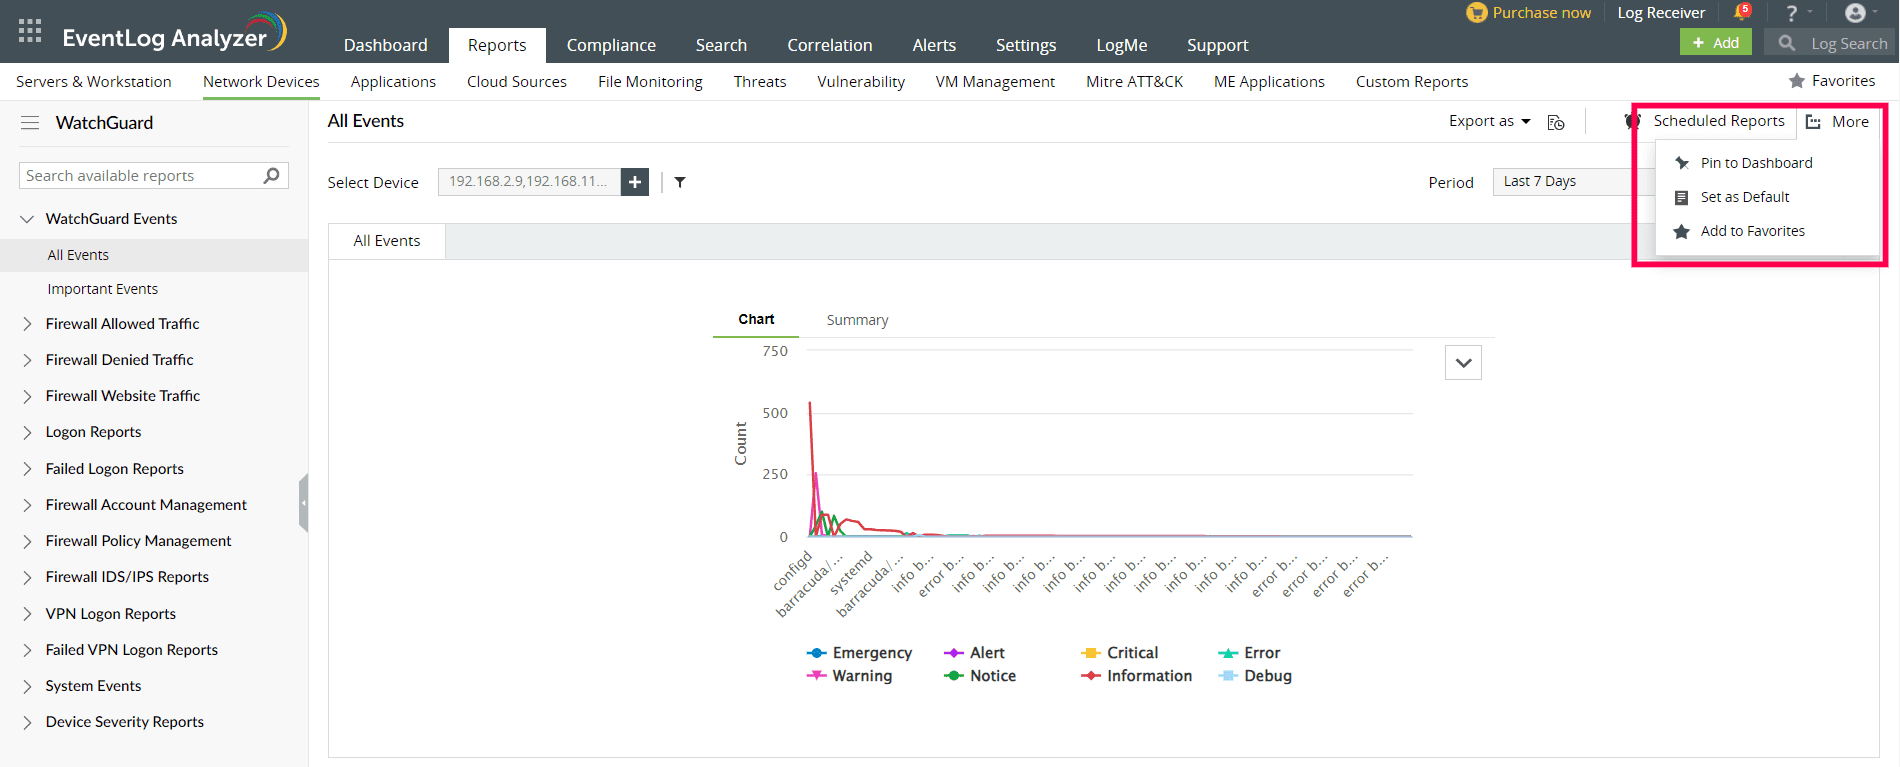
WatchGuard reports dashboard
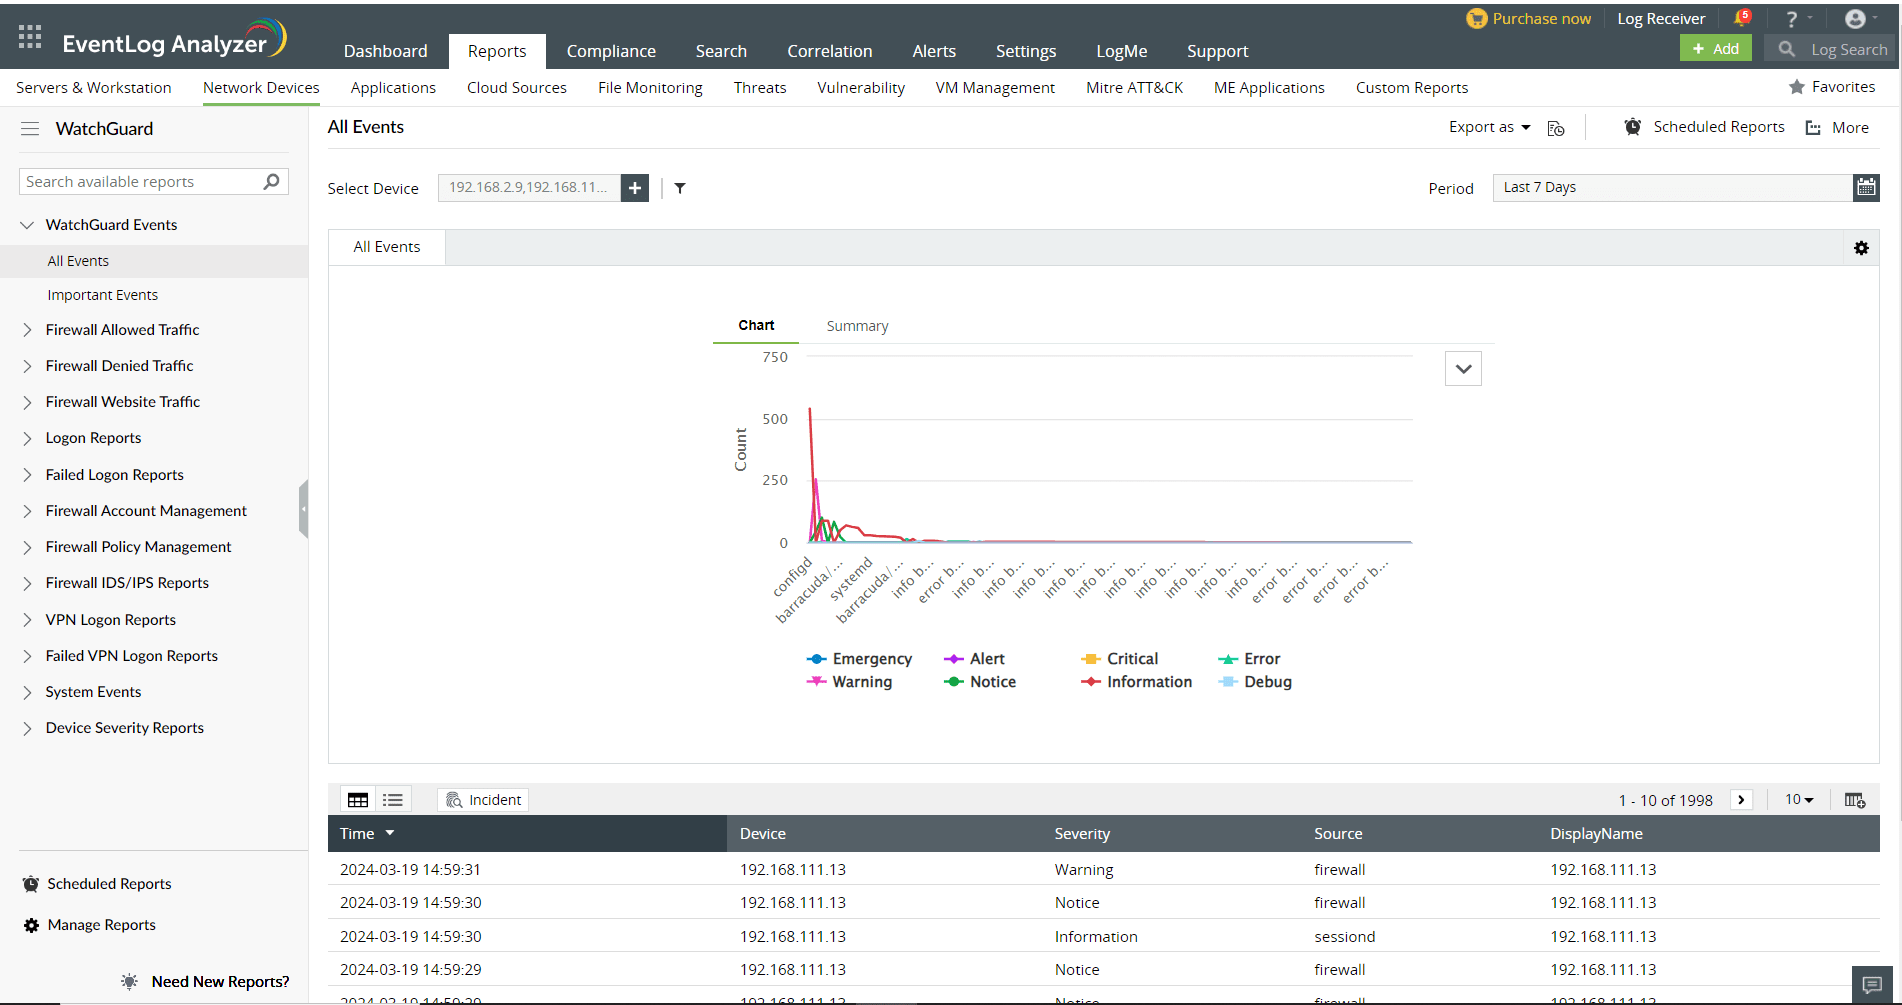
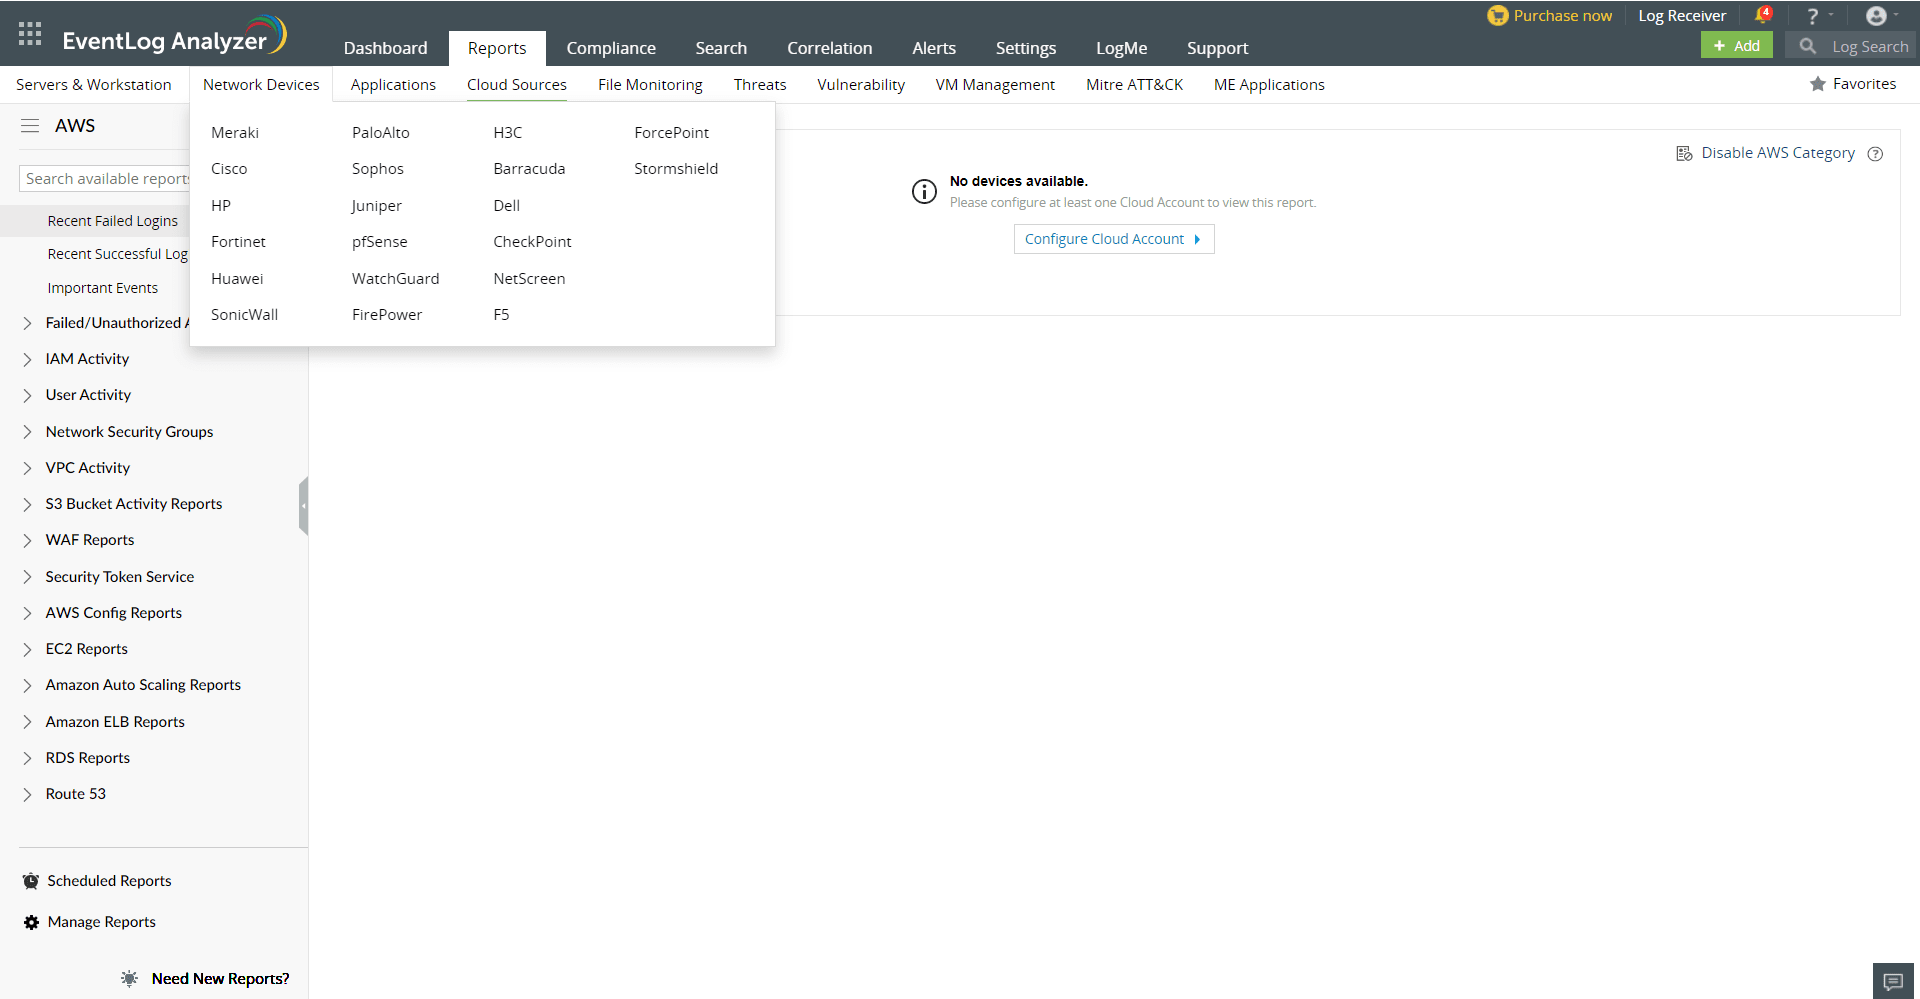
- Go to the Reports section. Navigate to Network Devices and select WatchGaurd from the displayed list of devices.
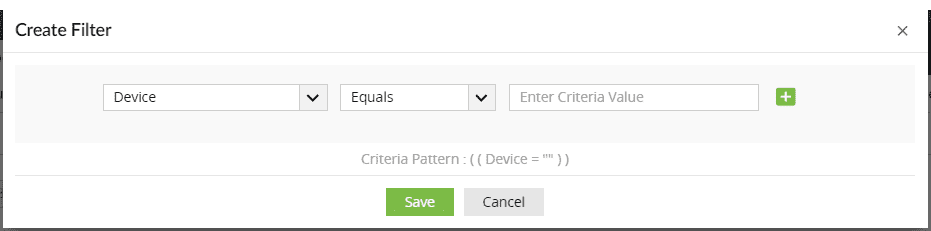
- You can set filter criteria for events based on Source, Severity and Device and Message.
- Use logical operators as required to create the filter criteria.
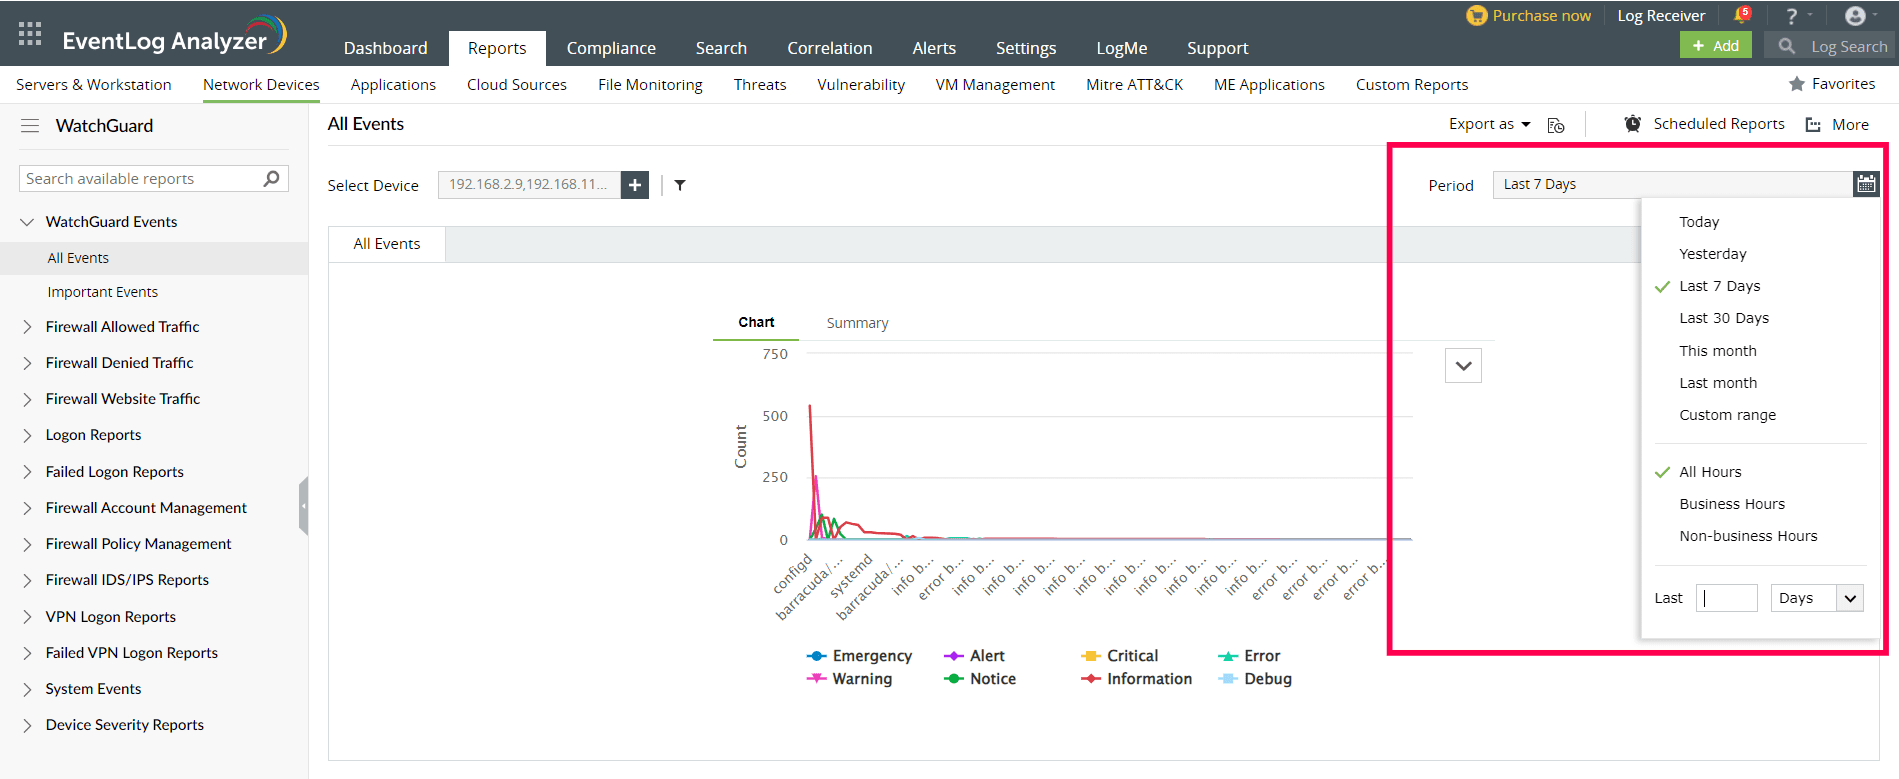
- Select the Period for which you want the data to be displayed and click Apply.
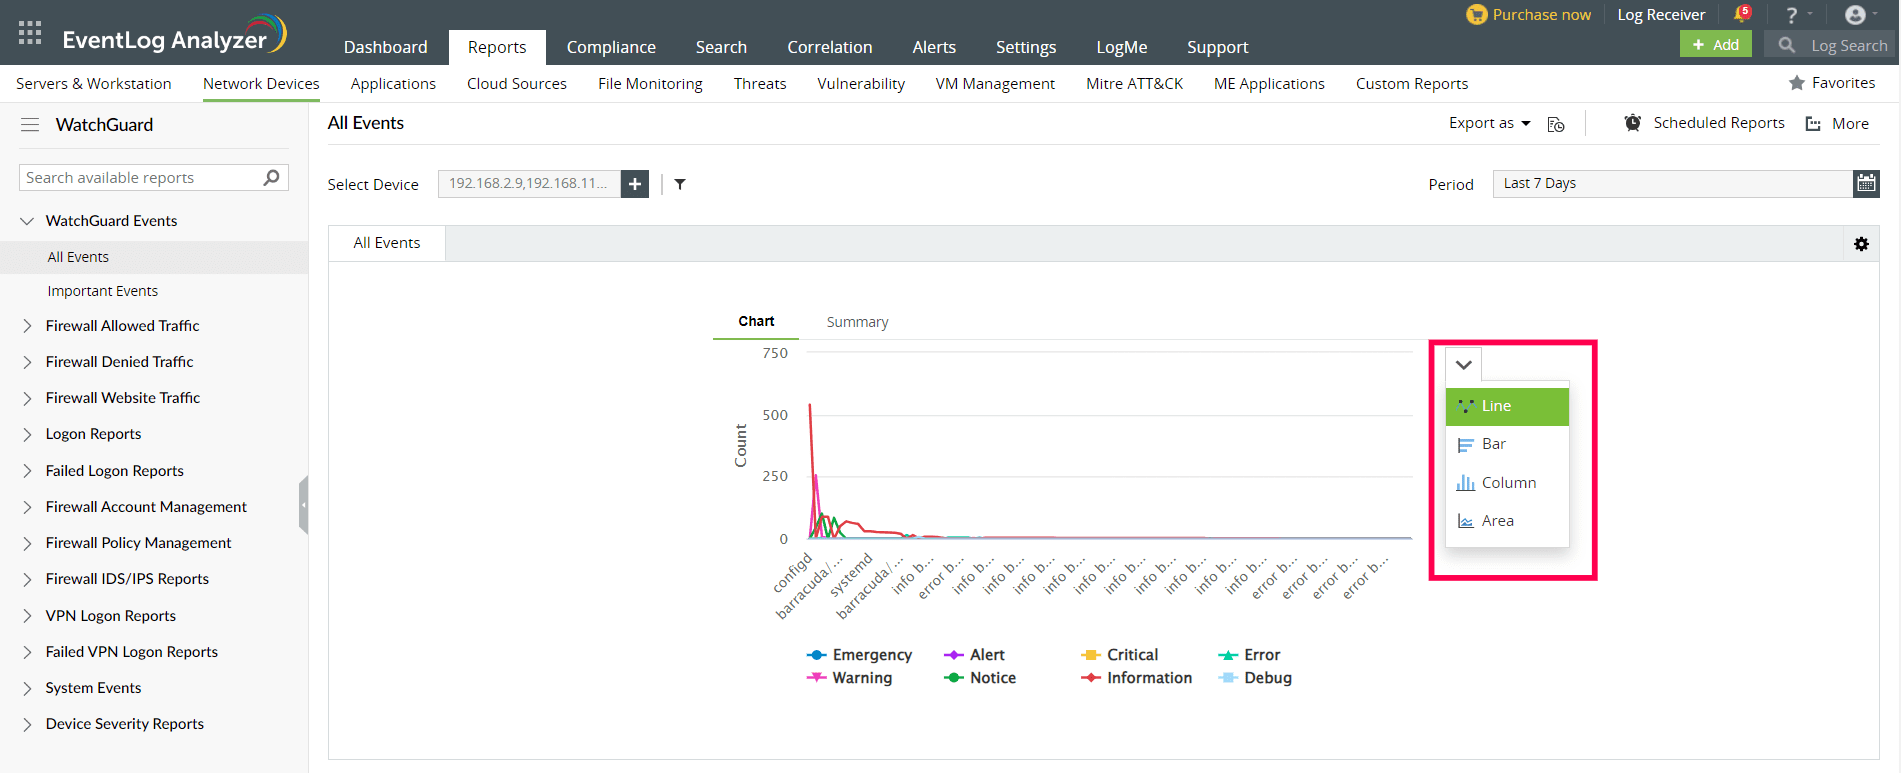
- The graphs can be viewed in different formats.
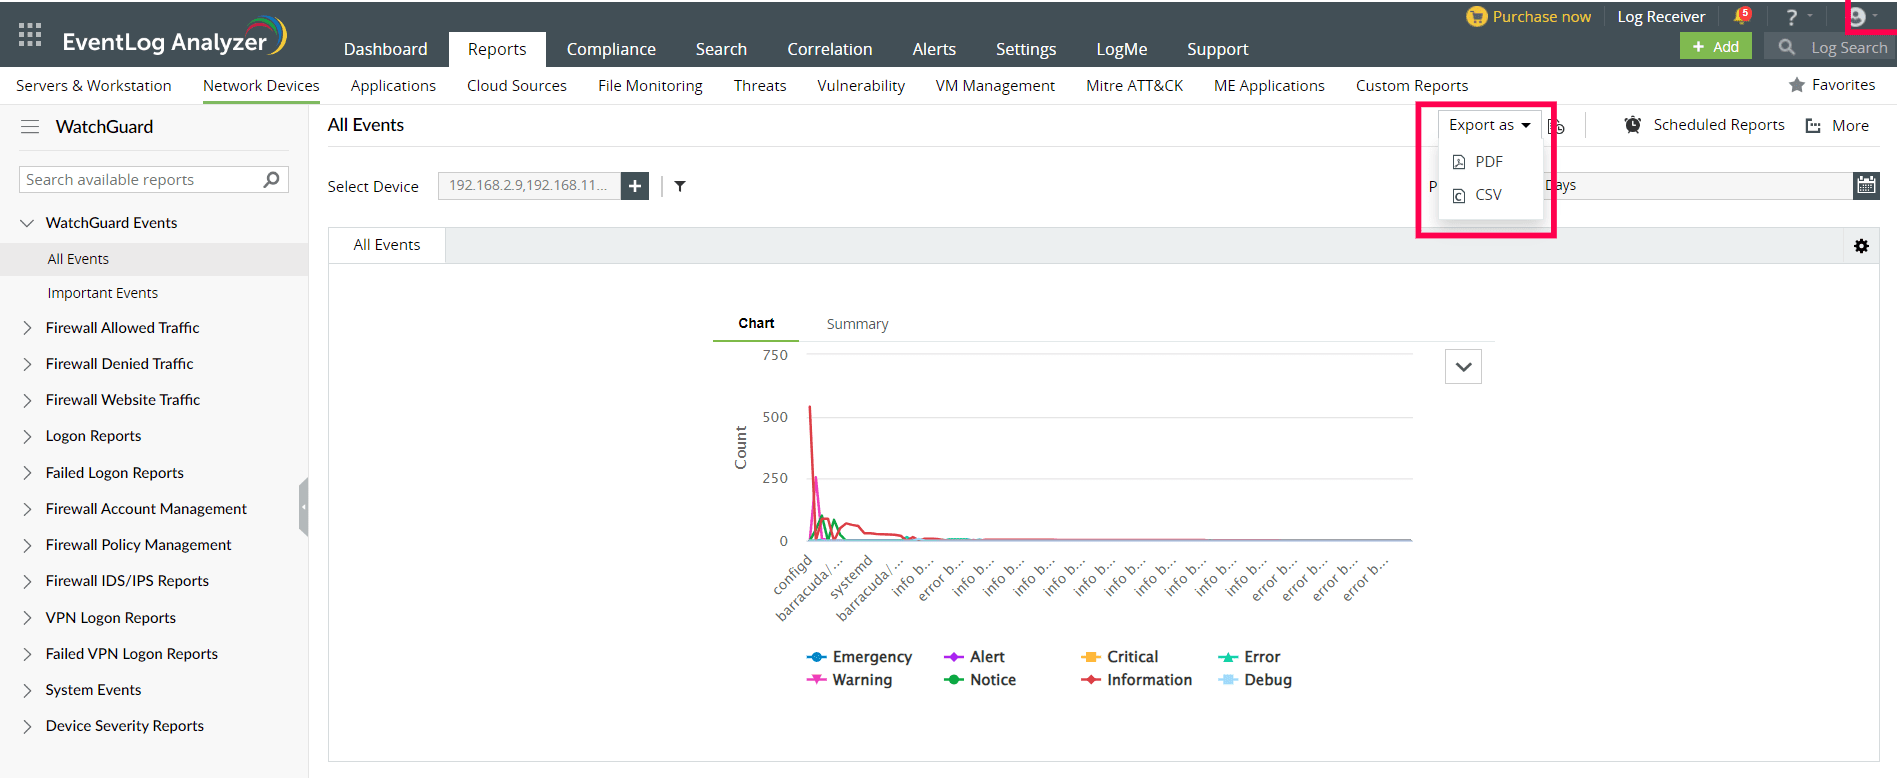
- To quickly export the report in view, click Export as and choose the format. You can then download the report.
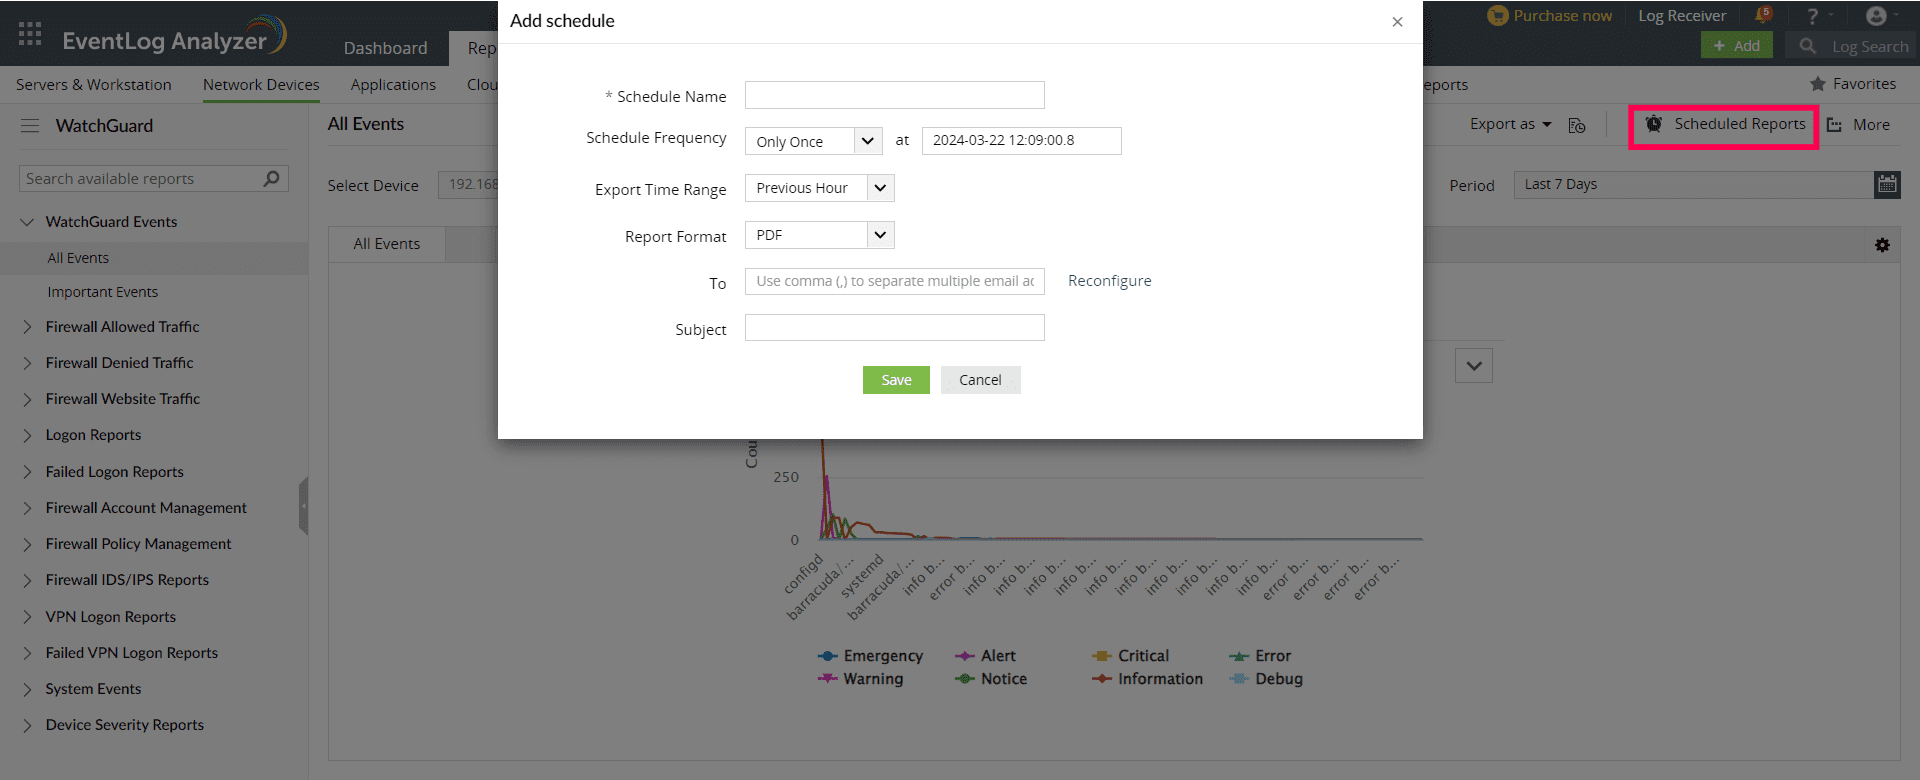
- Click Scheduled Reports to have this report exported and emailed periodically.
- Click More for further customization options.
- Set as Default, to set this report as the default for WatchGuard reports.
- Add to Favorites, to mark this report as favorite.
- Pin to dashboard, to pin this report to the main dashboard in the Home page.
 Click here to expand