F5 reports
EventLog Analyzer audits F5 devices and provides out-of-the-box reports for the following categories of events:
- F5 Events: The reports in this group contains information on all events logged by F5 devices.
- Logon Reports: These reports provide information on successful firewall logons and logoffs, and also gives insights into logon trends.
- Failed Logon Reports: The reports in this category provide information on failed firewall logons and insights into failed logon trends.
- LTM Health Monitoring: The reports in this category let you track recent changes made to monitor status, node status, pool status, pool member status, and virtual server status.
- Connection Monitoring: These reports let you view all CMI events and monitor connection limits.
- Interface Events: The reports in this category let you monitor interface events such as Interface Up, Interface Down, Interface error, and VLAN events.
- Firewall Allowed Traffic: The reports in this category provide information on all connections allowed through the firewall, and firewall trends.
- Firewall Denied Traffic: These reports provide information on all denied connections and insights on trends in firewall traffic.
- Firewall Policy Changes: These reports let you track all policy changes.
- Firewall IDS/IPS Reports: The reports in this category let you monitor attacks and attack trends.
- System Events: The reports in this category provide information on configuration changes and errors, reports on license, policy, and memory status. Monitor status of hardware such as chassis module, temperature, fan, and sensor. Reports on hardware errors.
- Application Security Reports: These reports provide an overview of application security, information on requests allowed and blocked, and trends reports.
- Device Severity Reports: These reports provide information on emergency, alert, critical and error events.
F5 reports dashboard
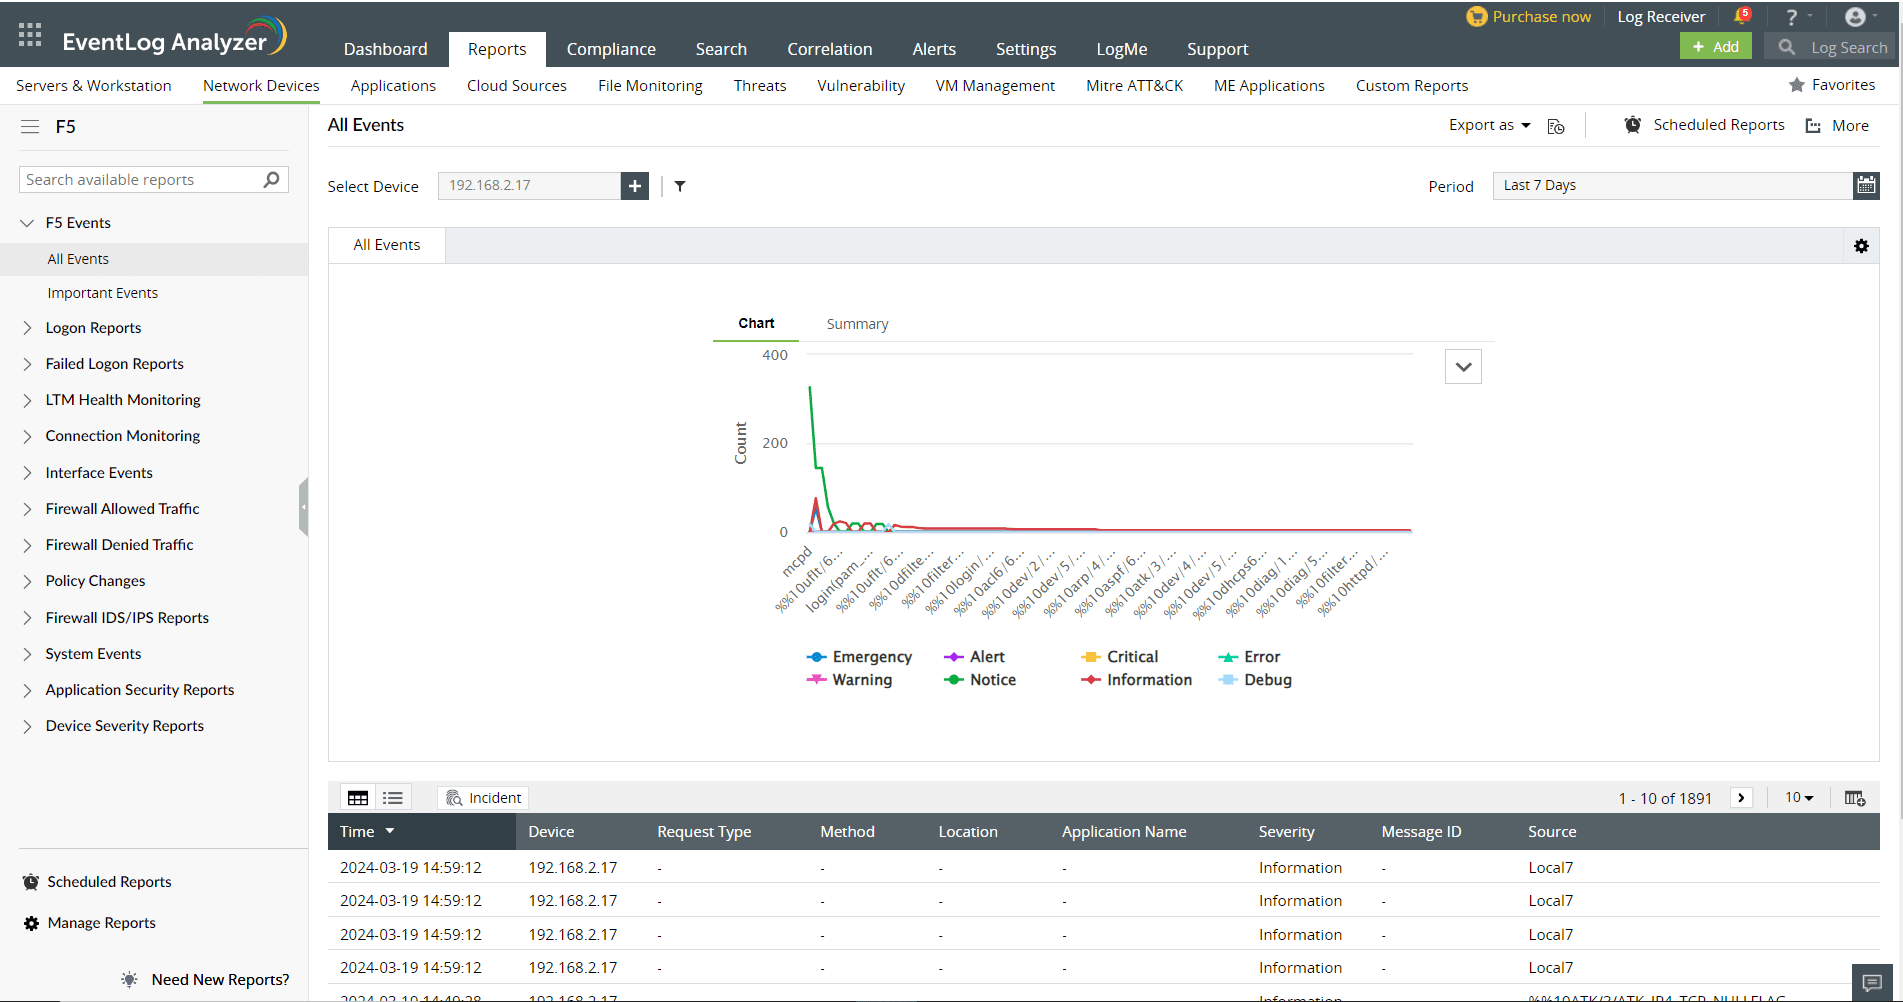
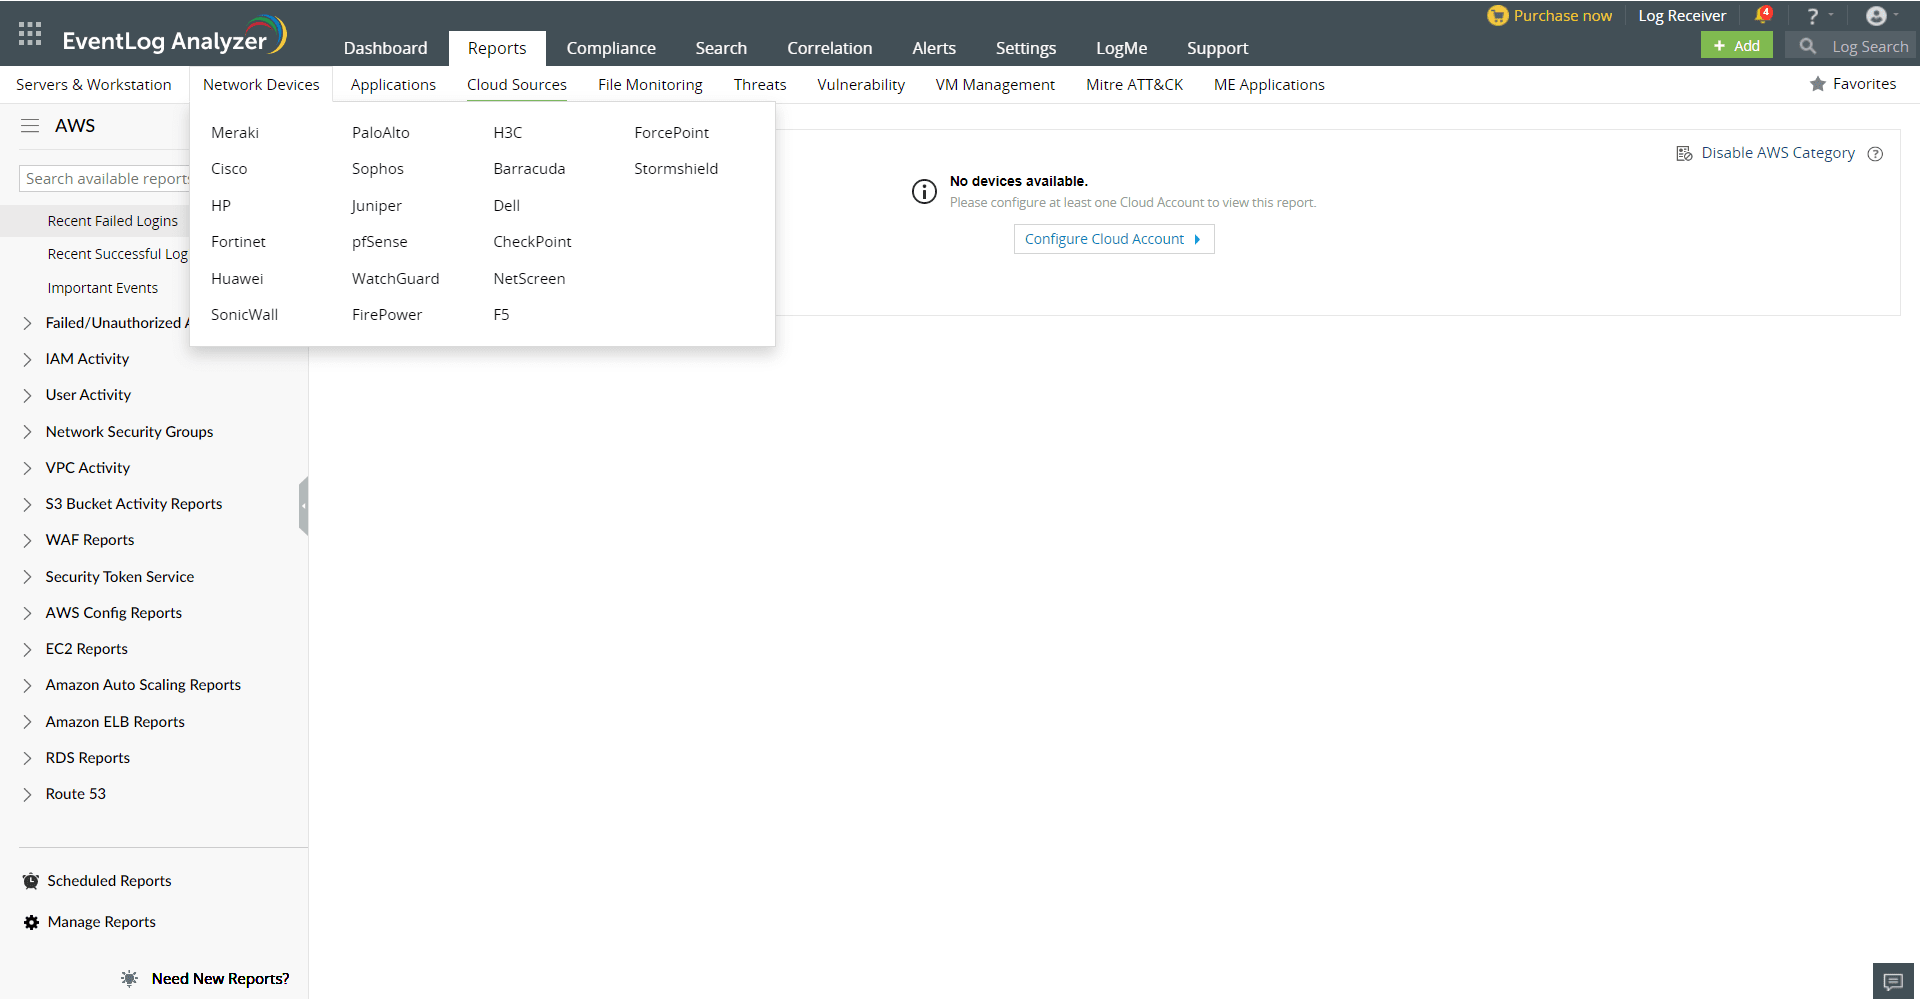
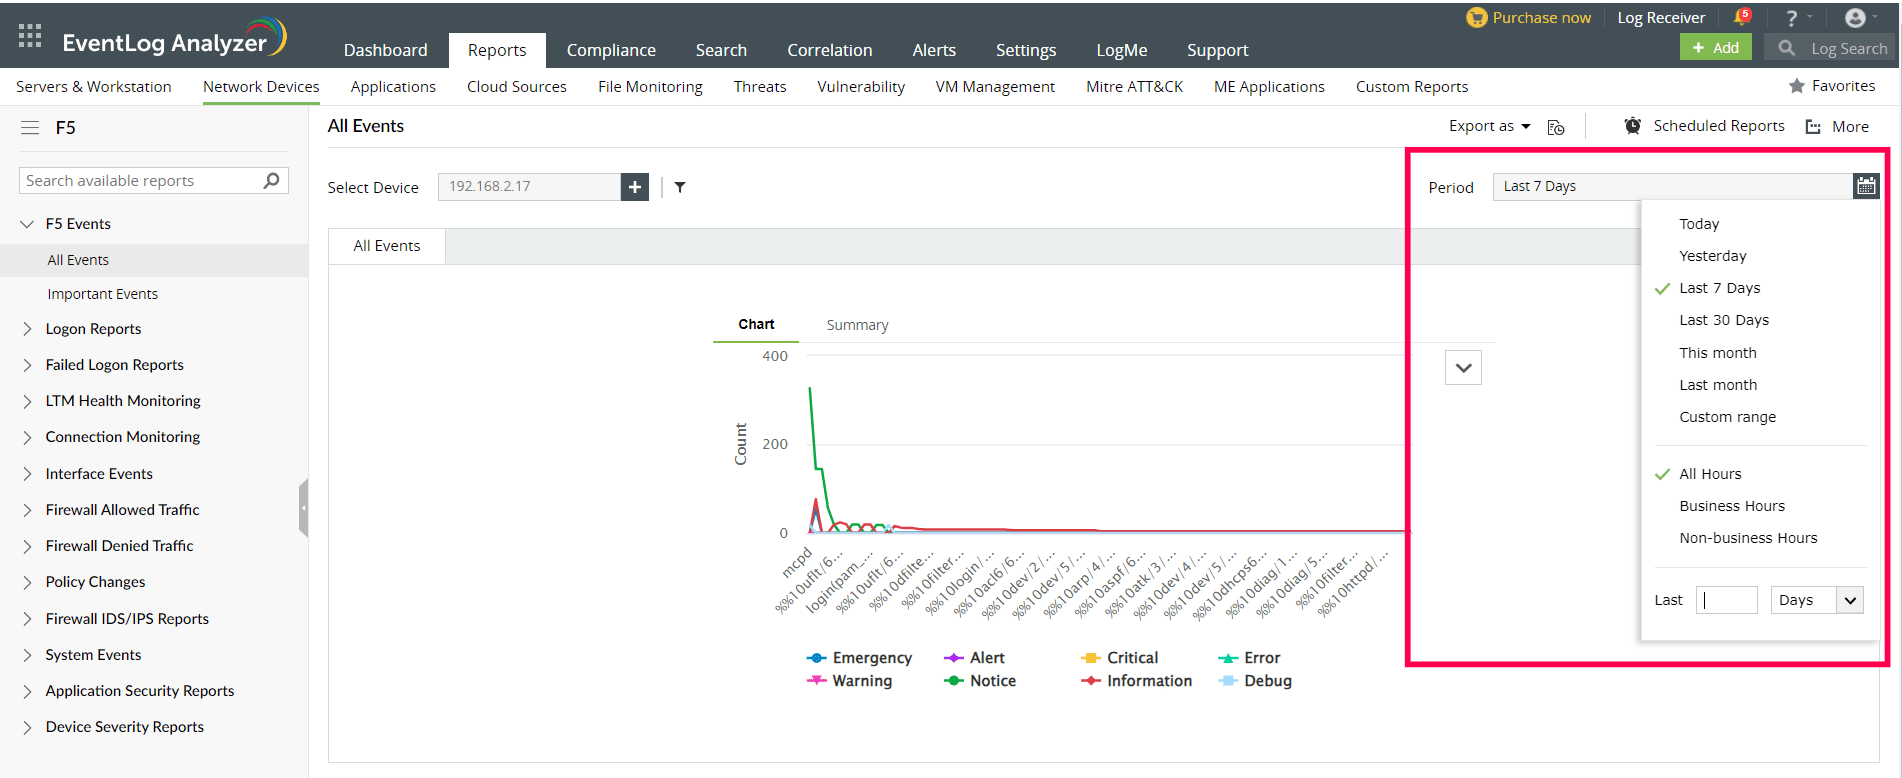
- Go to the Reports section. Navigate to Network Devices and select F5 from the displayed list of devices.
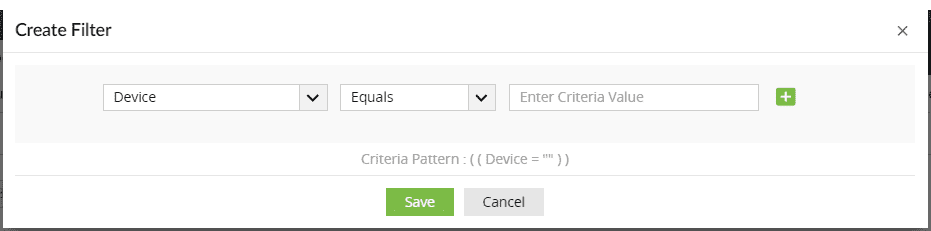
- You can set filter criteria for events based on Source, Severity and Device and Message.
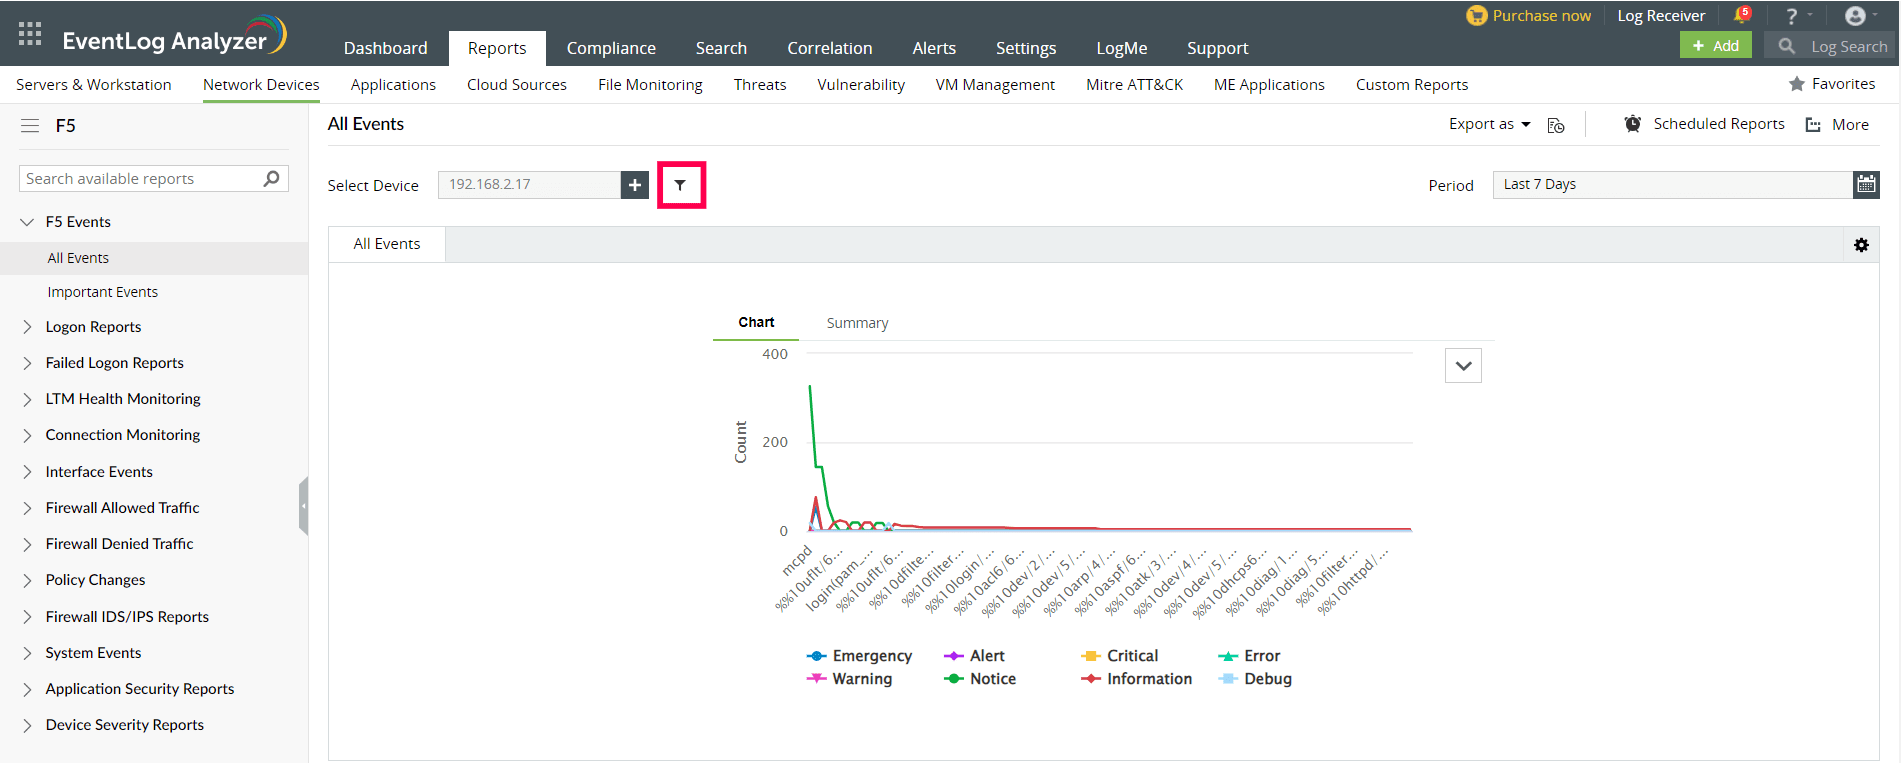
- Use logical operators as required to create the filter criteria.
- Select the Period for which you want the data to be displayed and click Apply.
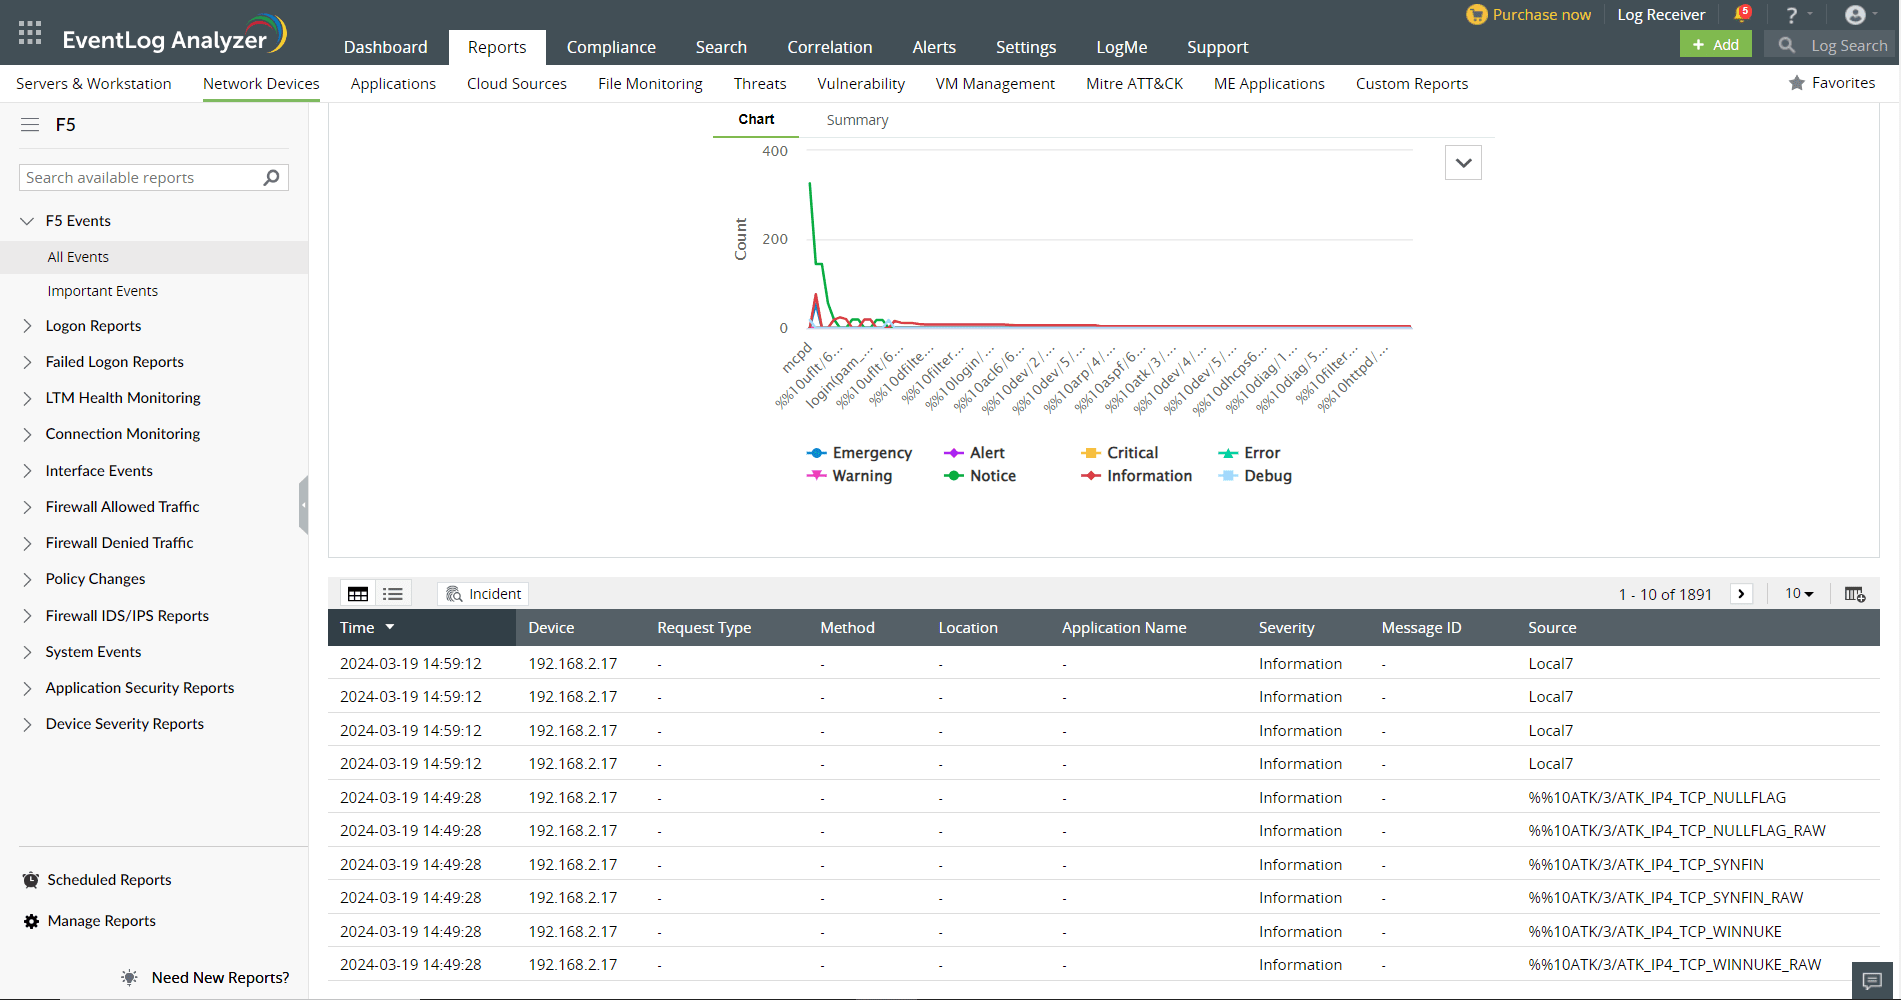
- The panel on left lists all the available out-of-the-box reports for F5. Select the report you want to view.
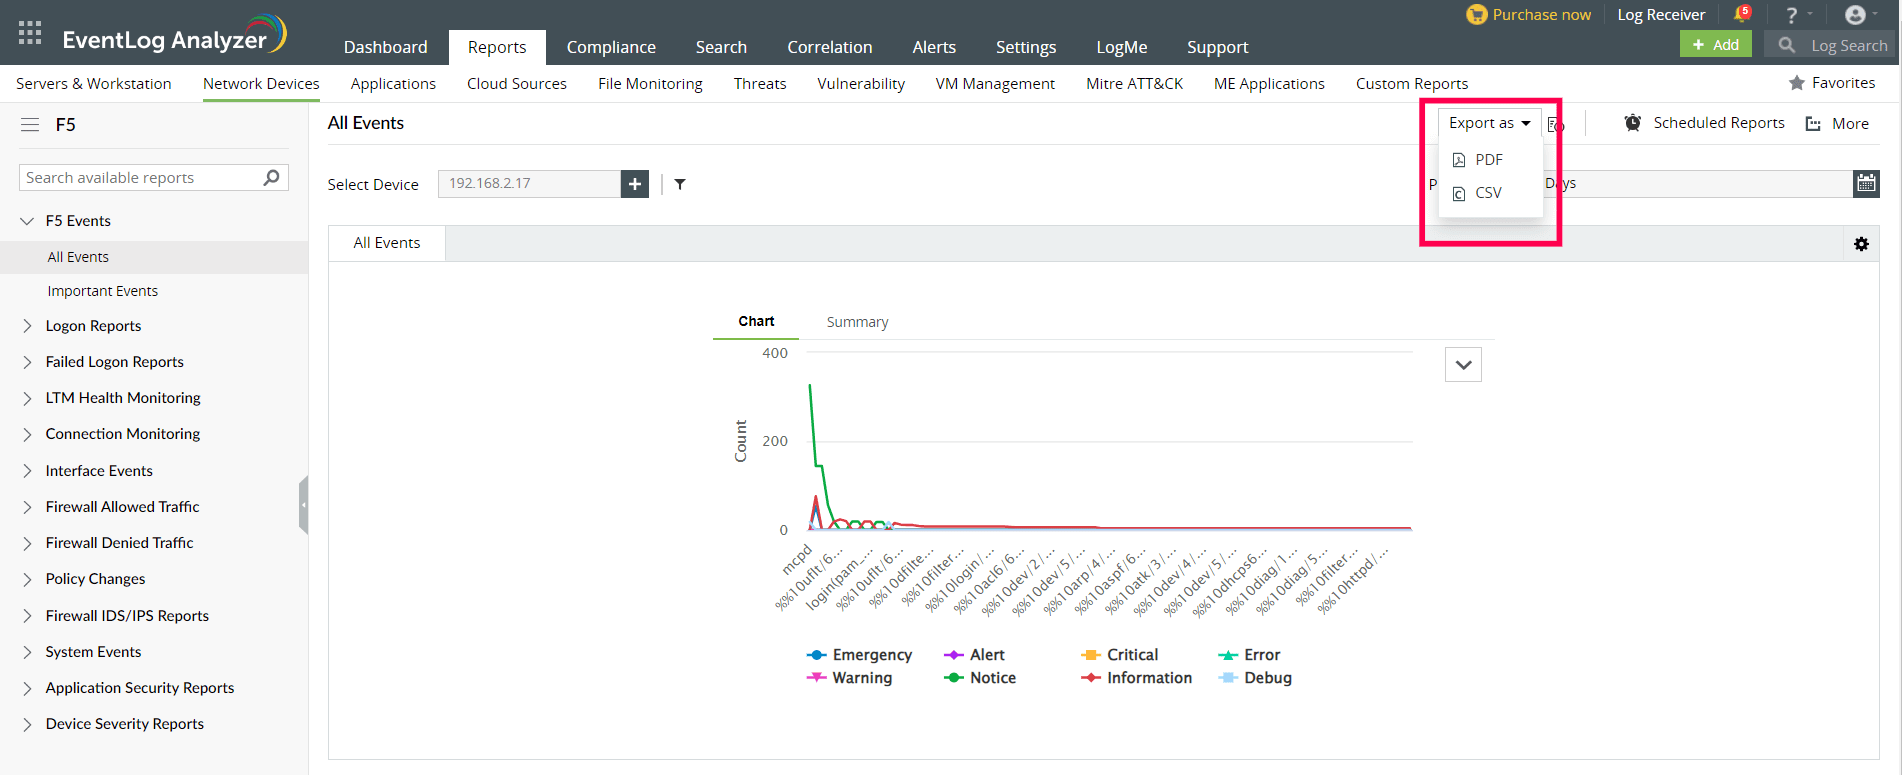
- To quickly export the report in view, click Export as and choose the format. You can then download the report.
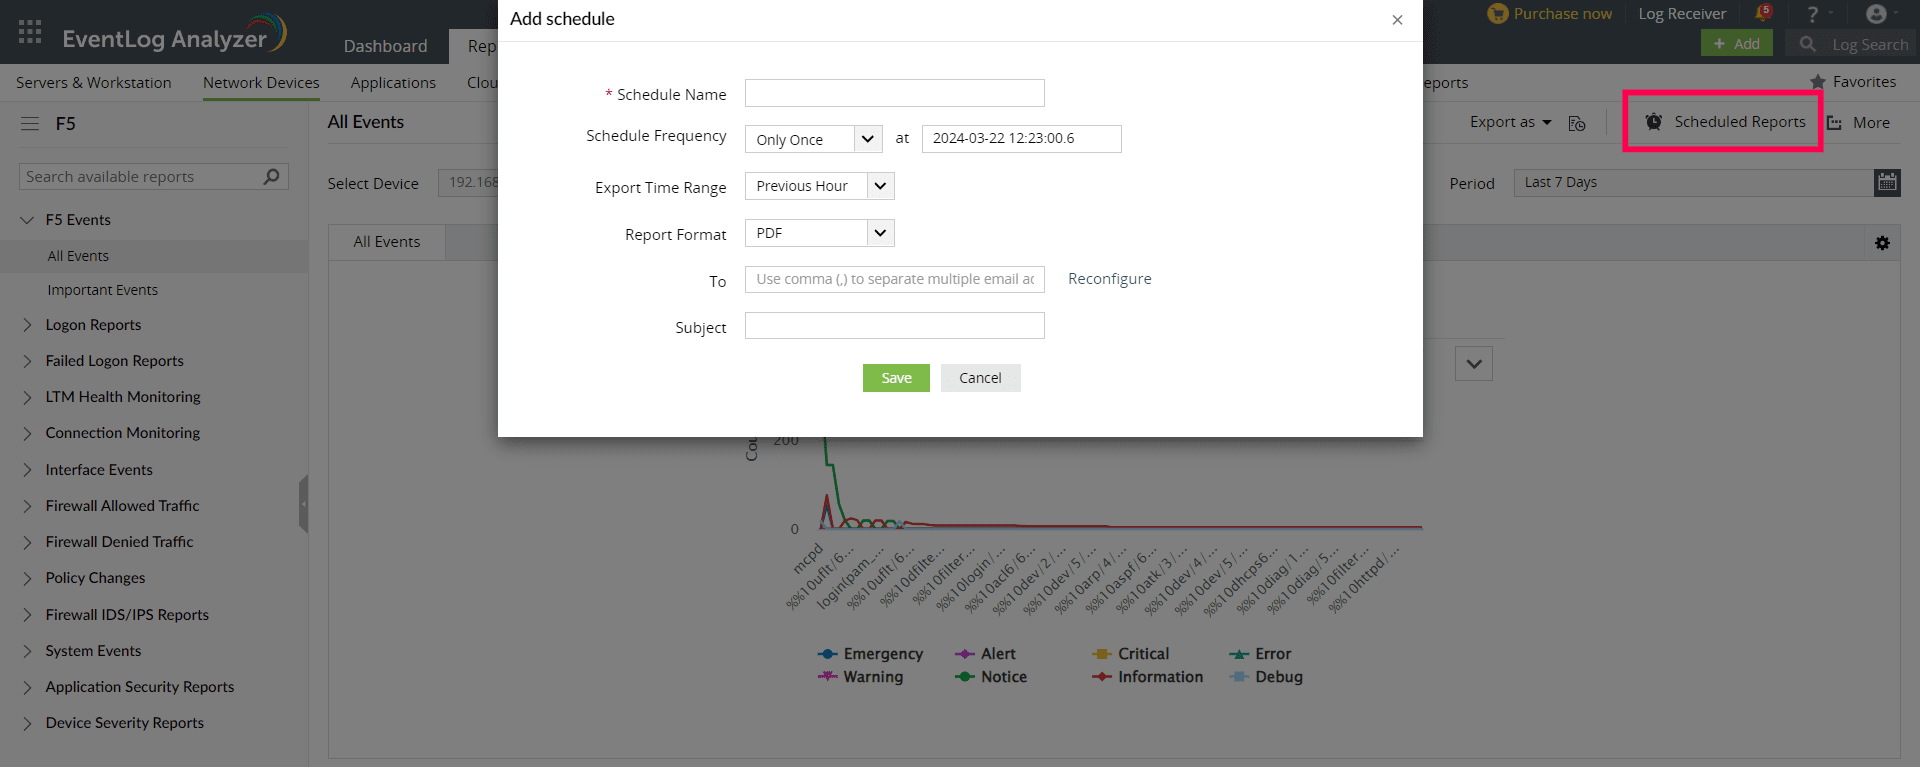
- Click Scheduled Reports to have this report exported and emailed periodically.
- Click More for further customization options.
- Set as Default, to set this report as the default for WatchGuard reports.
- Add to Favorites, to mark this report as favorite.
- Pin to dashboard, to pin this report to the main dashboard in the Home page.
 Click here to expand