Reports for Juniper Devices
EventLog Analyzer supports Juniper Firewall and provides out-of-the-box reports for the following categories of events:
- Juniper Events: These reports provide valuable information on all events including important events such as logons, failed logons, possible attacks, configuration errors, interface up/down, etc., for Juniper devices.
- Successful and Failed Logons: These reports provide insights on source and user-based reports, trends reports. They also provide information on firewall, web, and CLI logons.
- Configuration Reports: The reports in this category provide information on interface settings, commands executed, and configuration errors.
- Firewall Allowed and Denied Traffic: This category of reports provides valuable insights on traffic based on the source, destination, protocol and port, and traffic trends.
- Firewall IDS/IPS Events: These reports provide insights on possible, critical, top attacks; attacks based on source, destination IP address, and severity; and attack trends.
- Application Tracking Reports: The reports in this category provide useful information on applications accessed based on username and reports on applications started and stopped.
- System Events: These reports provide information on process and fan status, and system reboots.
- Device Severity Reports: The reports in this category provide insights on emergency, alerts, critical, error, warning, notice, information, and debug events.
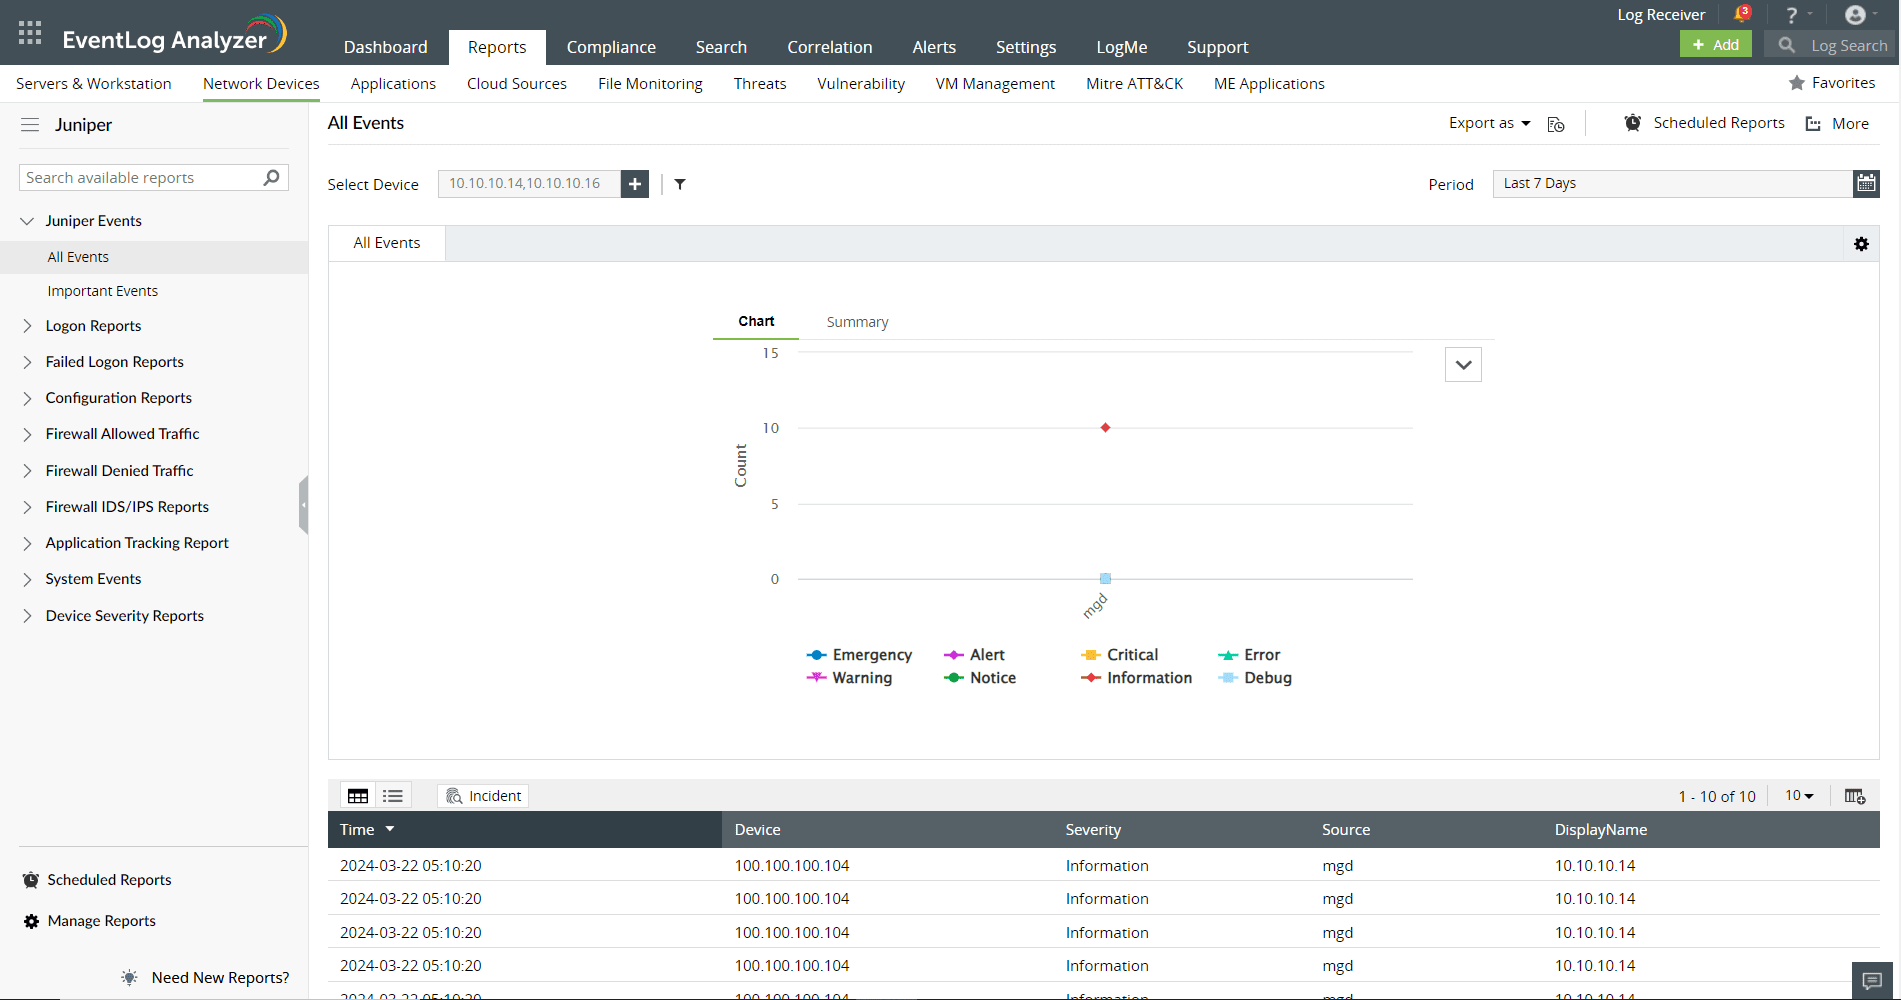
Managing Juniper reports dashboard
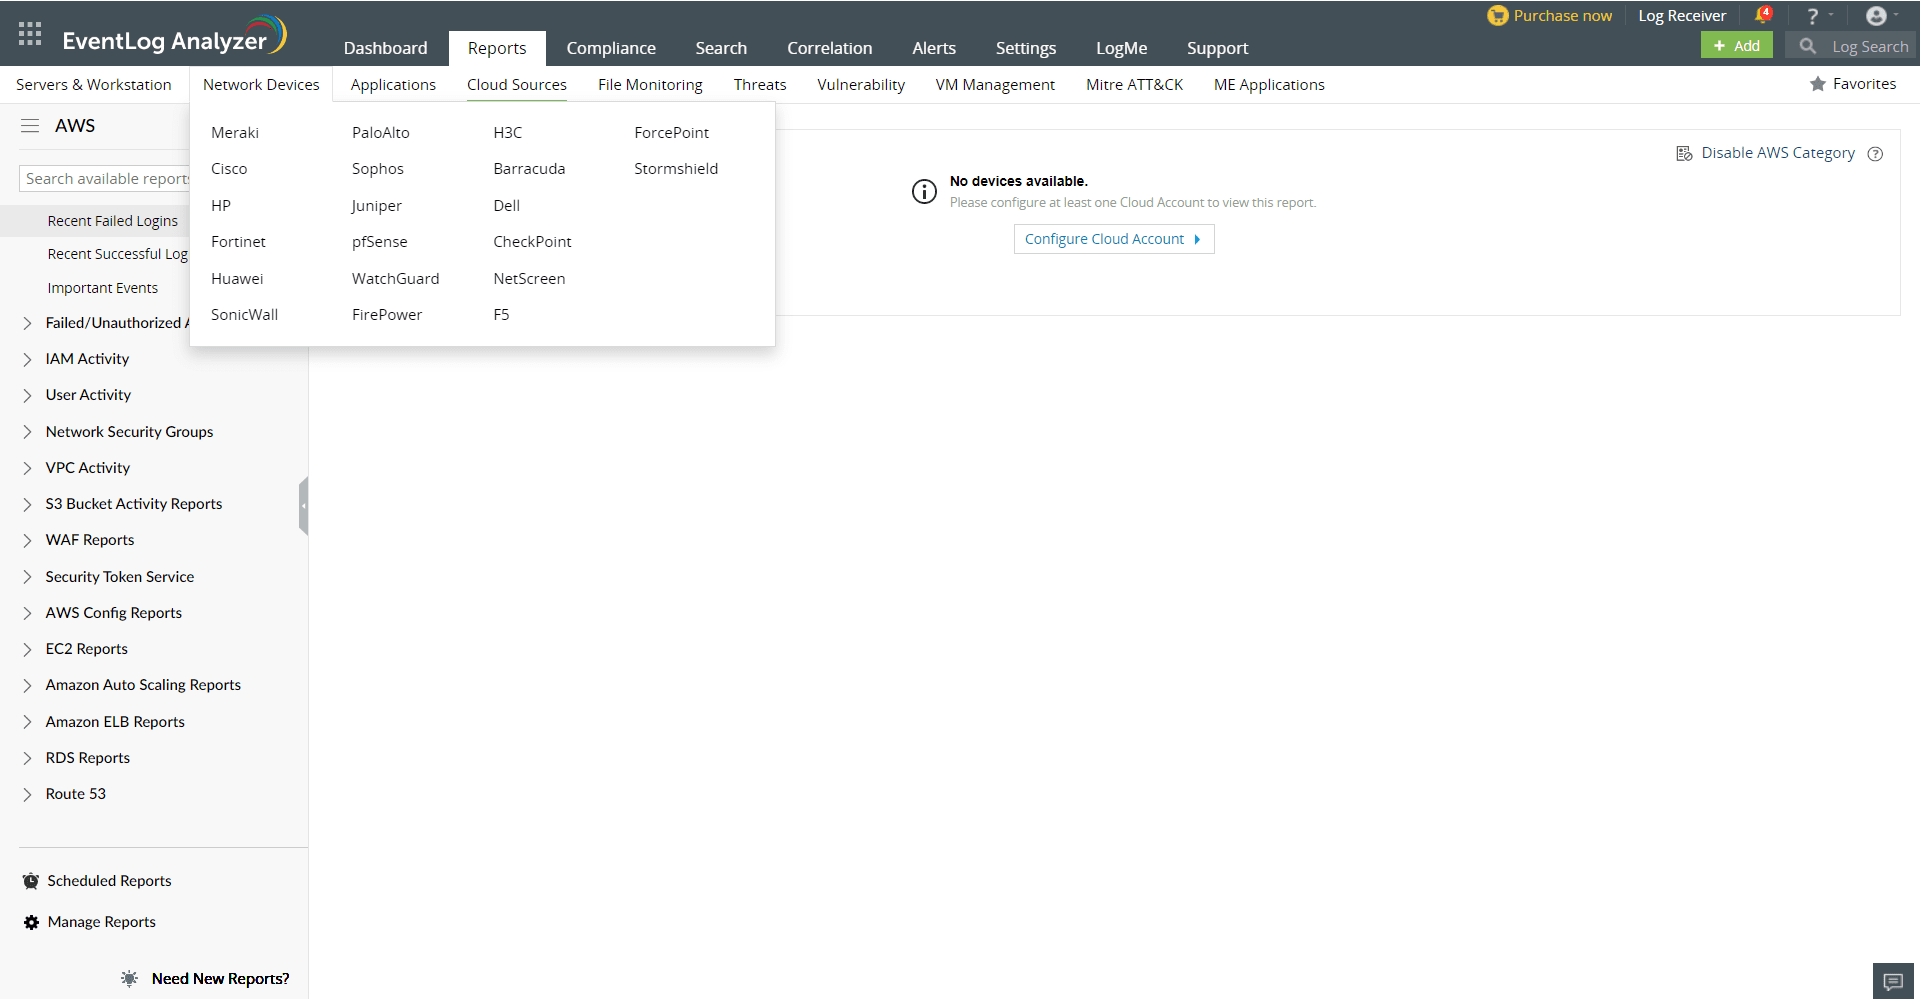
- Go to the Reports section. Navigate to Network Devices and select FirePower from the displayed list of devices.
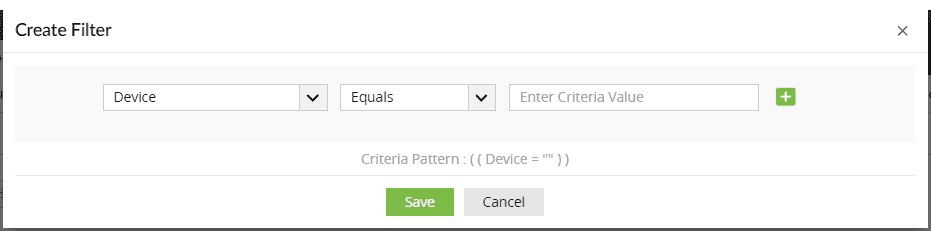
- You can set filter criteria for events based on Source, Severity, Device, and Message.
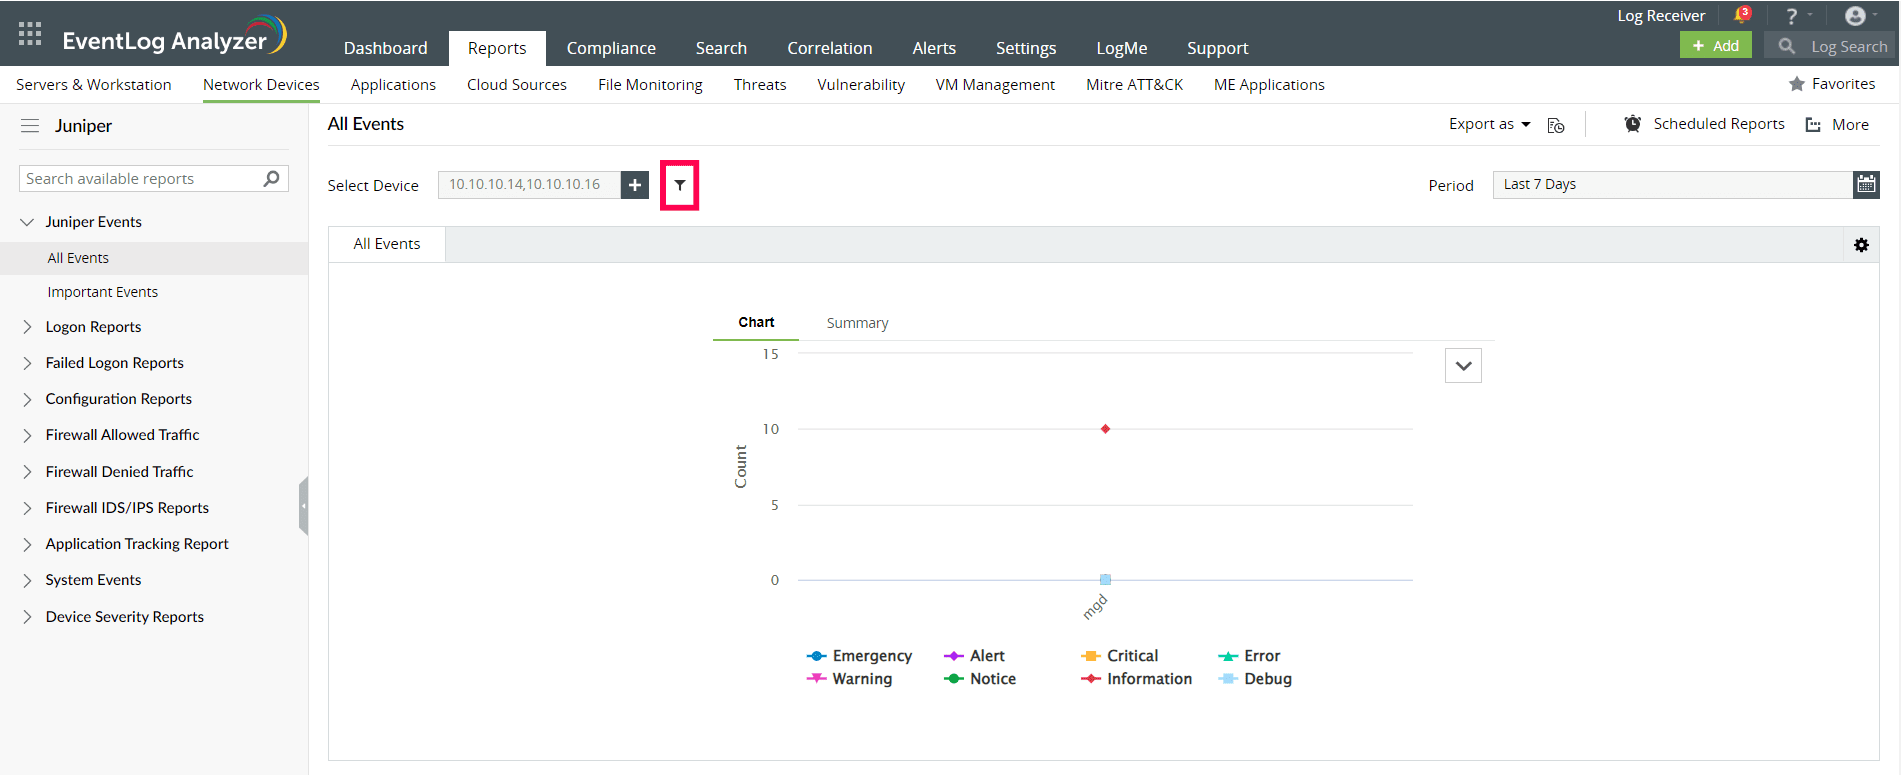
- Use logical operators as required to create the filter criteria.
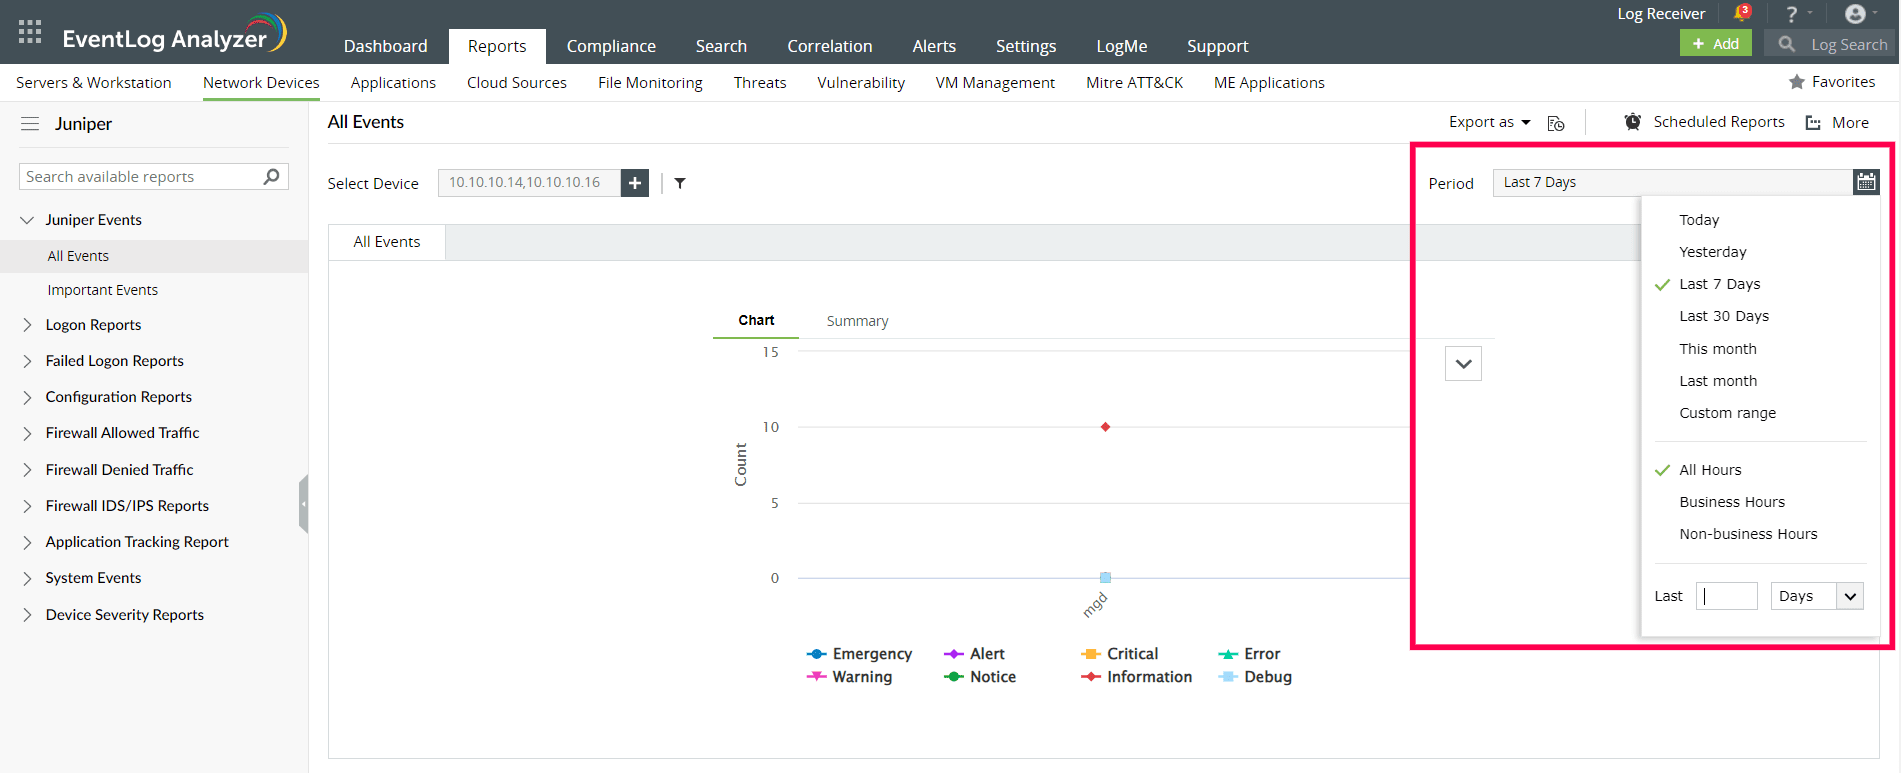
- Select the Period for which you want the data to be displayed and click Apply.
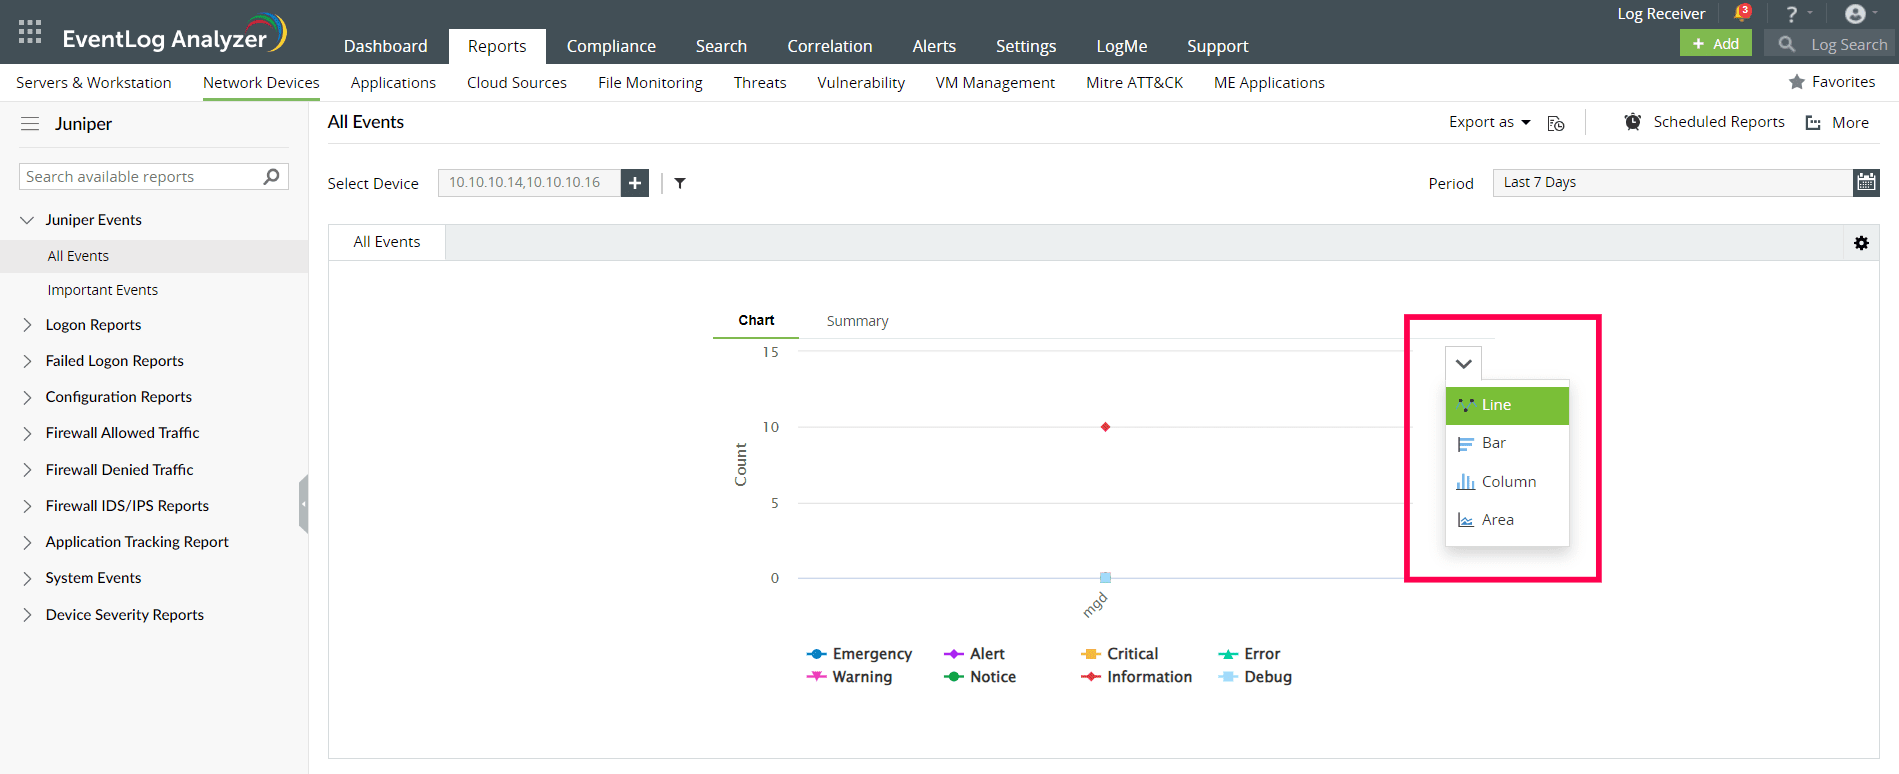
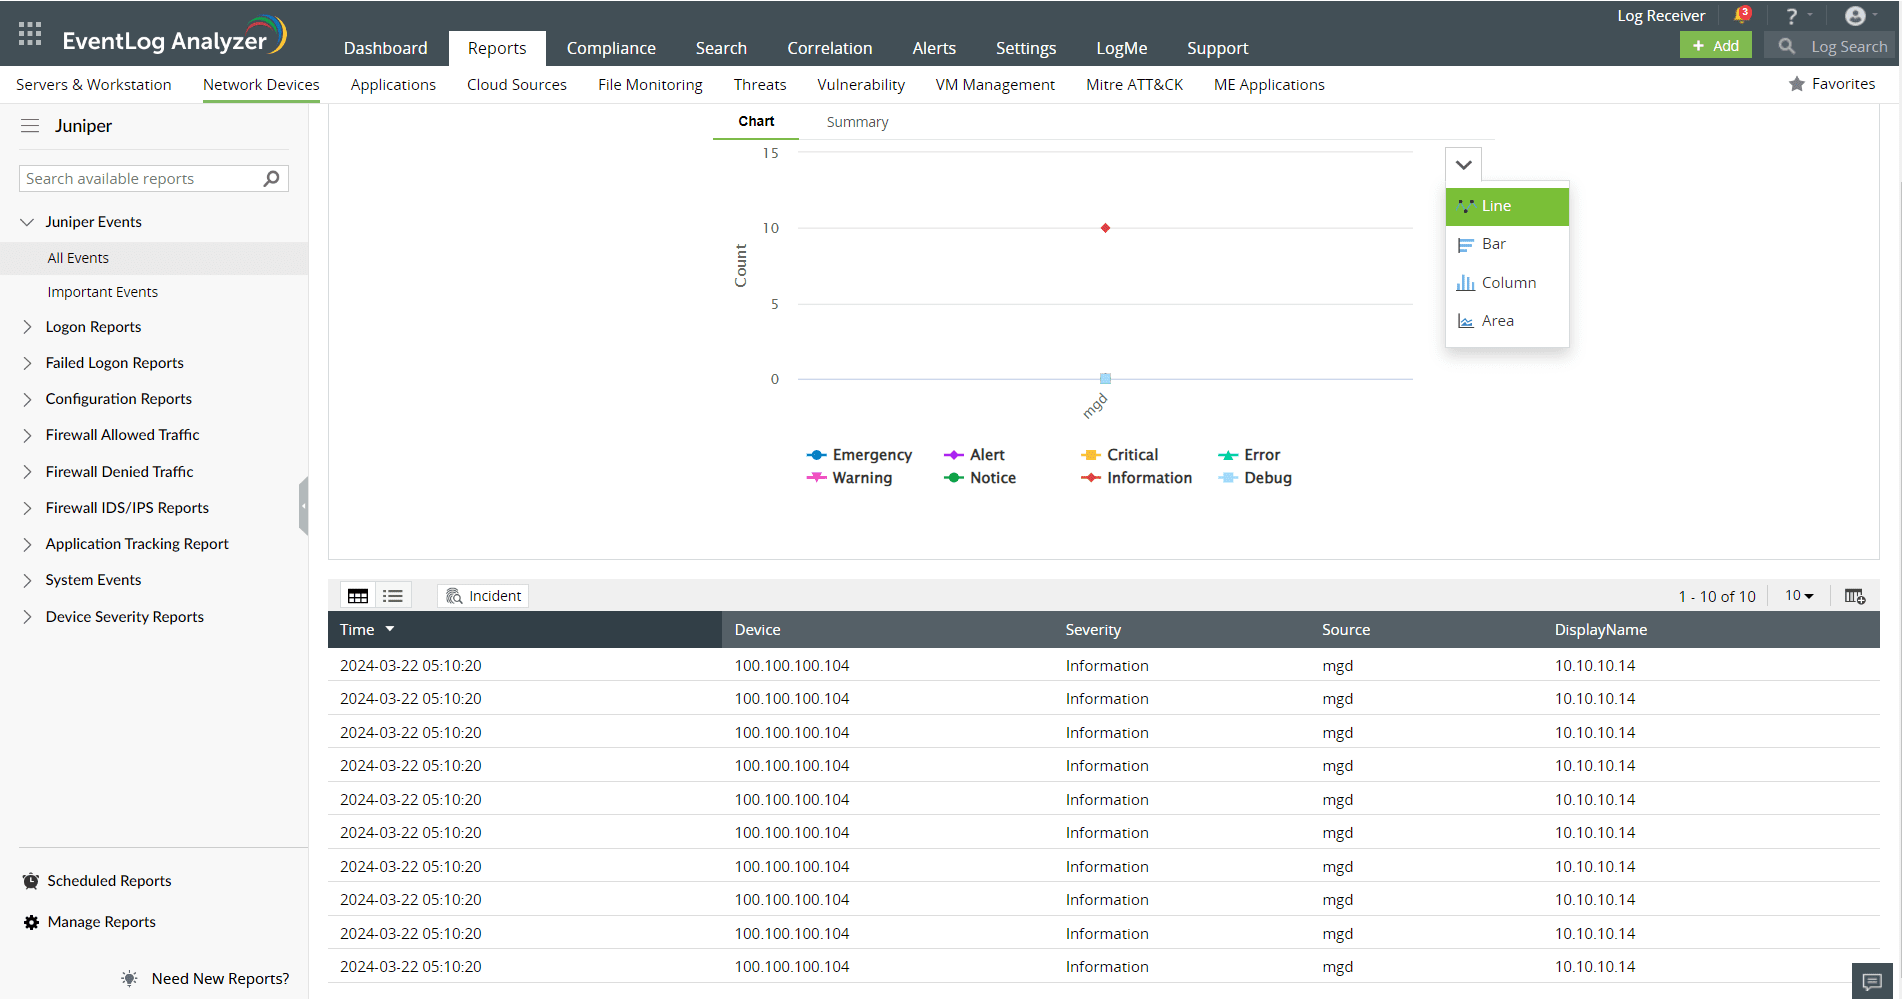
- The graphs can be viewed in different formats.
- The left panel lists all the available out-of-the-box reports for Juniper. Select the report you want to view.
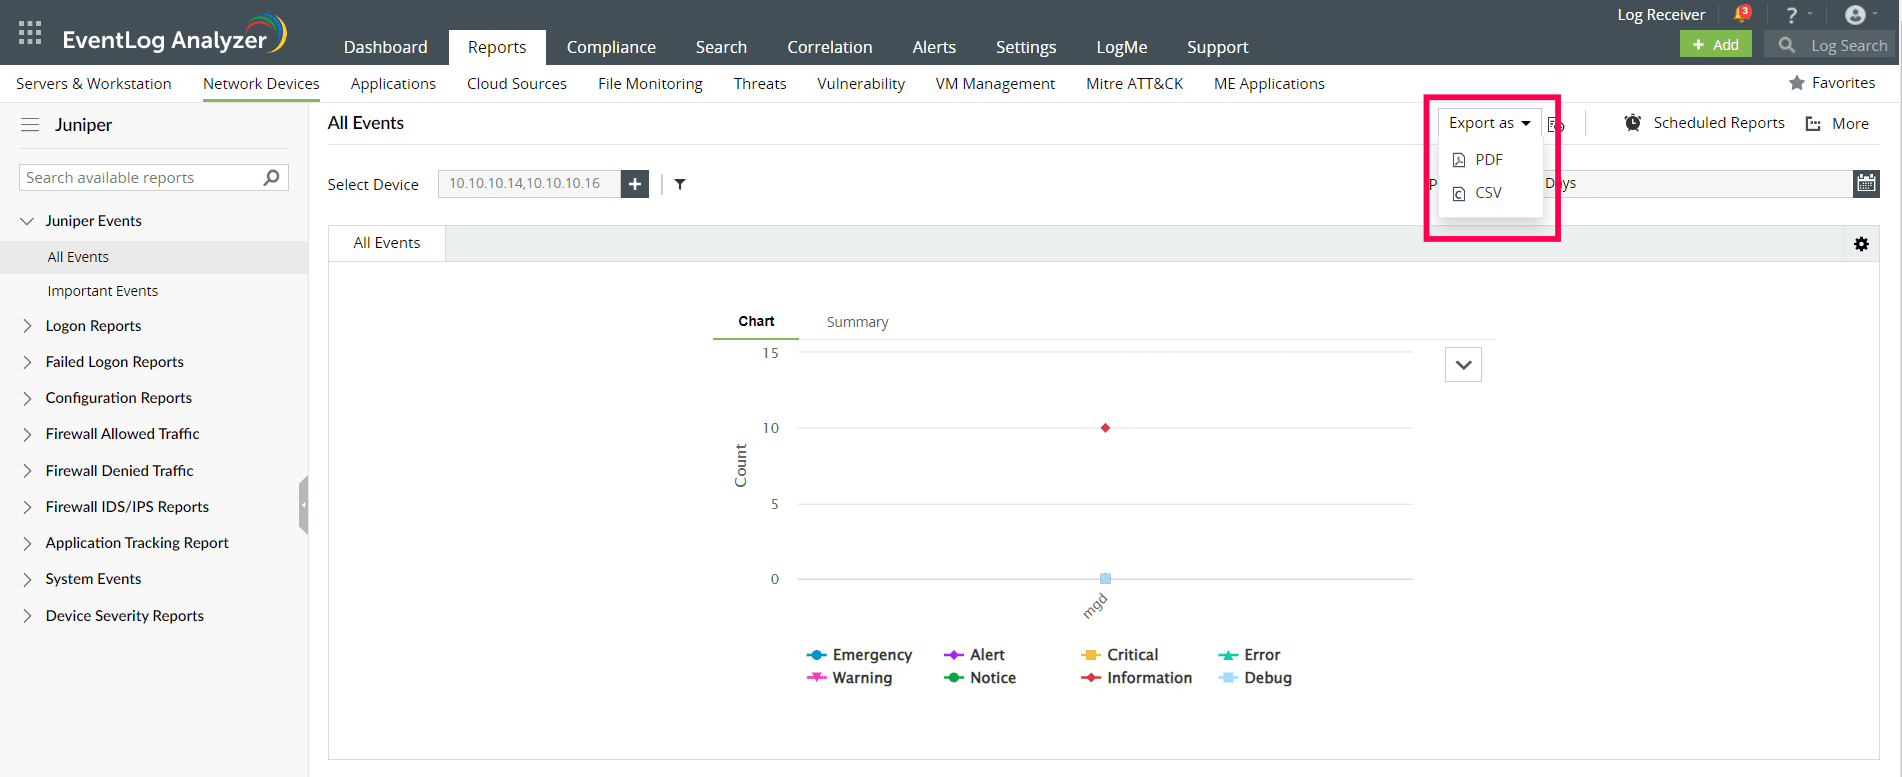
- To quickly export the report being viewed, click Export as and choose the format. Once done, you can download the report.
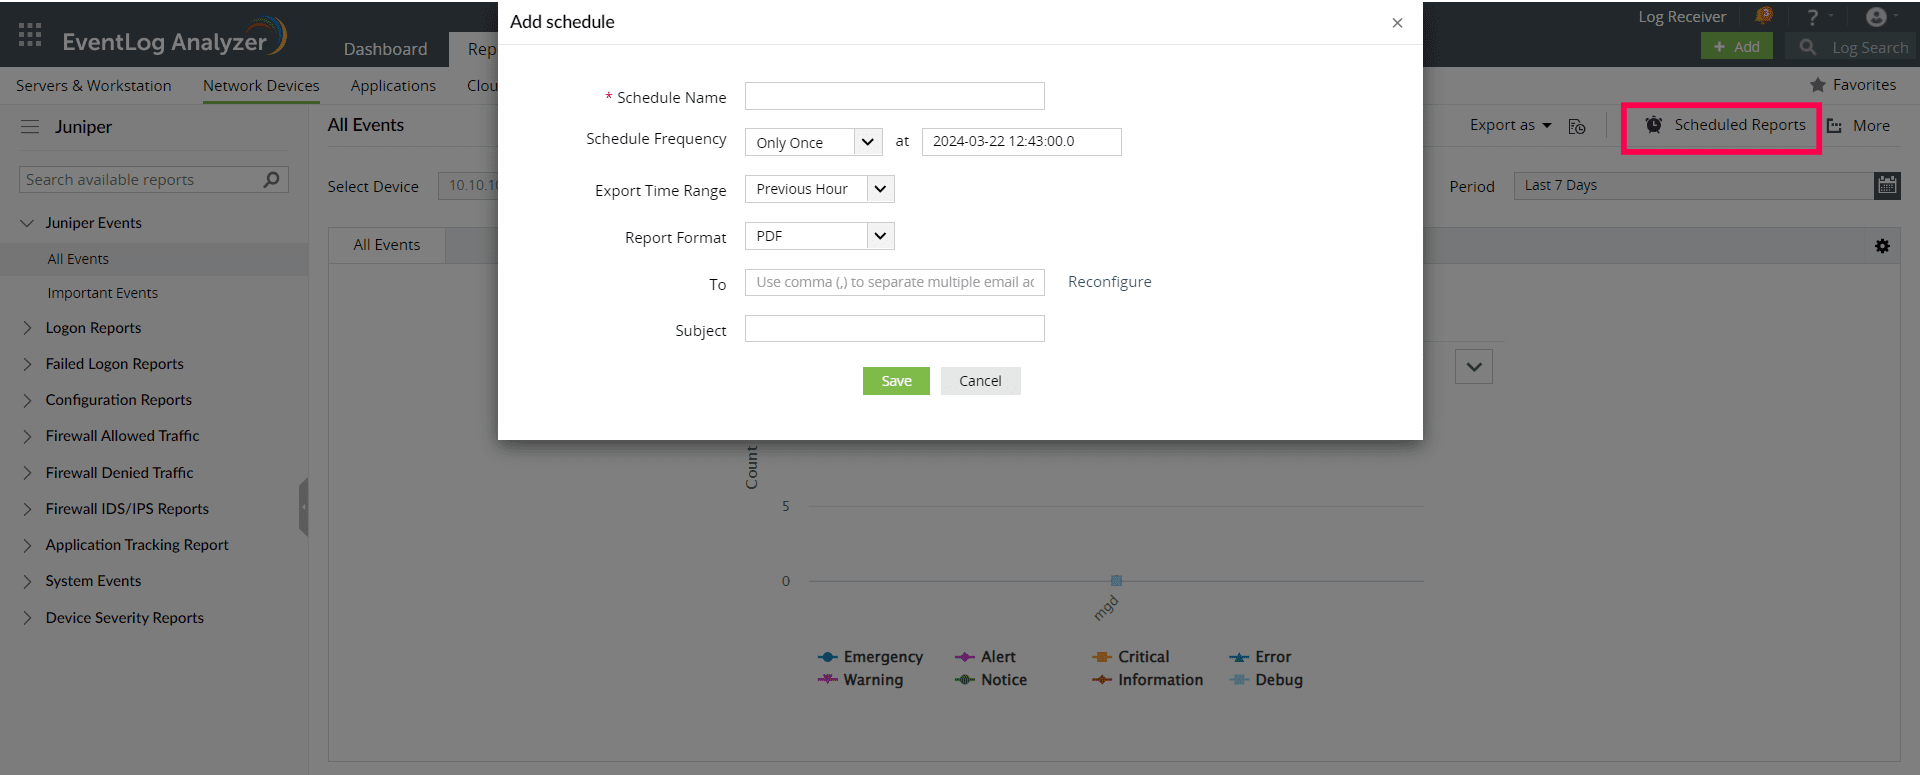
- Click Scheduled Reports to have this report exported and emailed periodically.
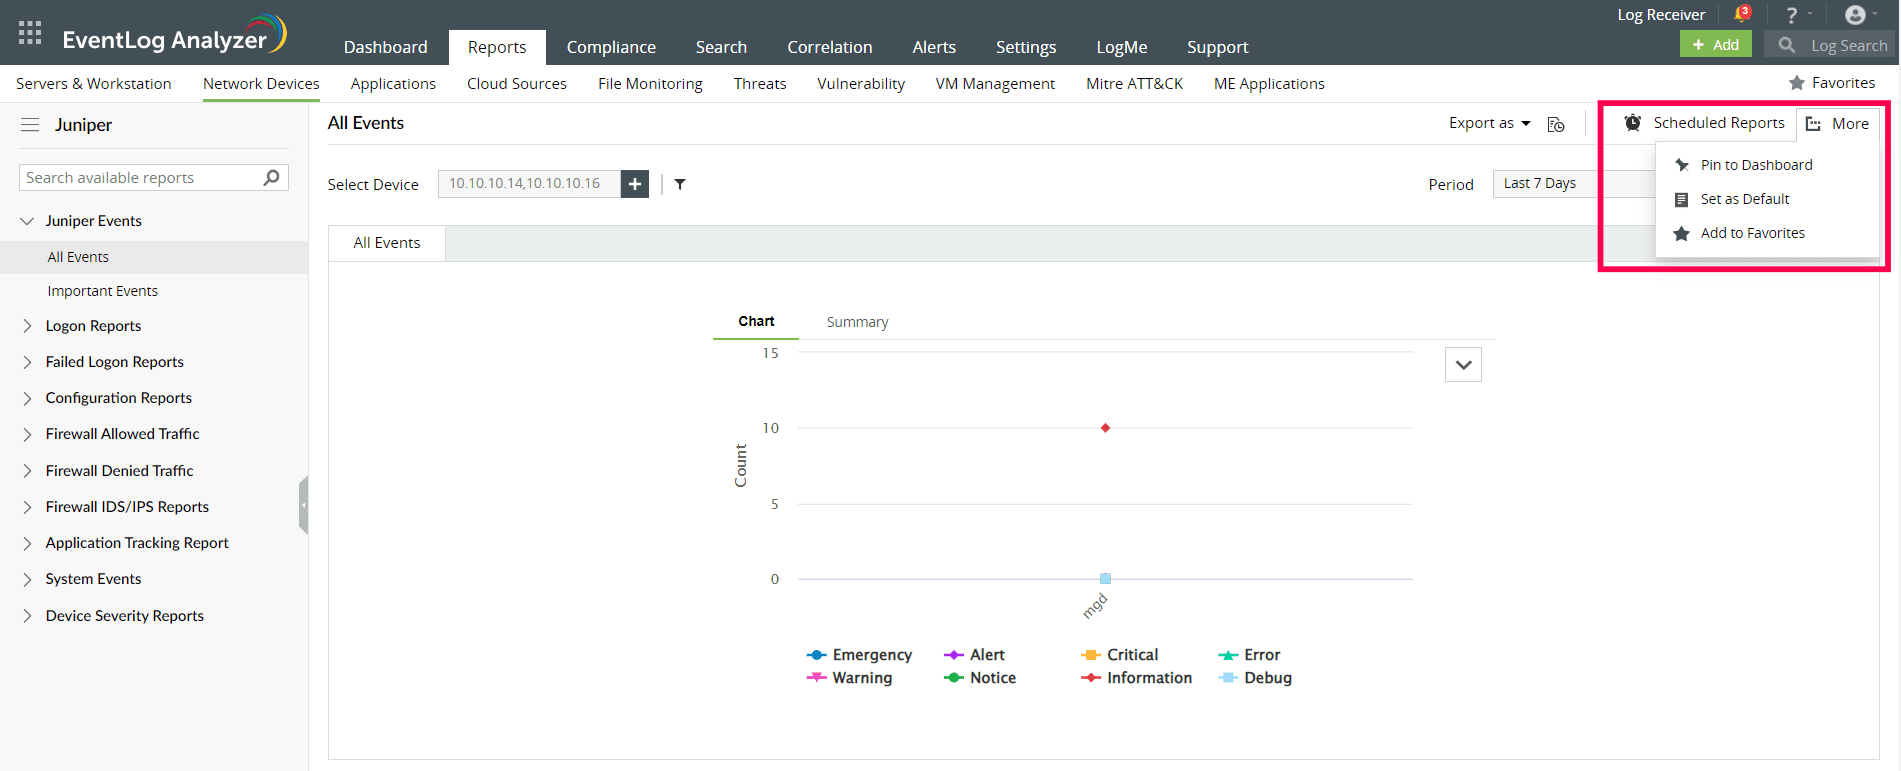
- Click More for further customization options.
- Set as Default, to set this report as the default for Juniper reports.
- Add to Favorites, to mark this report as favorite.
- Pin to dashboard, to pin this report to the main dashboard in the Home page.
 Click here to expand