lhs-panel Click here to expand

Manage Report Views

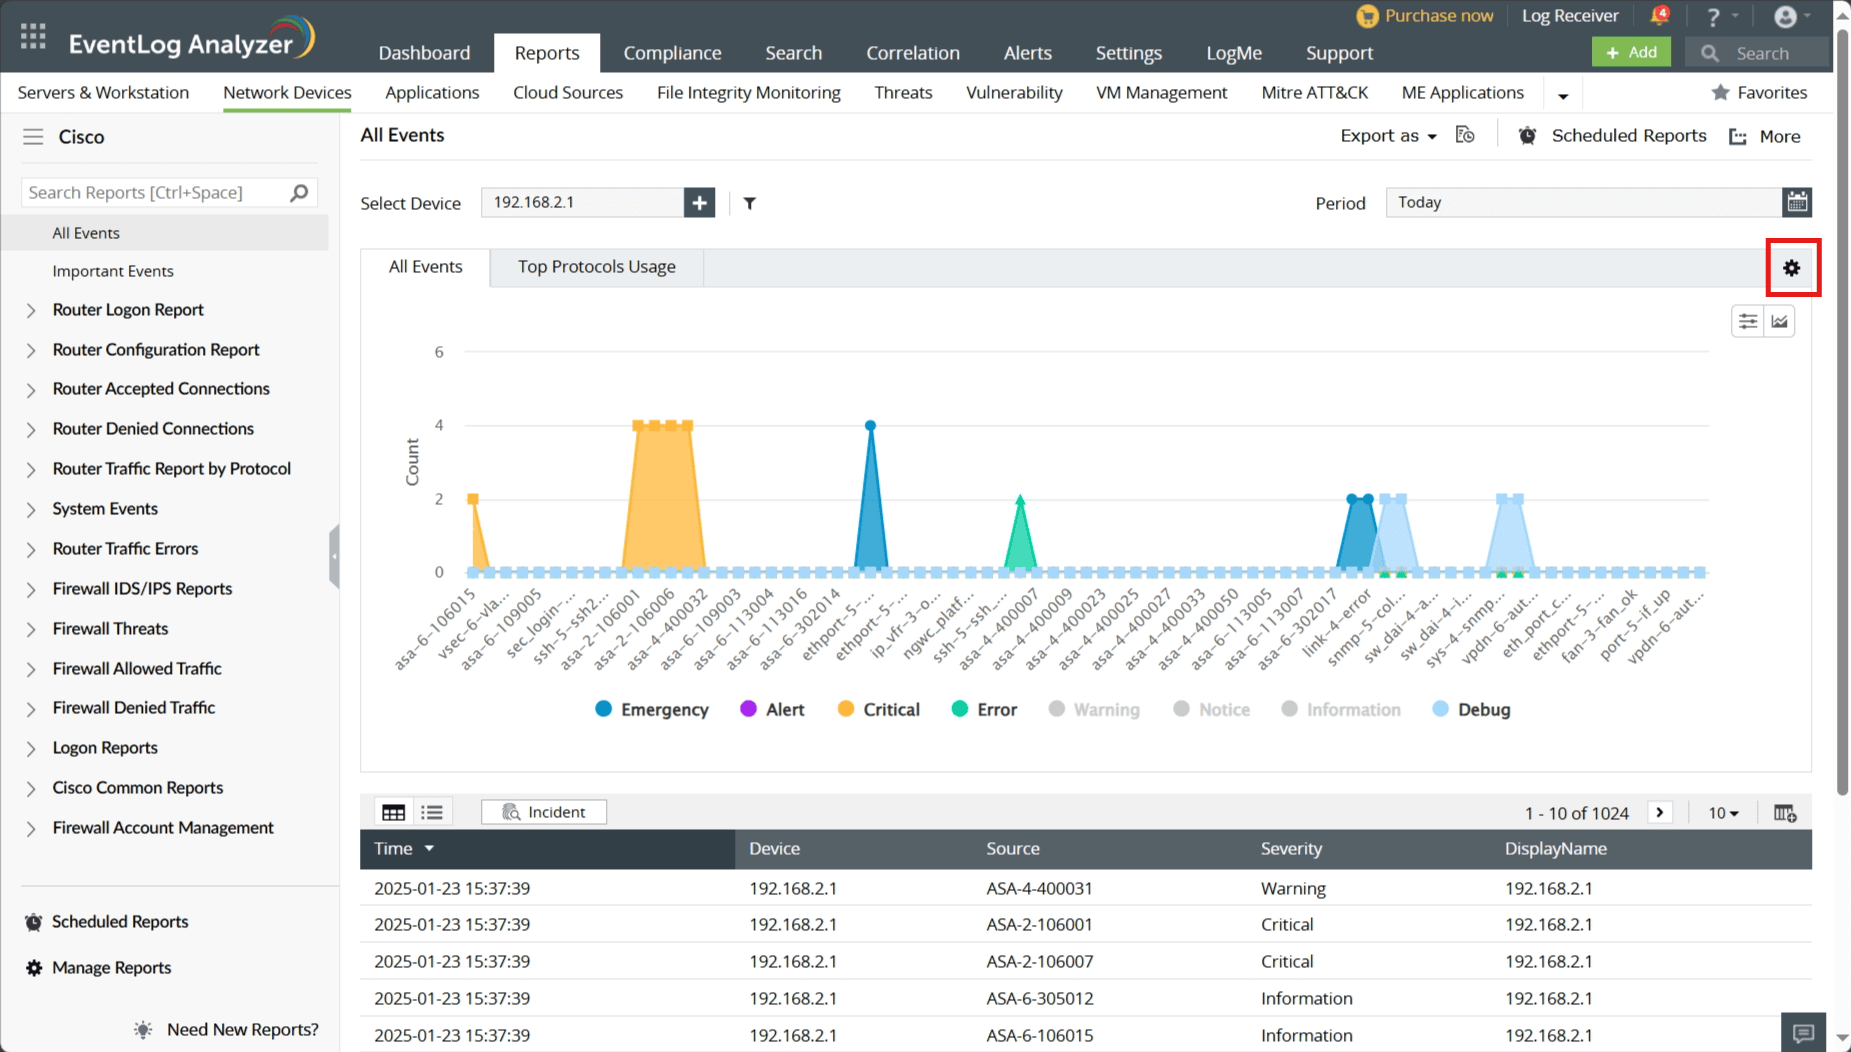
EventLog Analyzer allows you to create multiple views of the same report. This enables you to view the report based on different parameters such as time, domain, source, etc. The different views will be generated from the same set of log data.

In this help document, you will learn to perform the following operations.

Creating a new report view

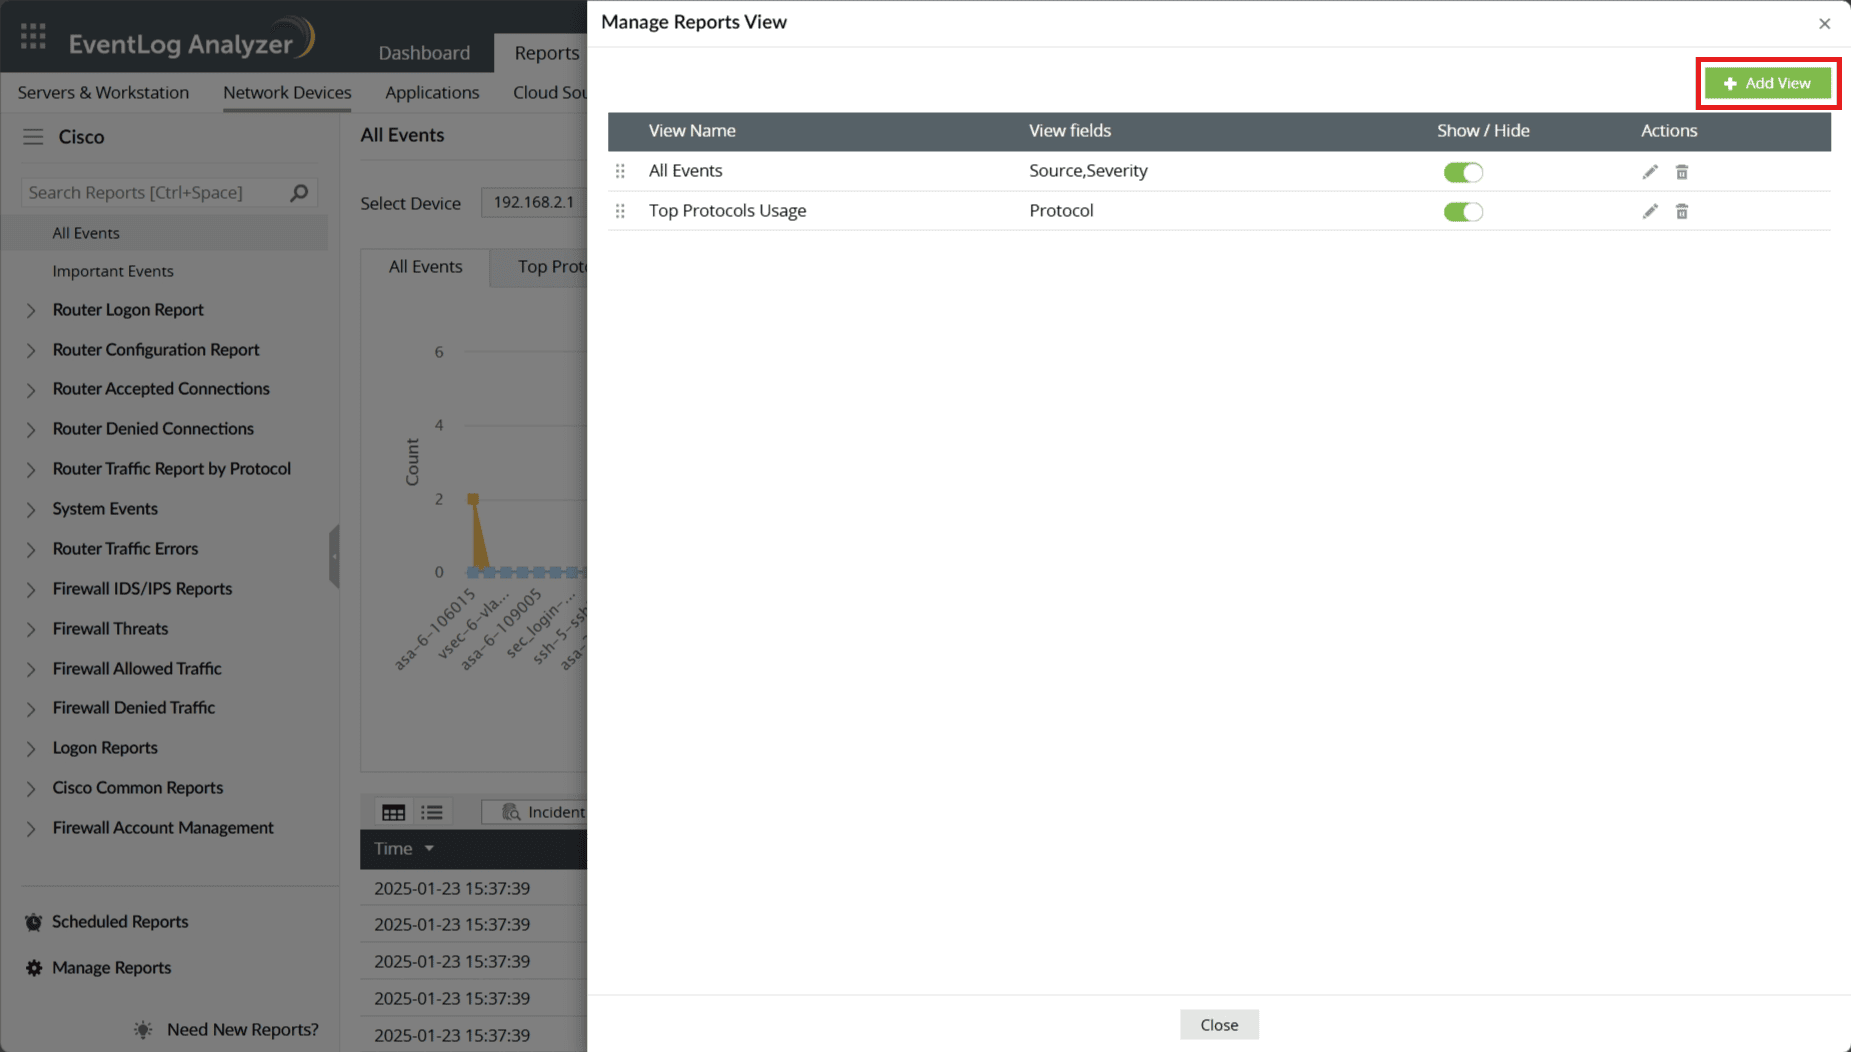
To create a new report view,

  • Open EventLog Analyzer and select the Reports tab.
  • Choose the required report and click on the (Manage Custom Views) icon present on the right corner.
  • In the pop-up window that appears, click on +Add View.
  • Enter a suitable name for the View and choose the required parameters based on the View type - Summary View | Pivot View
  • Click on Add.
  • The new view will be added as a separate tab in the report.

Editing, deleting, or disabling report views

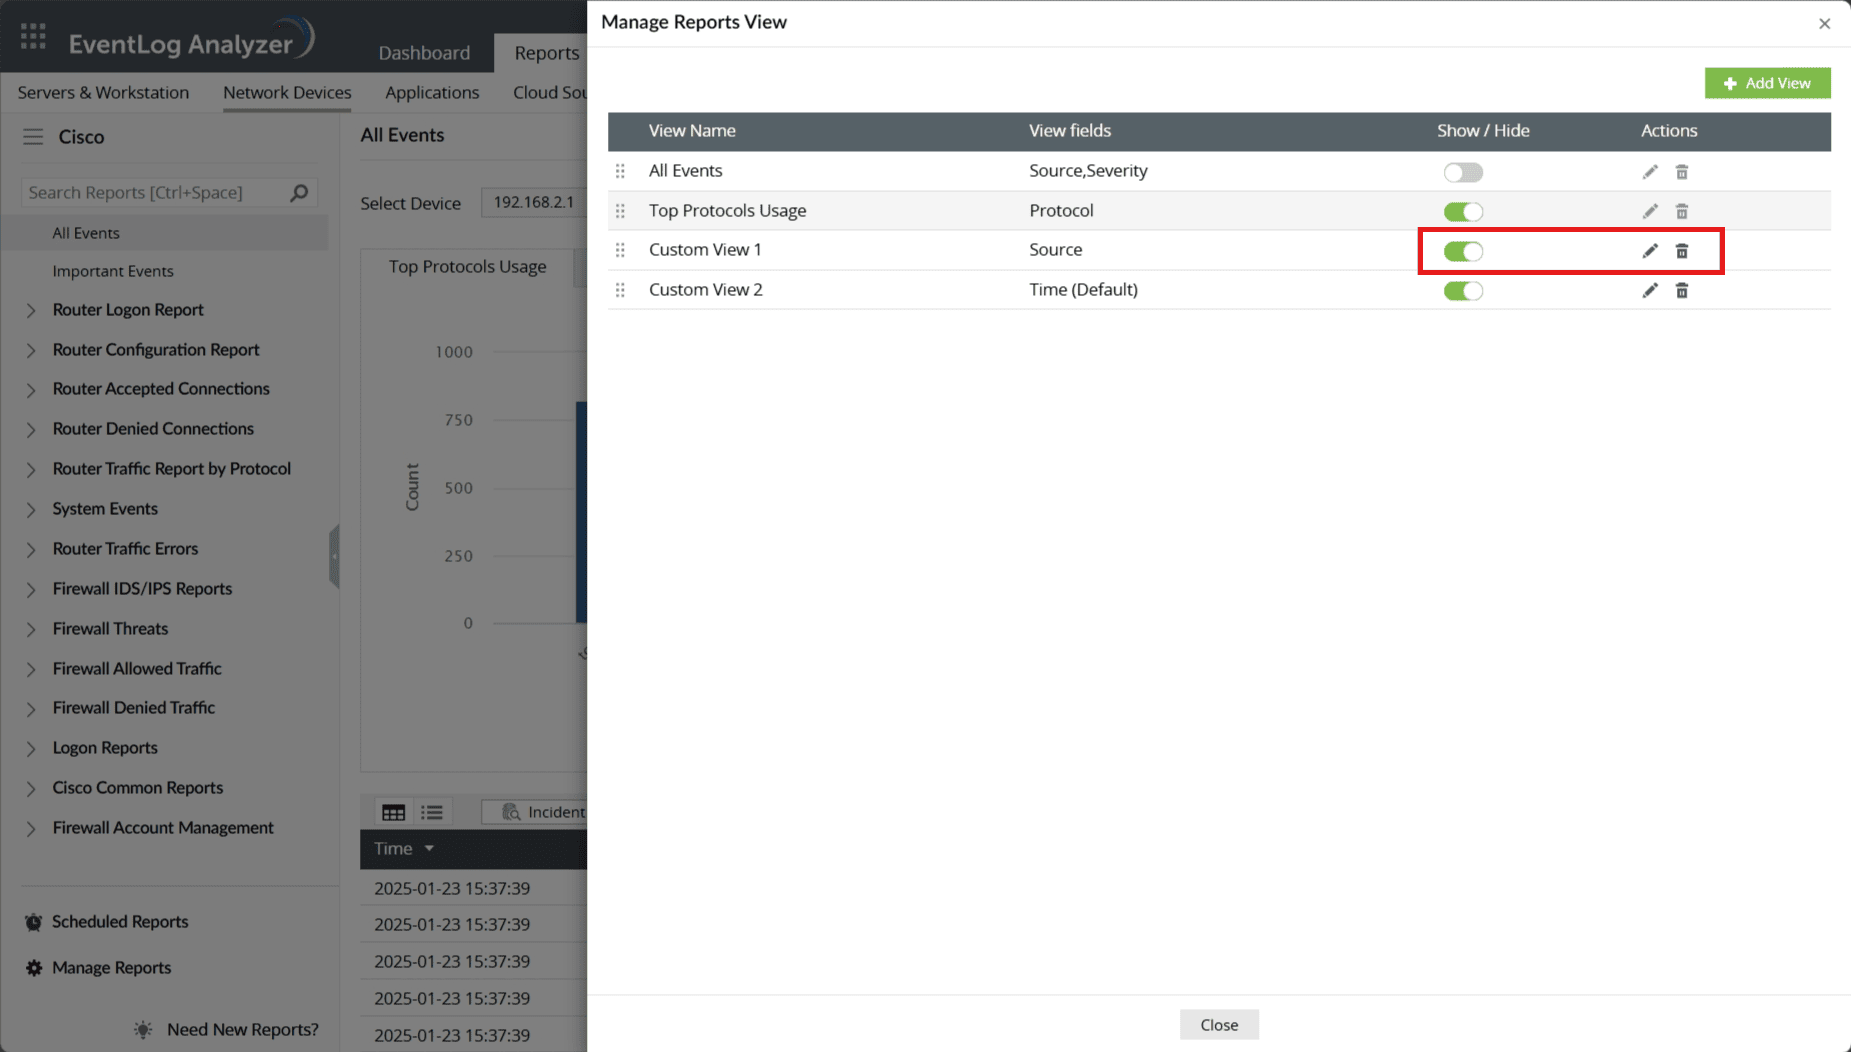
To edit, delete, or disable the views that have been created:

  • Open EventLog Analyzer and select the Reports tab.
  • Choose the report whose views you want to edit and click on the (Manage Custom Views) icon present on the right corner.
  • In the pop-up that appears you can see a list of views for that report.
  • Favorite reports
  • To edit a report view, click the icon corresponding to the view that you want to modify. Make the required changes and click on Update.
  • To delete a report view, click the icon corresponding to the view that you want to delete.
  • To show/hide a Report View, click the toggle button under the Show/Hide column, corresponding to the required View.

Filter Options

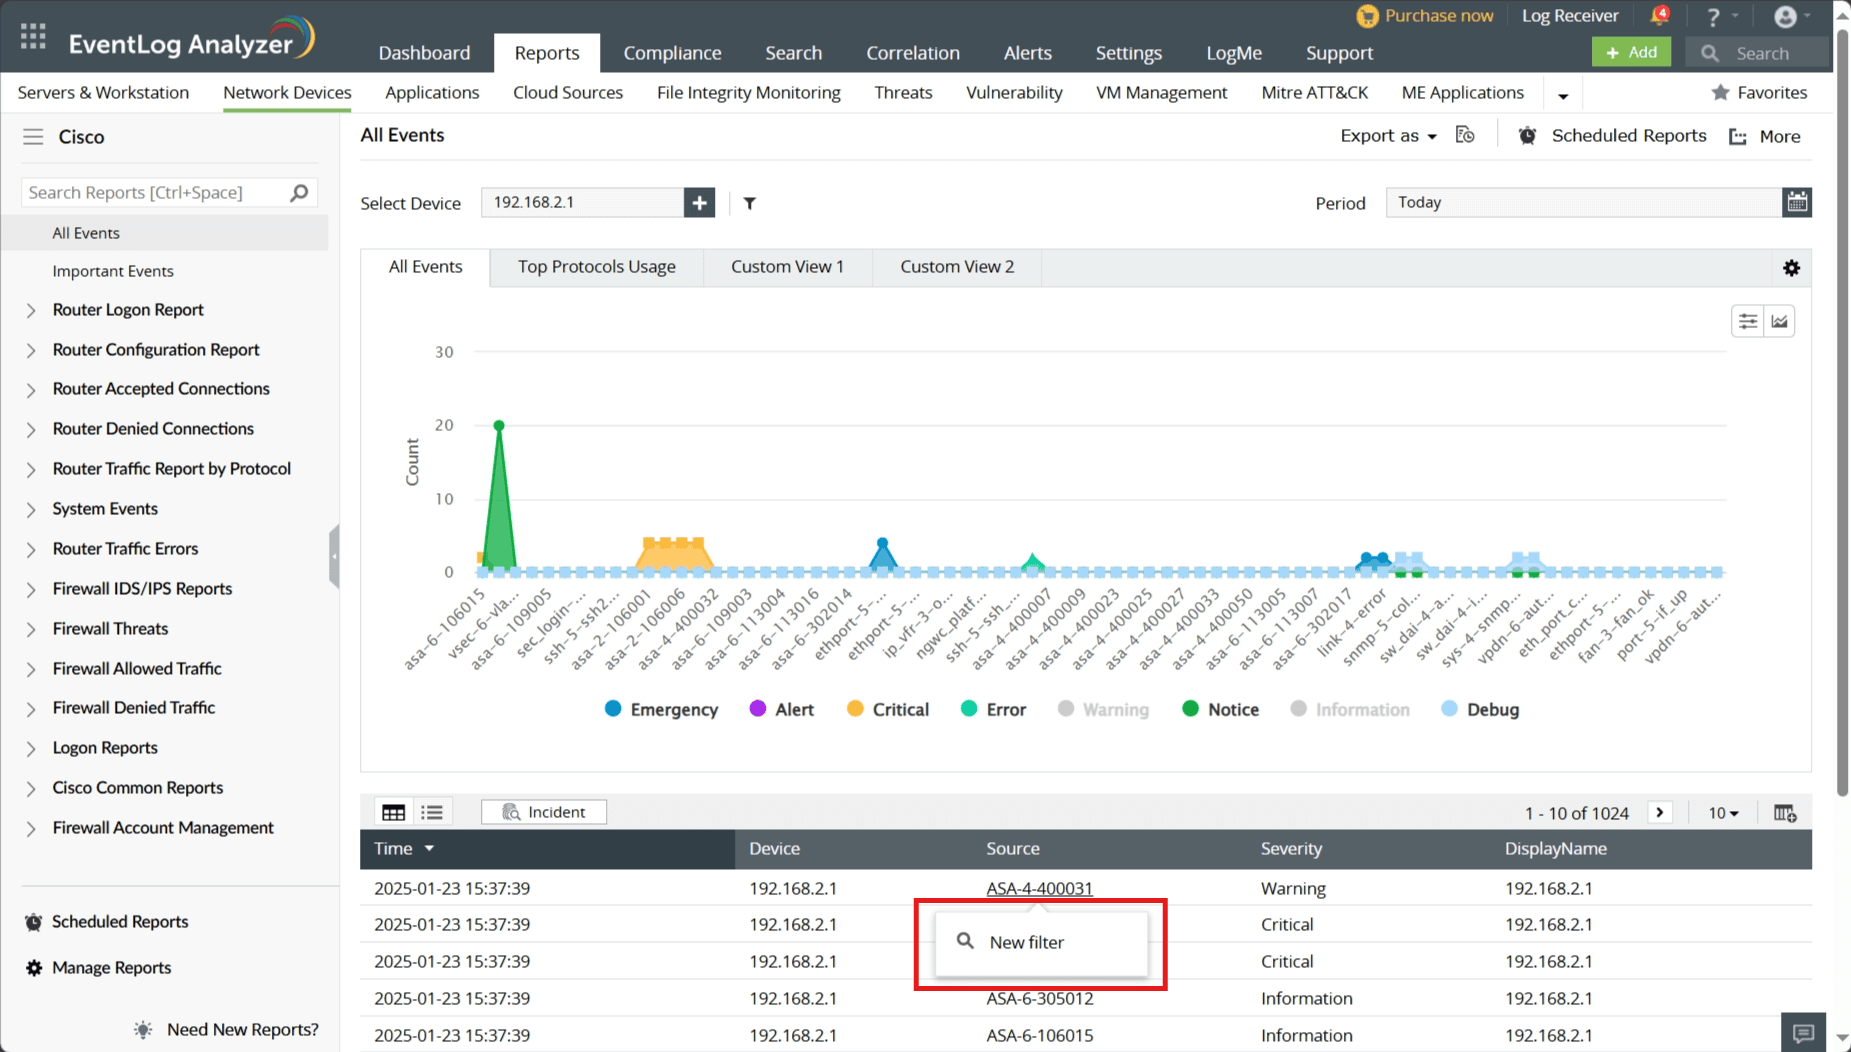
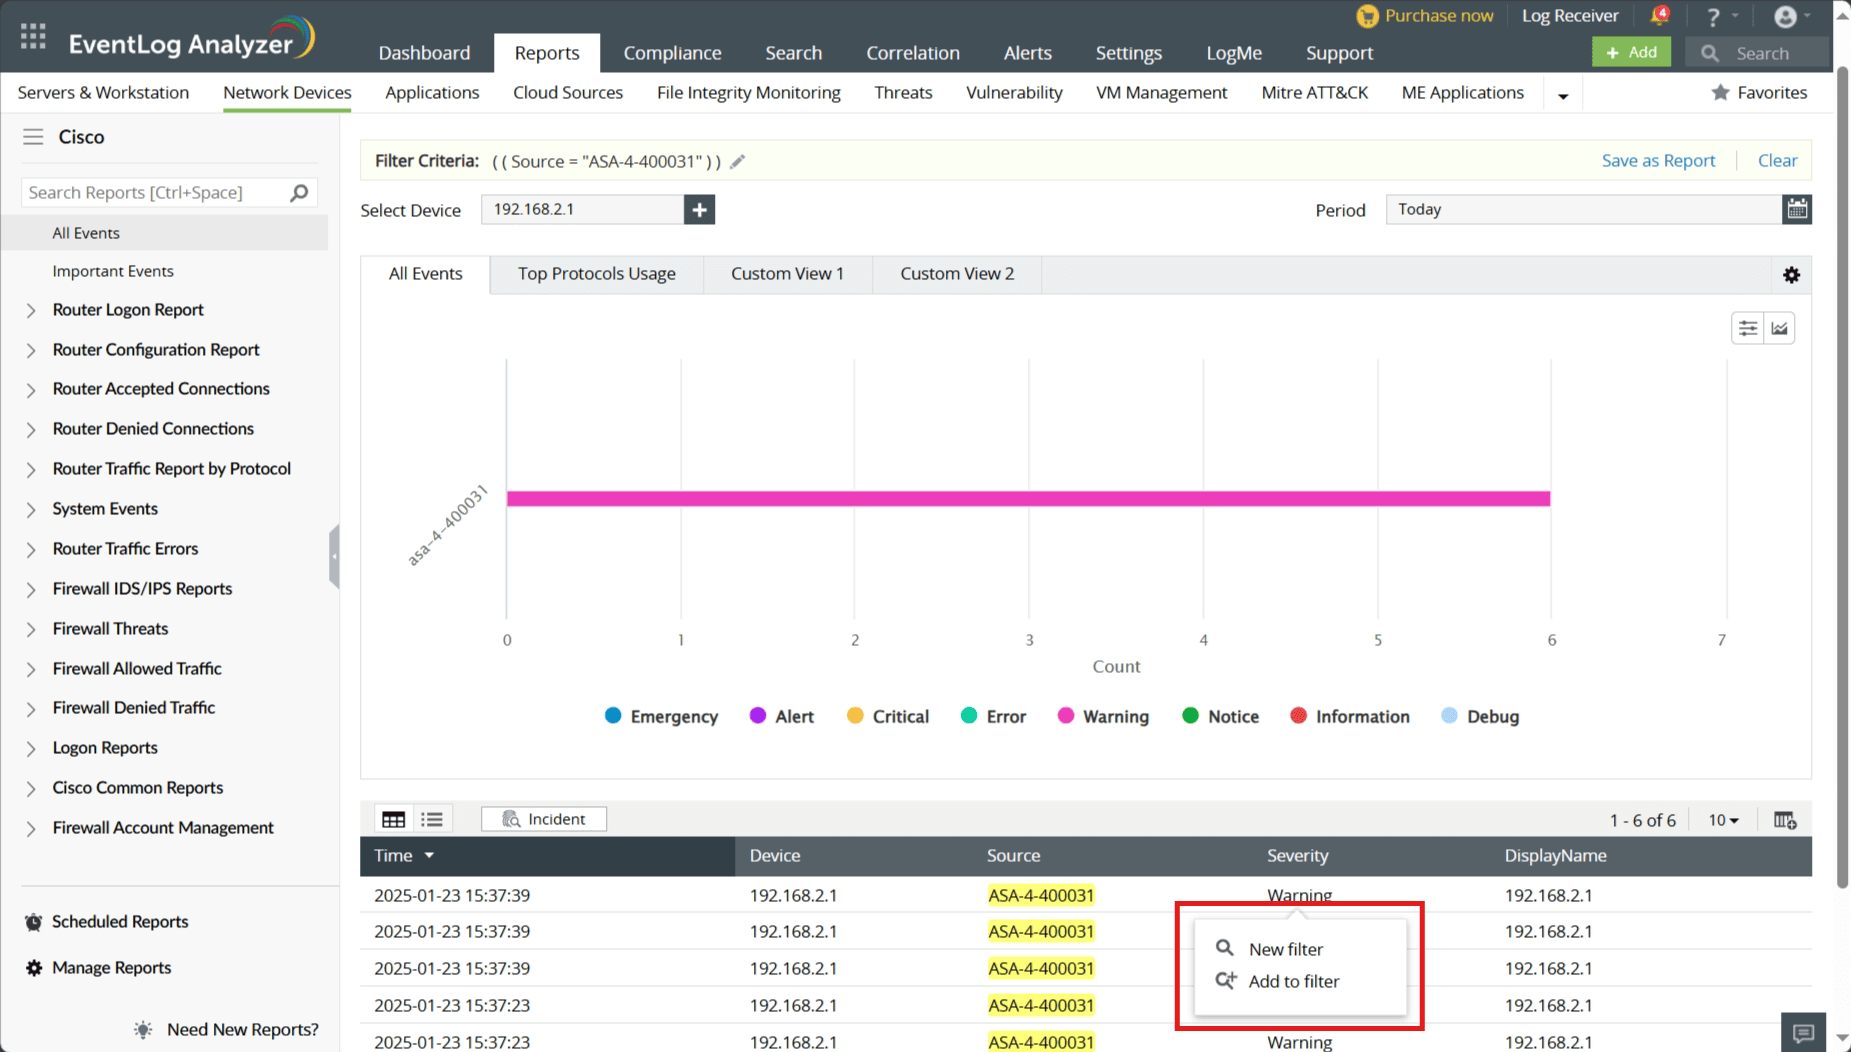
The Filter Options feature allows flexible management of data filters to suit your needs.

It supports two types of filtering behavior, depending on how the data is selected:

Filter types:

  • Full Value Selection

    Clicking on a complete value applies a filter using an equals (=) condition. This will return only the records that exactly match the selected value.

  • Partial Text Selection

    Manually highlighting a portion of a value applies a filter using a contains condition. This will return records that include the selected text anywhere within the value.

The filters can be applied as a new filter or to existing conditions.

  1. New filter:
    • Clears all existing filters and applies a new filter, displaying only the newly filtered data.
    • Favorite reports
  2. Add to filter:
    • If a filter is already applied, this option allows you to append a new filter to the existing one. This enables you to refine your data further without removing the previously applied filters.
    • Favorite reports

View Customization

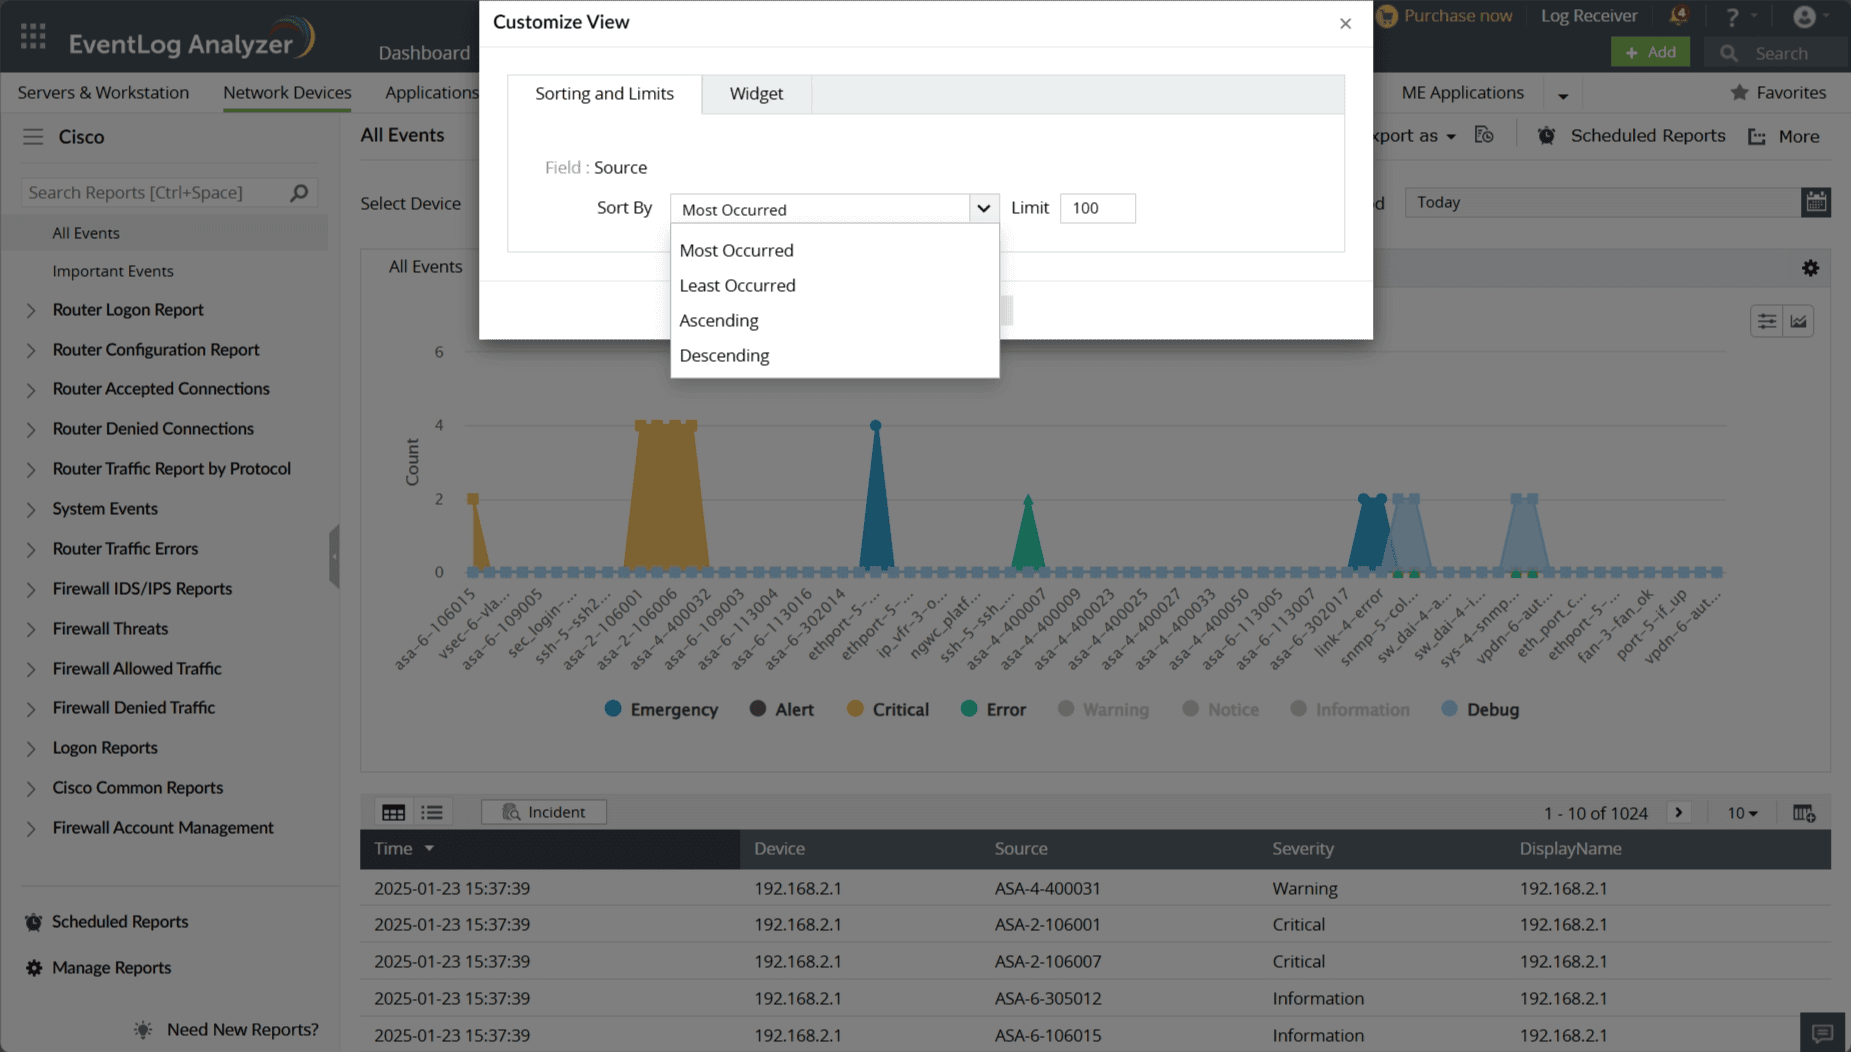
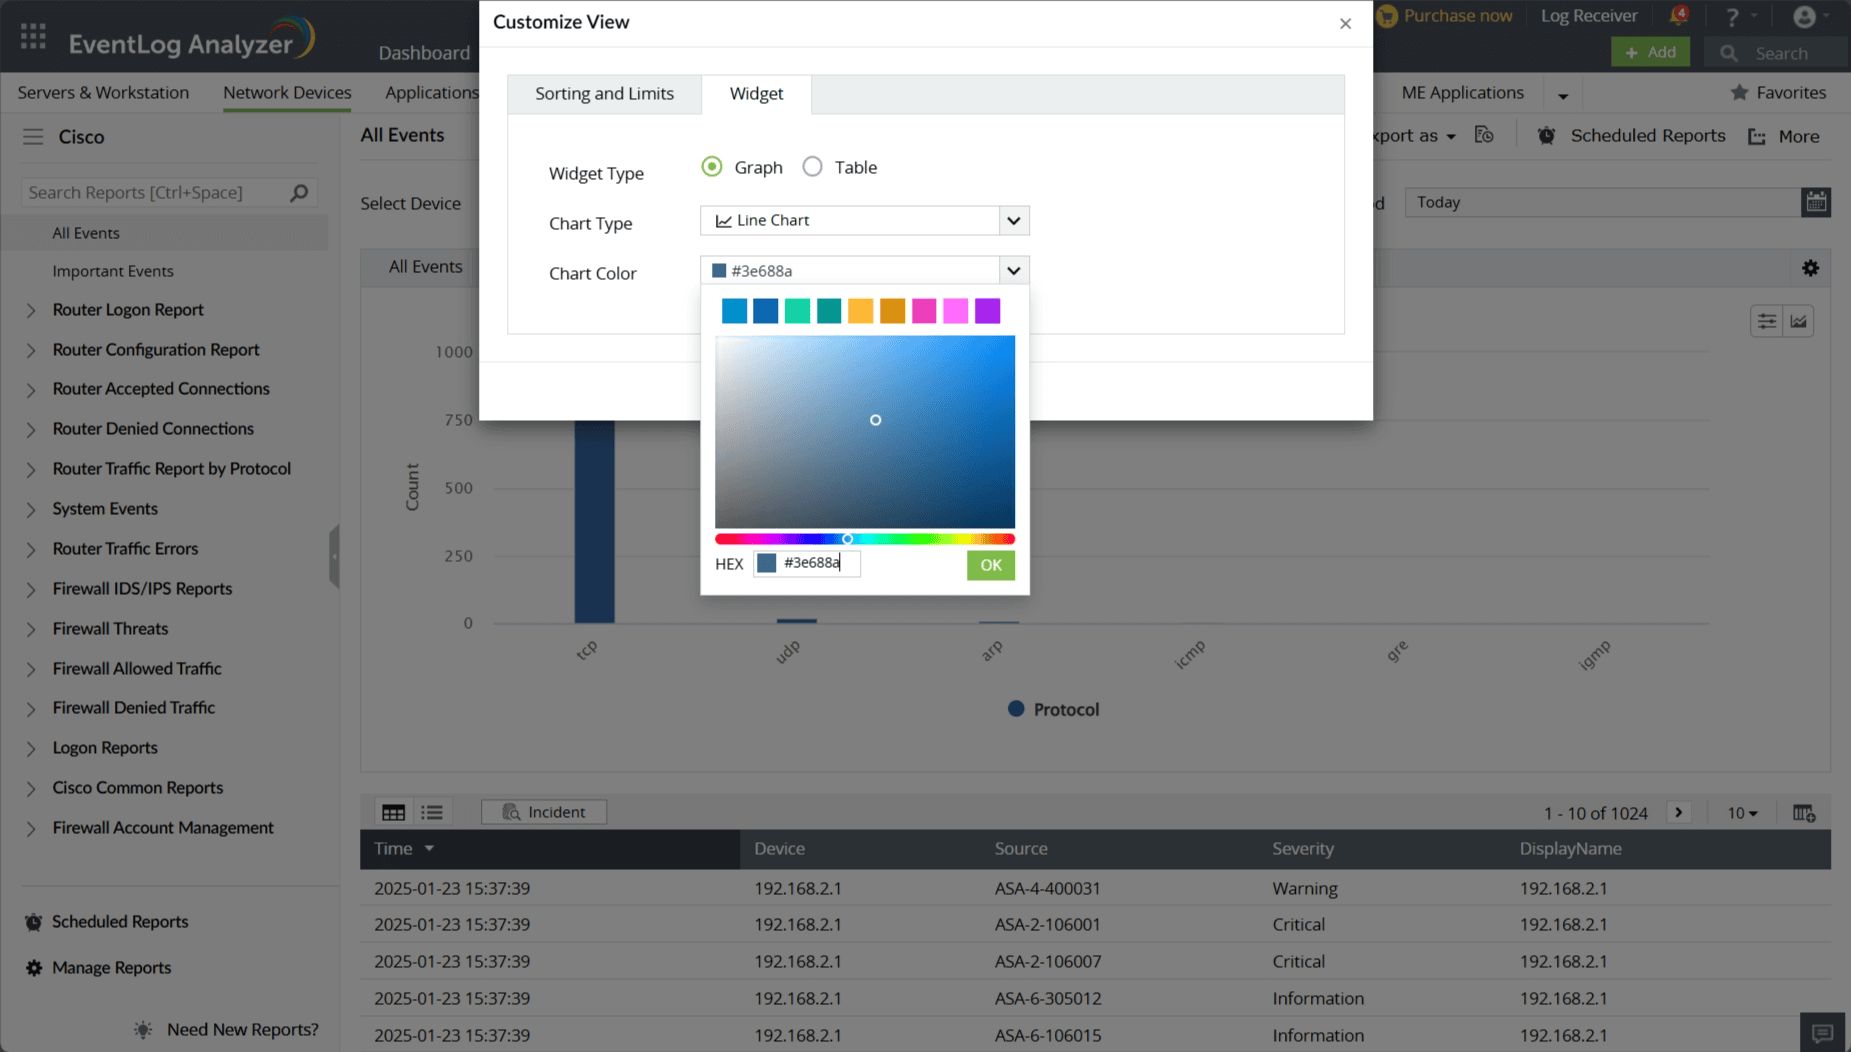
The view customization option present in the top right corner lets you customize the view of reports.

Favorite reports

The Sorting and Limits feature lets you set the sorting order for your view and configure a limit for the displayed content.

Note: The time field does not have a limit option.
Favorite reports

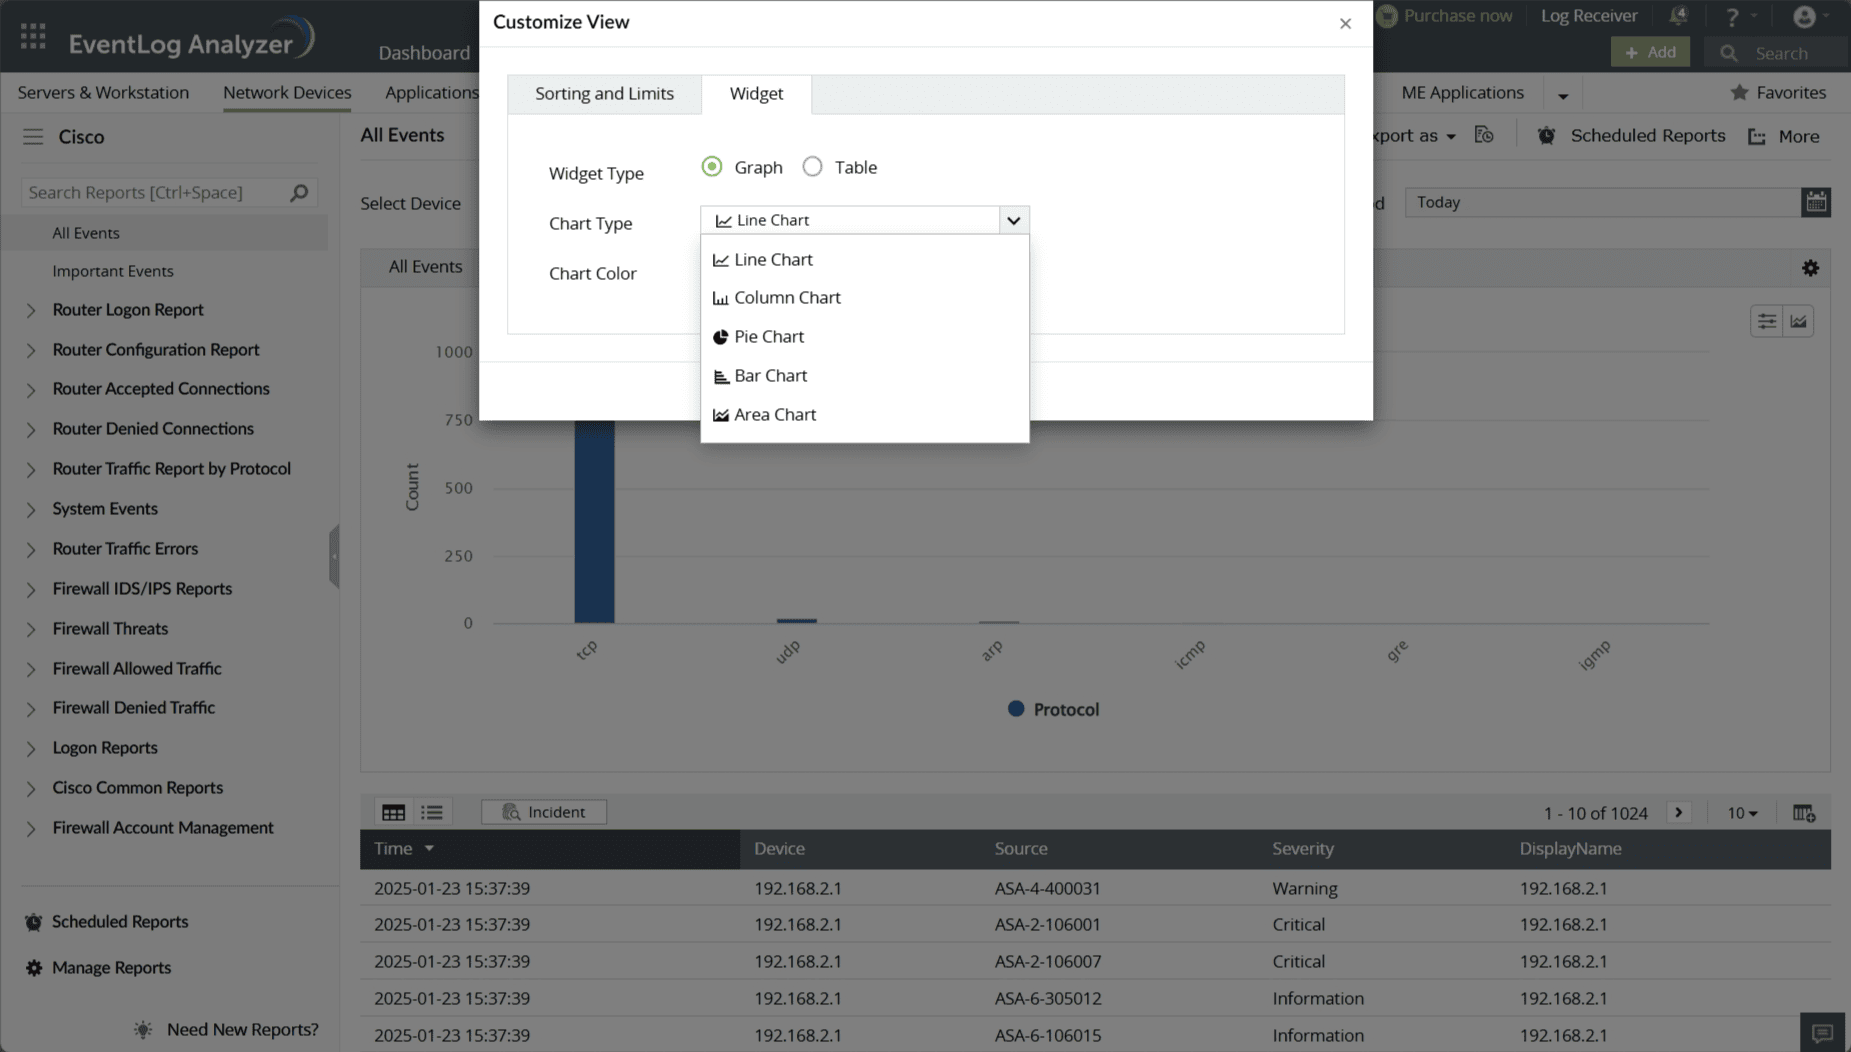
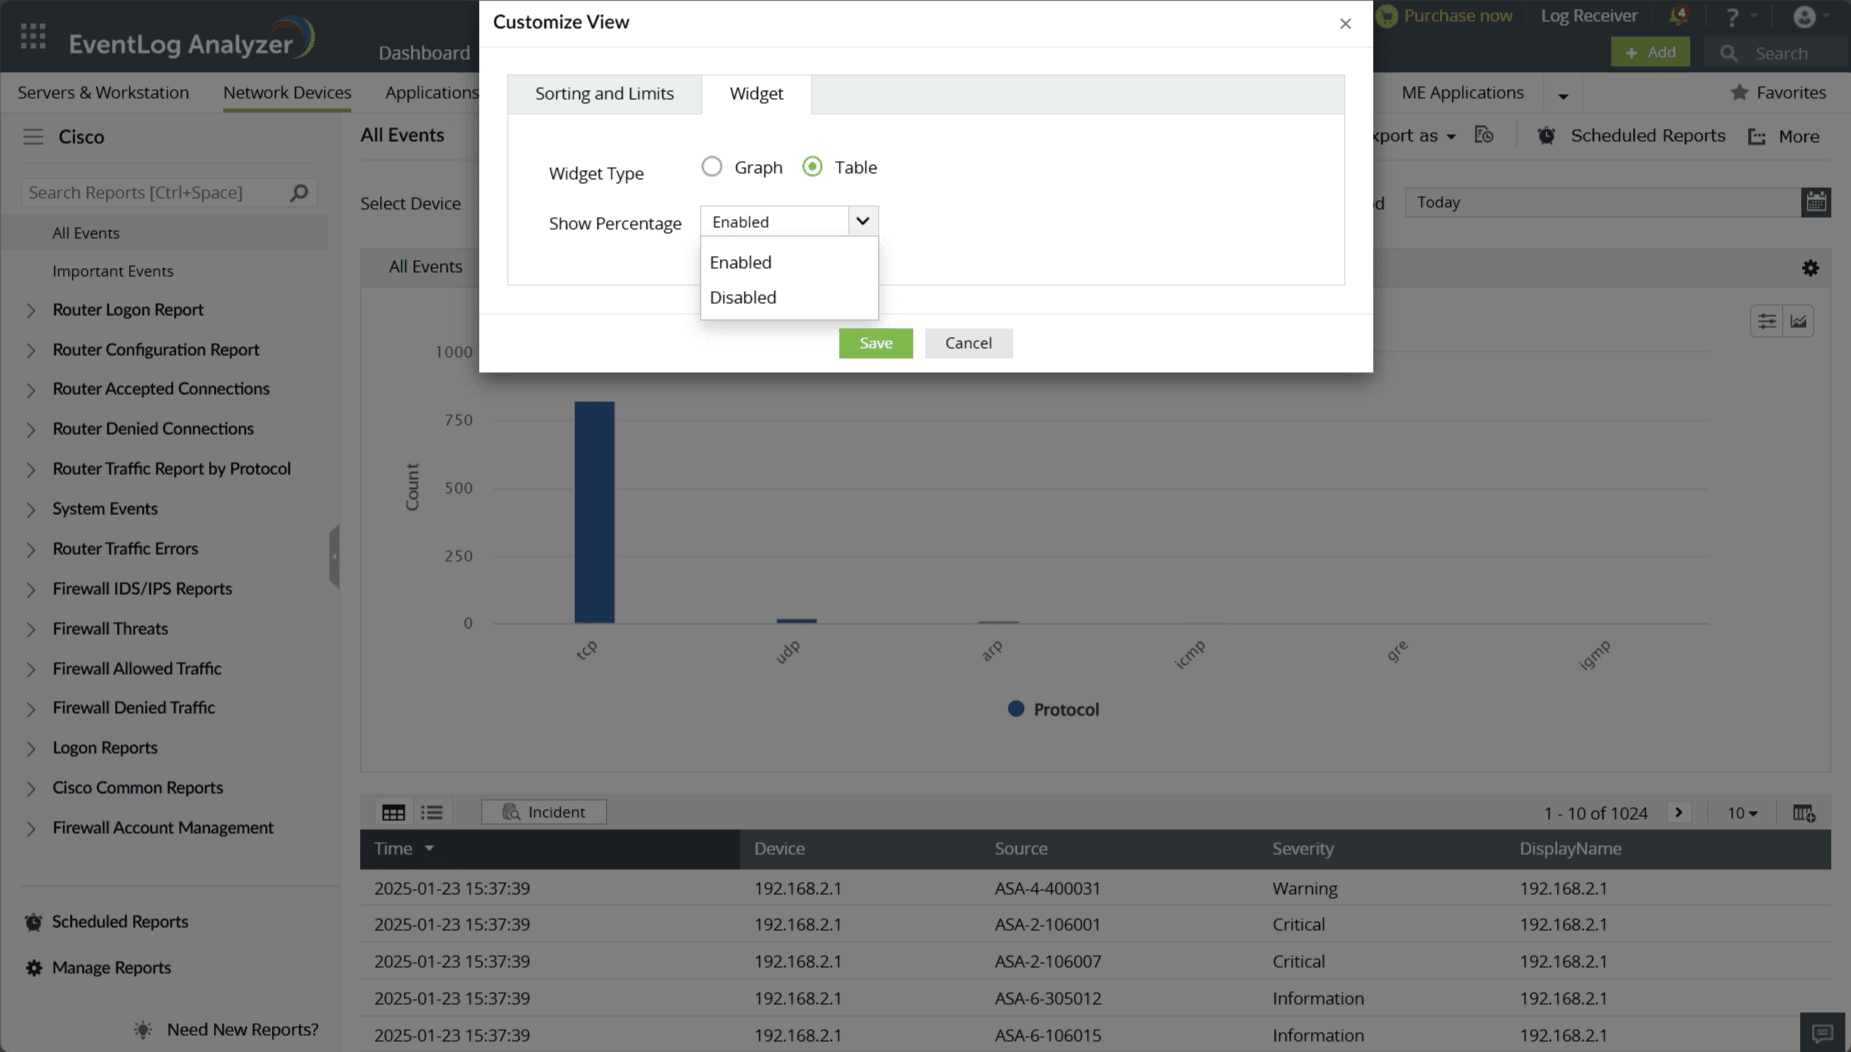
The Widget feature will let you switch between Table or Graph views based on preference.

Favorite reports

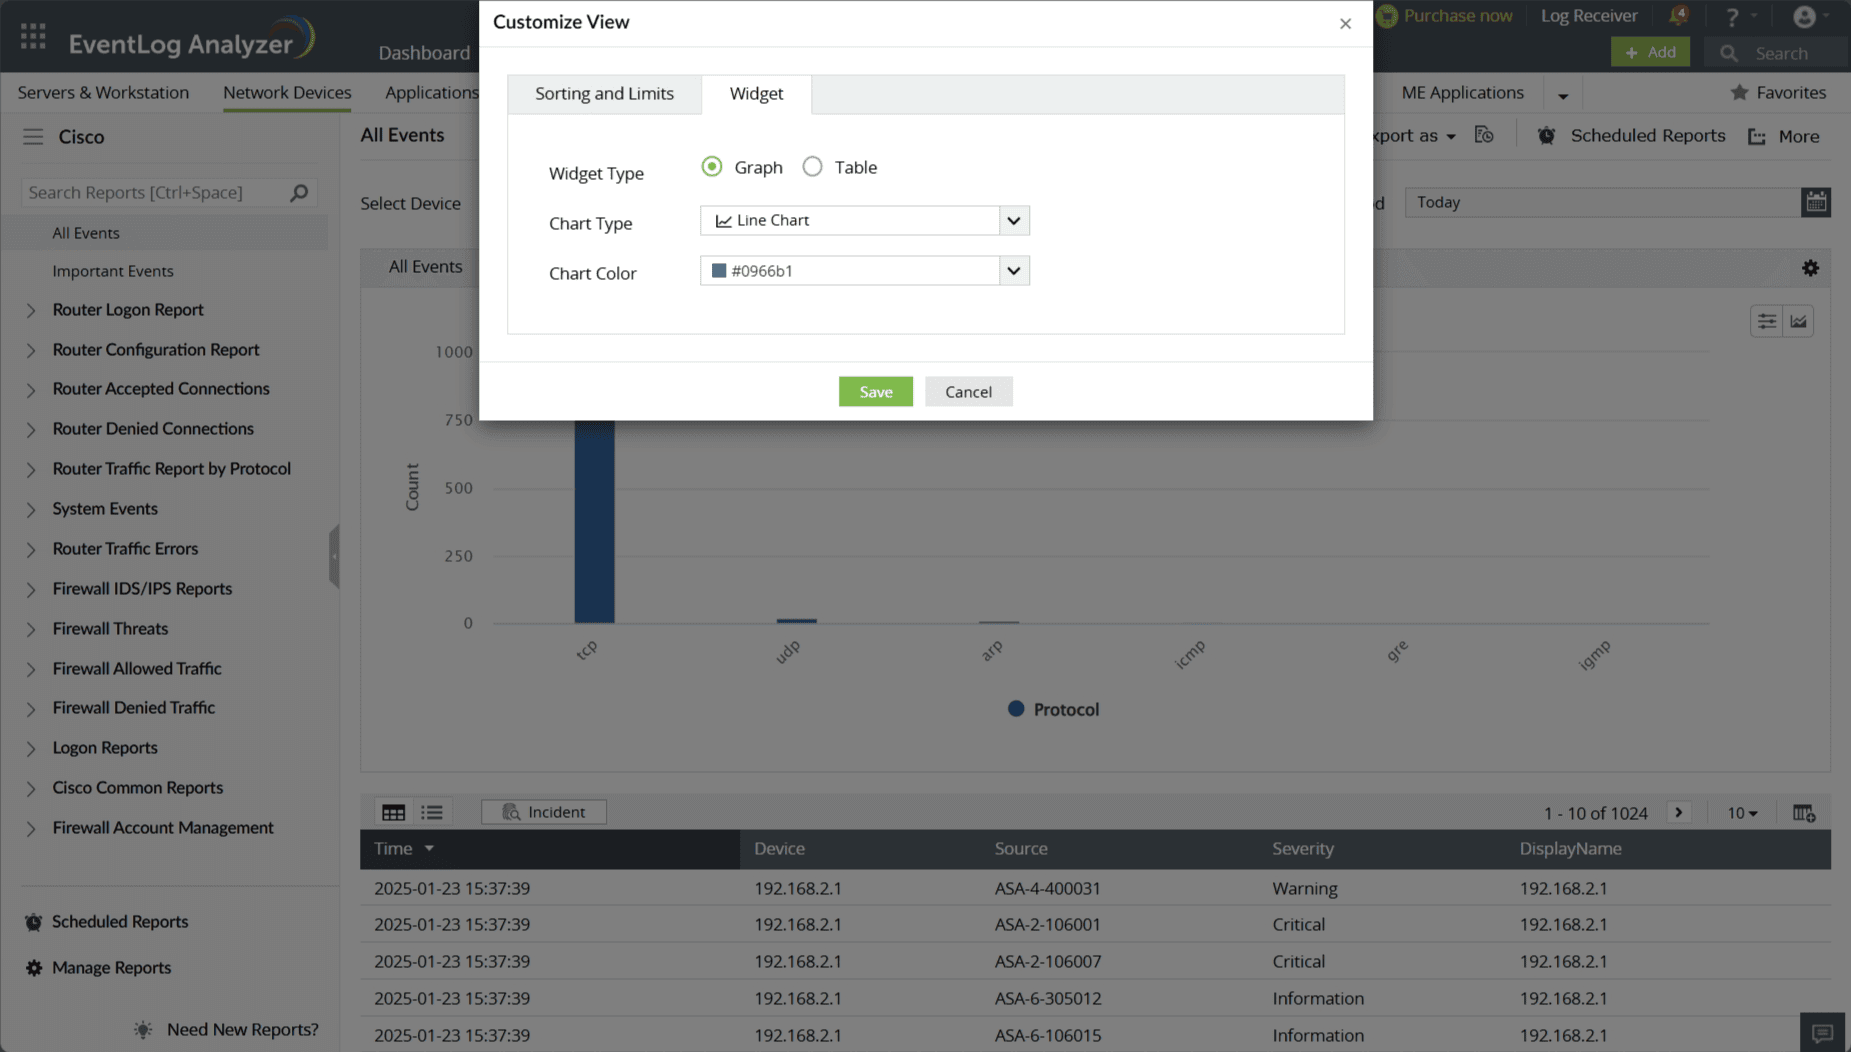
The chart customization feature will let you choose:

  • The type of graph
  • Favorite reports
  • The colors of the chart
  • Favorite reports

    The table customization feature will let you enable or disable the percentage display option for table views.

    Favorite reports
Note:
  • Only String and Converted Fields will have ascending and descending sorting.
  • The custom view option's sizes are specified as follows:
    • 1000 count per field
    • 100 count per filed
    • 10 count for more than 2 fields
  • Severity will have level based sorting.

Copyright © 2020, ZOHO Corp. All Rights Reserved.

Get download link