- Related Products
- Log360
- AD360
- ADManager Plus
- ADAudit Plus
- ADSelfService Plus
- Exchange Reporter Plus
 Click here to expand
Widgets in ManageEngine EventLog Analyzer are embeddable UI components that you can create on your own, using our JS Software Development Kit. These widgets can be used to perform certain functions that utilize data from third-party applications seamlessly.
For example, with a custom widget in EventLog Analyzer, you can seamlessly integrate data from your EDR or email security solution into EventLog Analyzer, enabling you to monitor, analyze, and take necessary actions—all from a single platform.
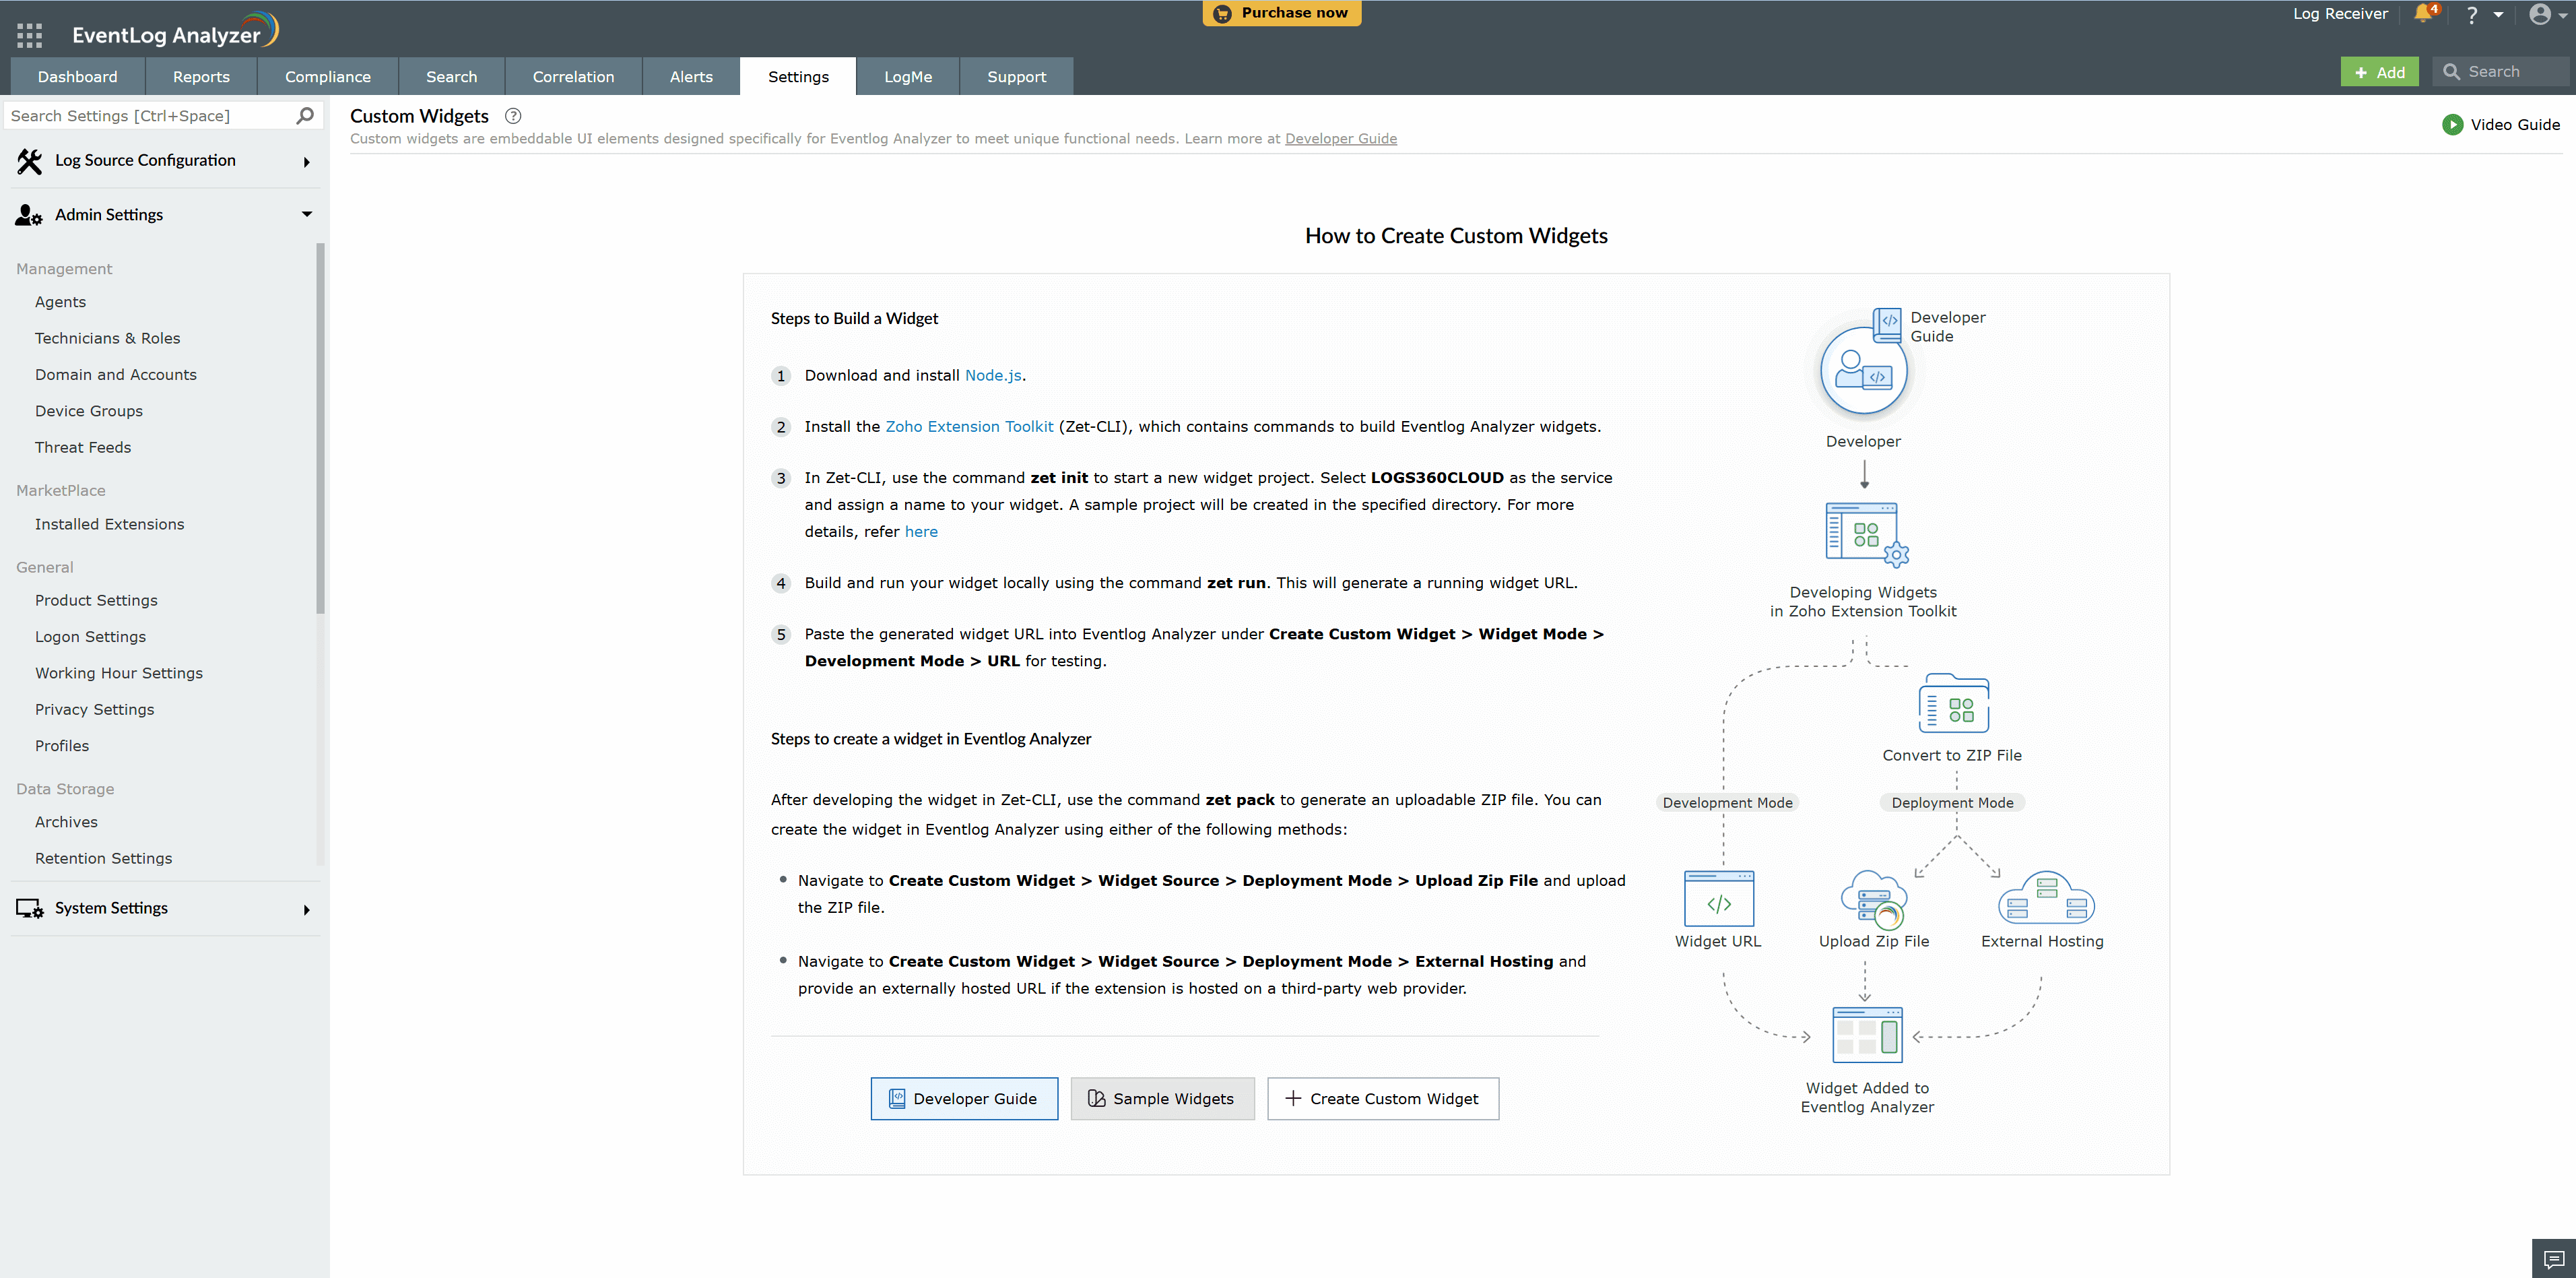
These steps will be replaced by the widget list after you create your first widget. Refer to this image to follow the setup steps easily.
Reference URLs:
You can build a custom widget for your dashboard in EventLog Analyzer. After creating the custom widget under Settings → Admin Settings → Developer Space → Custom Widgets, you can add it to your dashboard by using the Add Tab menu, where it will be listed in the dashboard settings.
The user who have access to view or create widgets in dashboard can view the custom widgets.
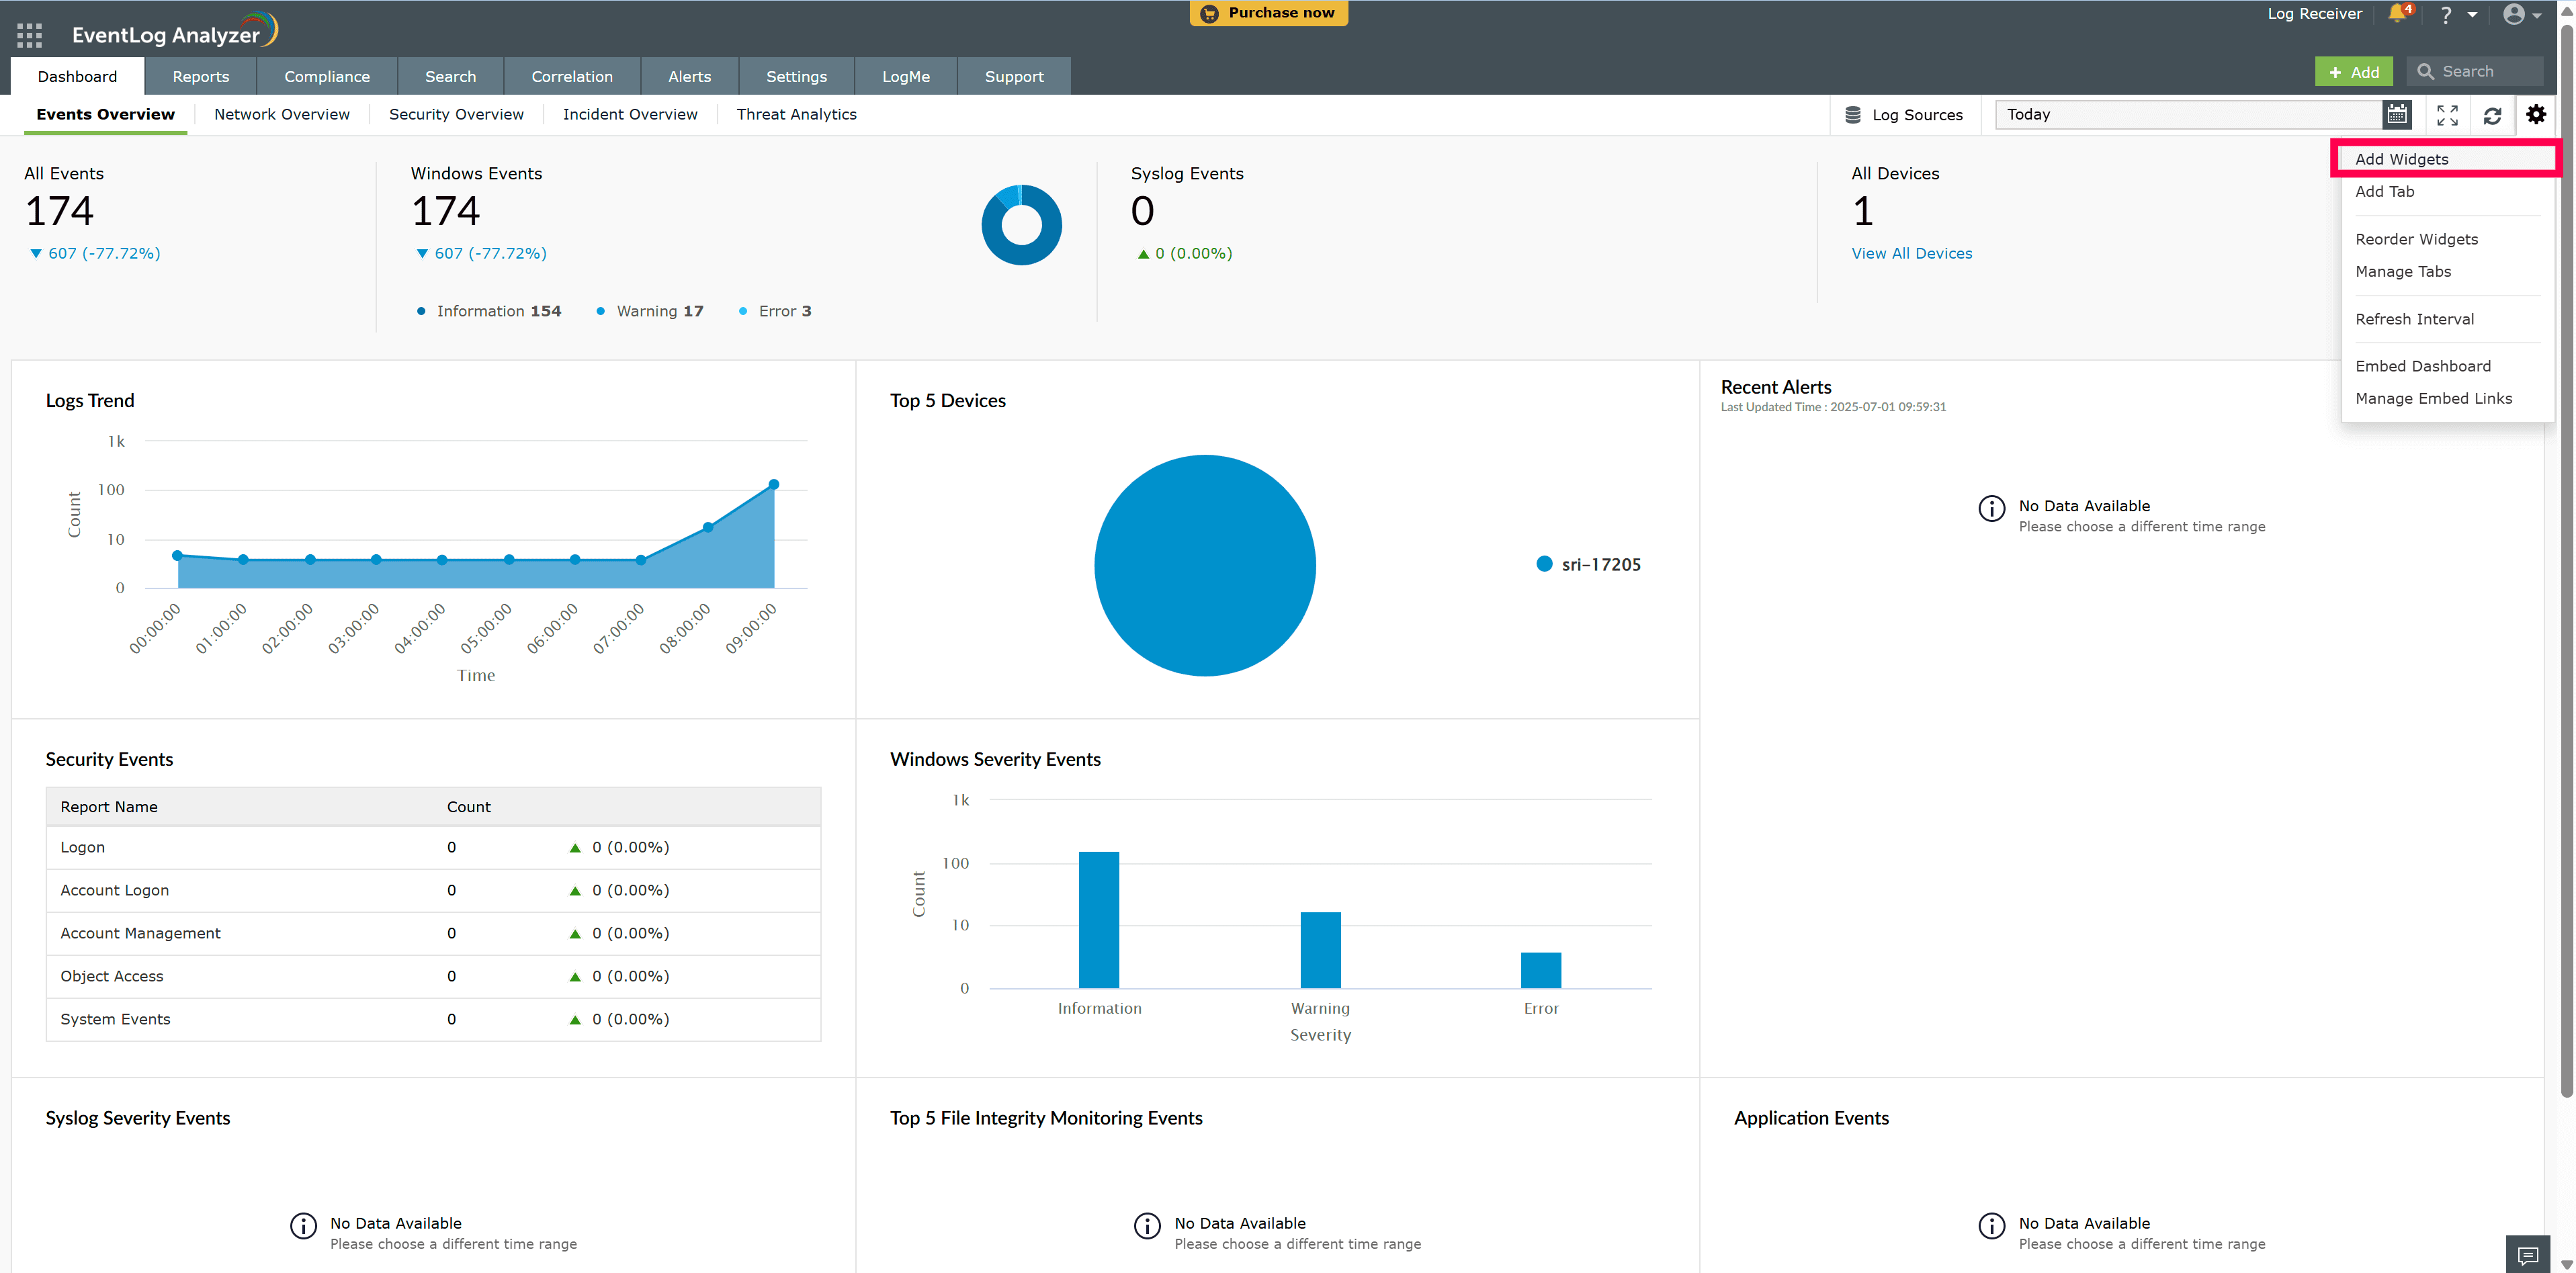
From the dropdown menu in the top right corner, choose Add widgets.
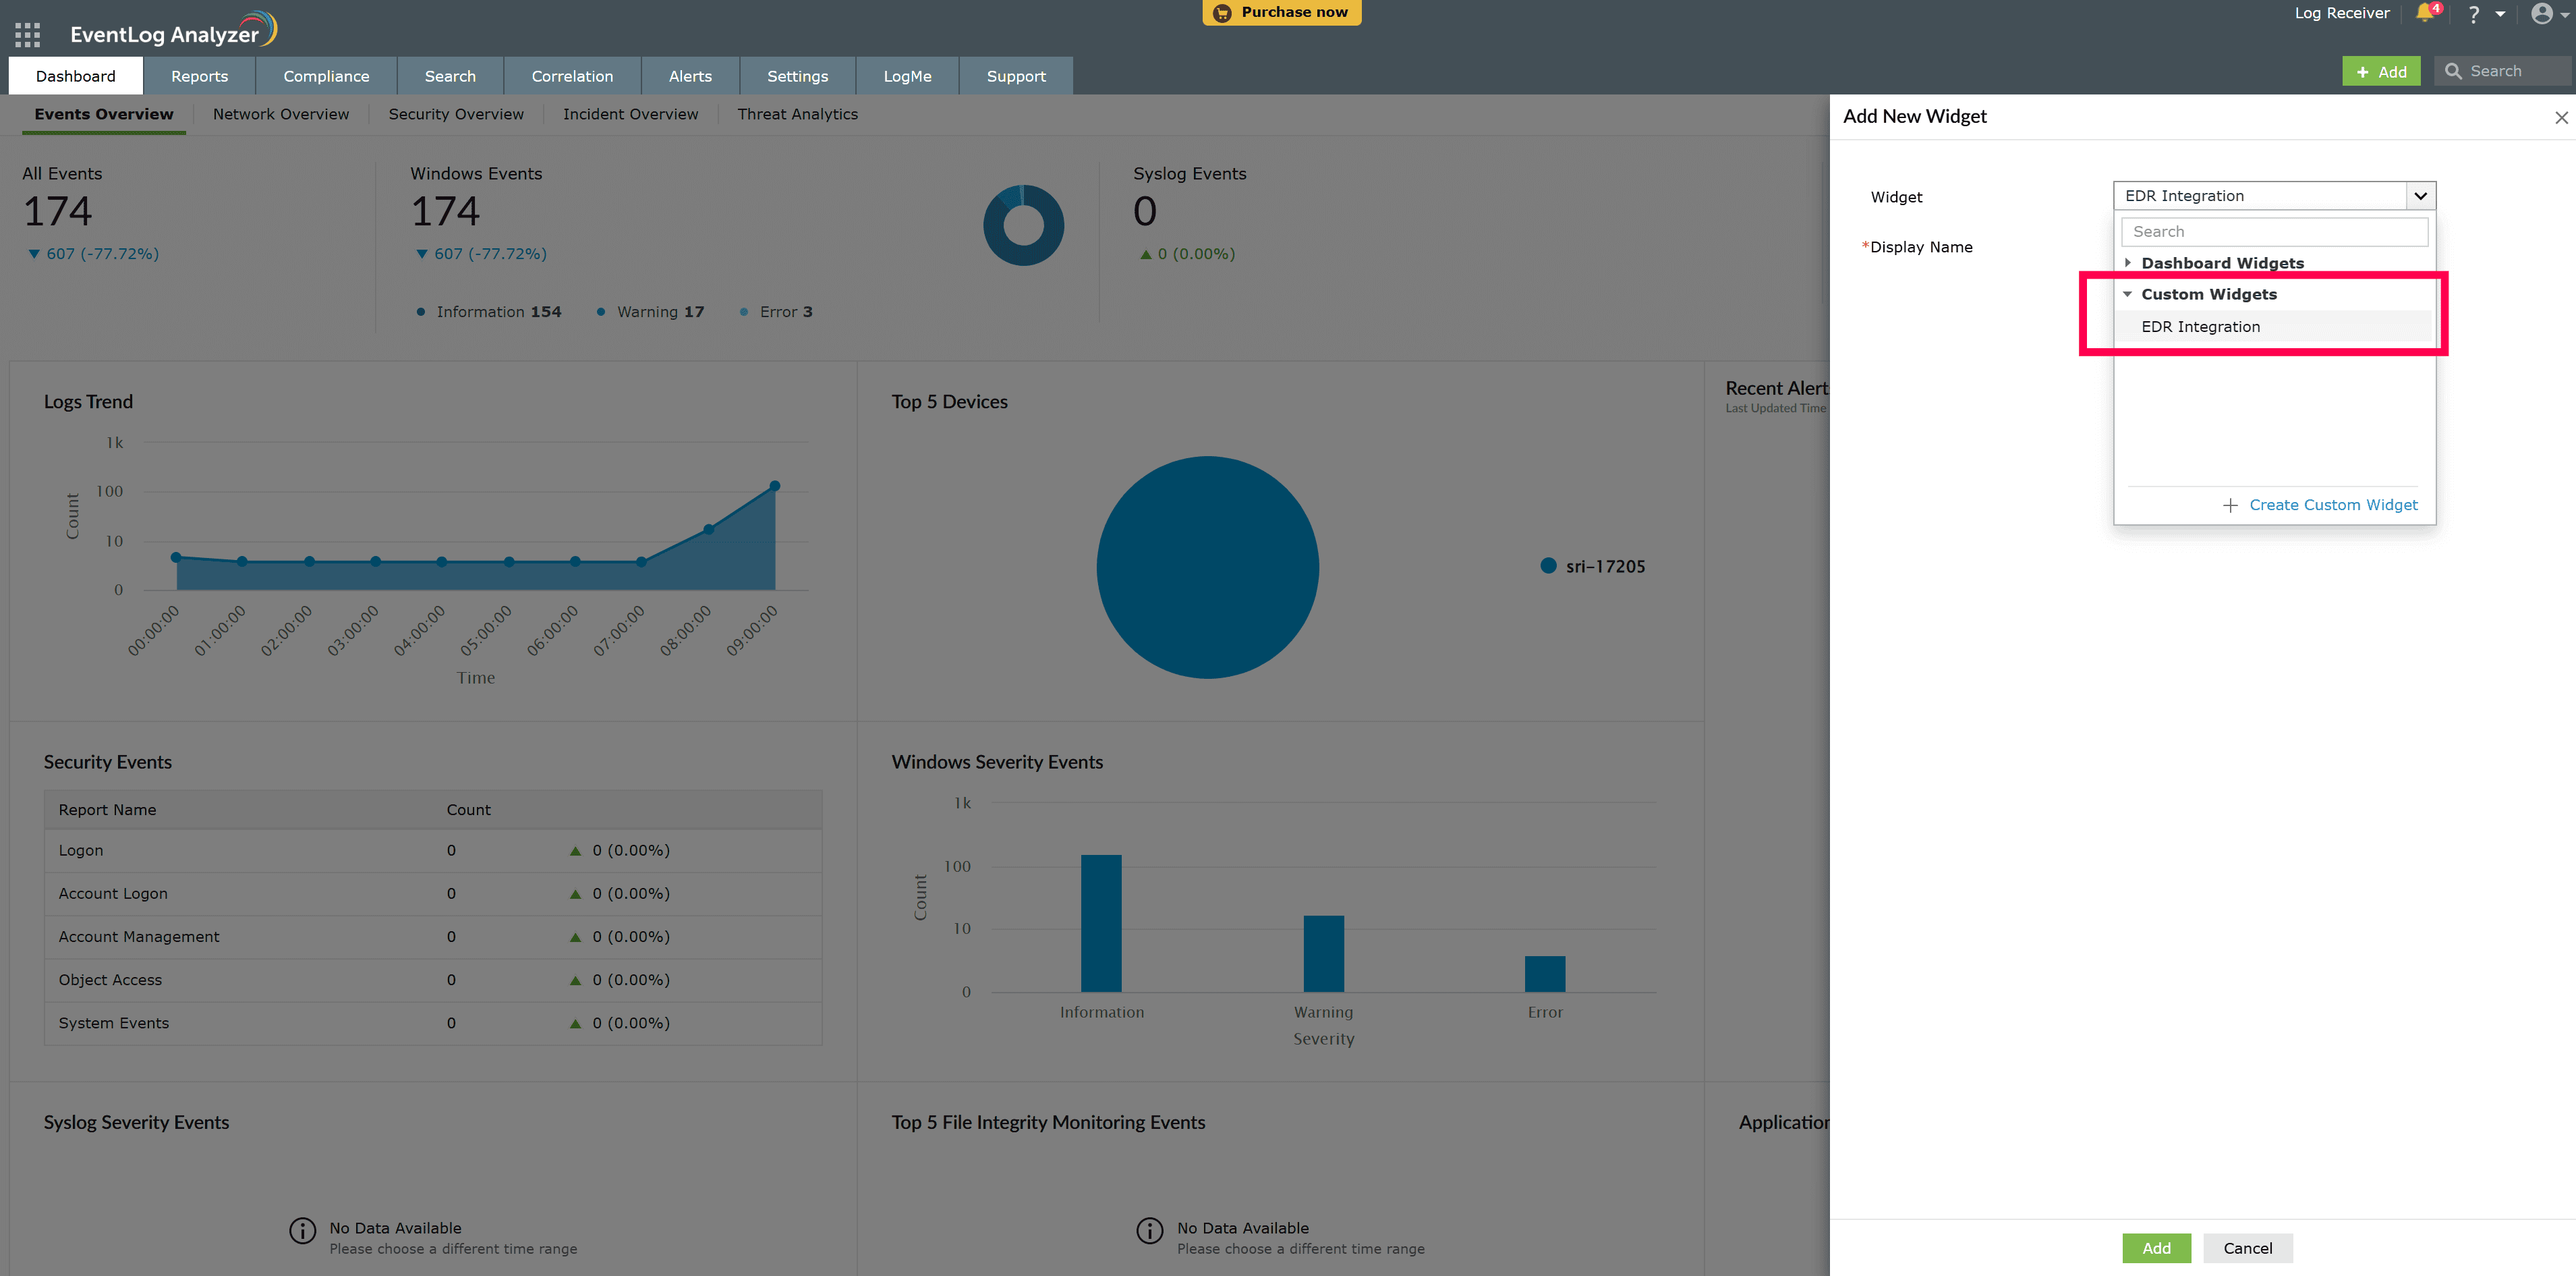
Select the custom widget that you want to add to the dashboard, and then click Add.
A widget can be added as a custom report in EventLog Analyzer. After creating the custom widget under Settings → Admin → Developer Space → Custom Widgets, you can add it as a custom report by navigating to Reports → Manage Custom Reports → Add Report, and then selecting the Report Type as Custom Widget.
Note: Only users with access to view or create reports in custom reports can view custom widgets.
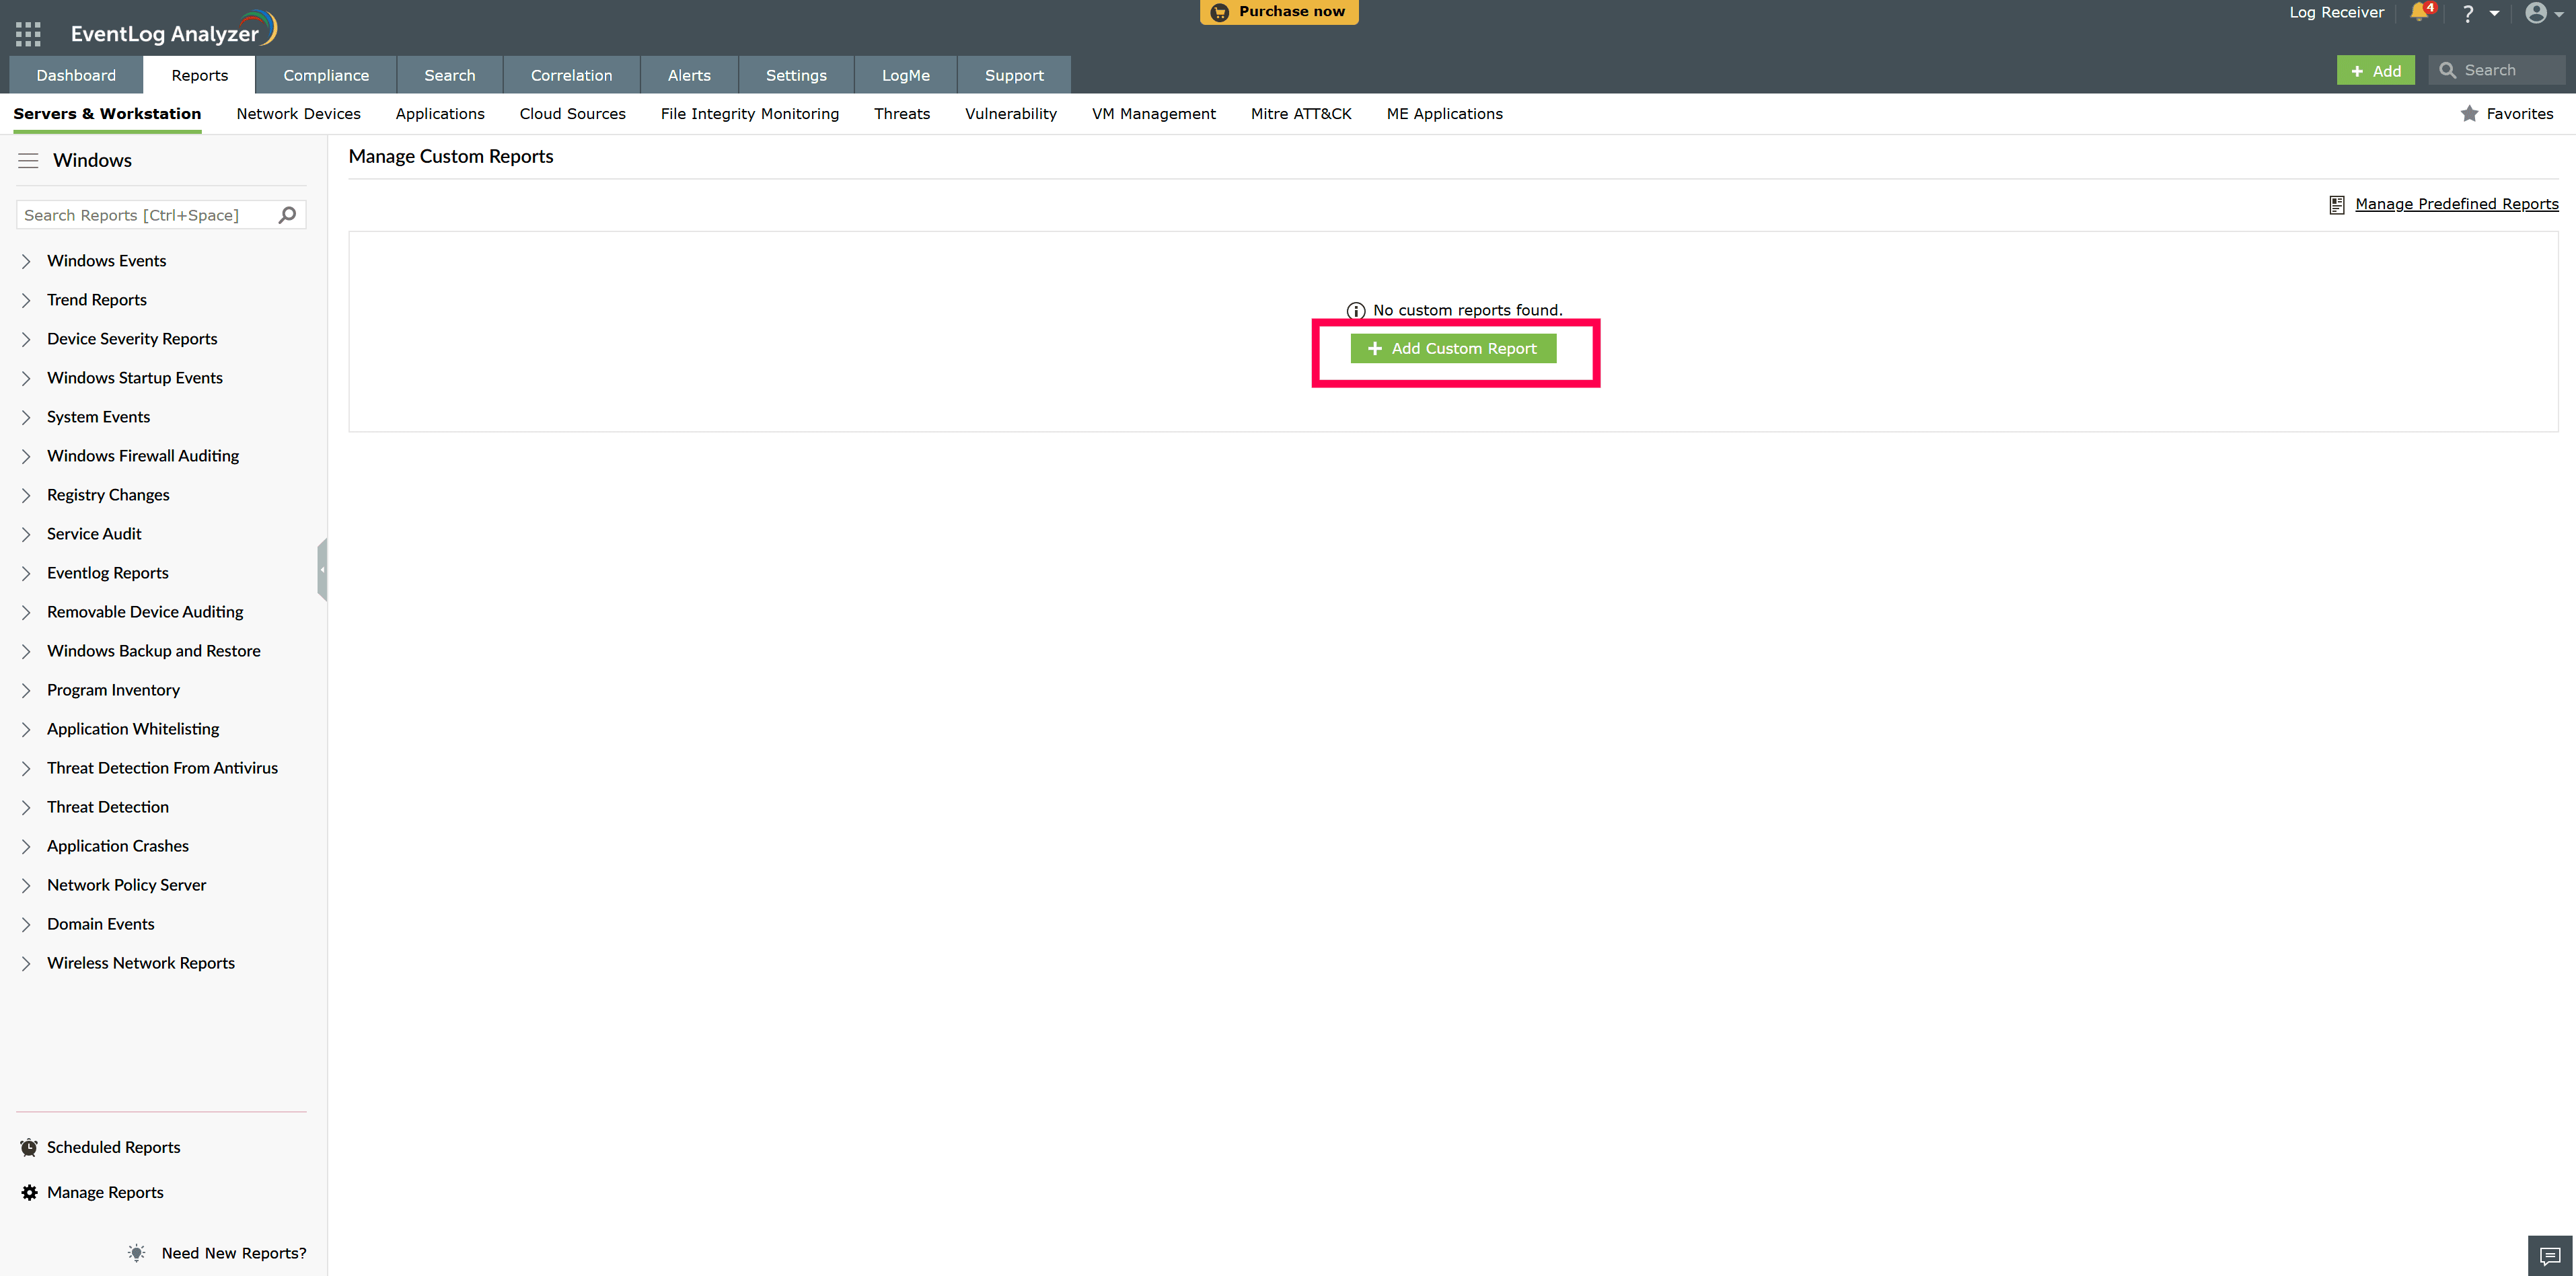
Click the Add Custom Report button.
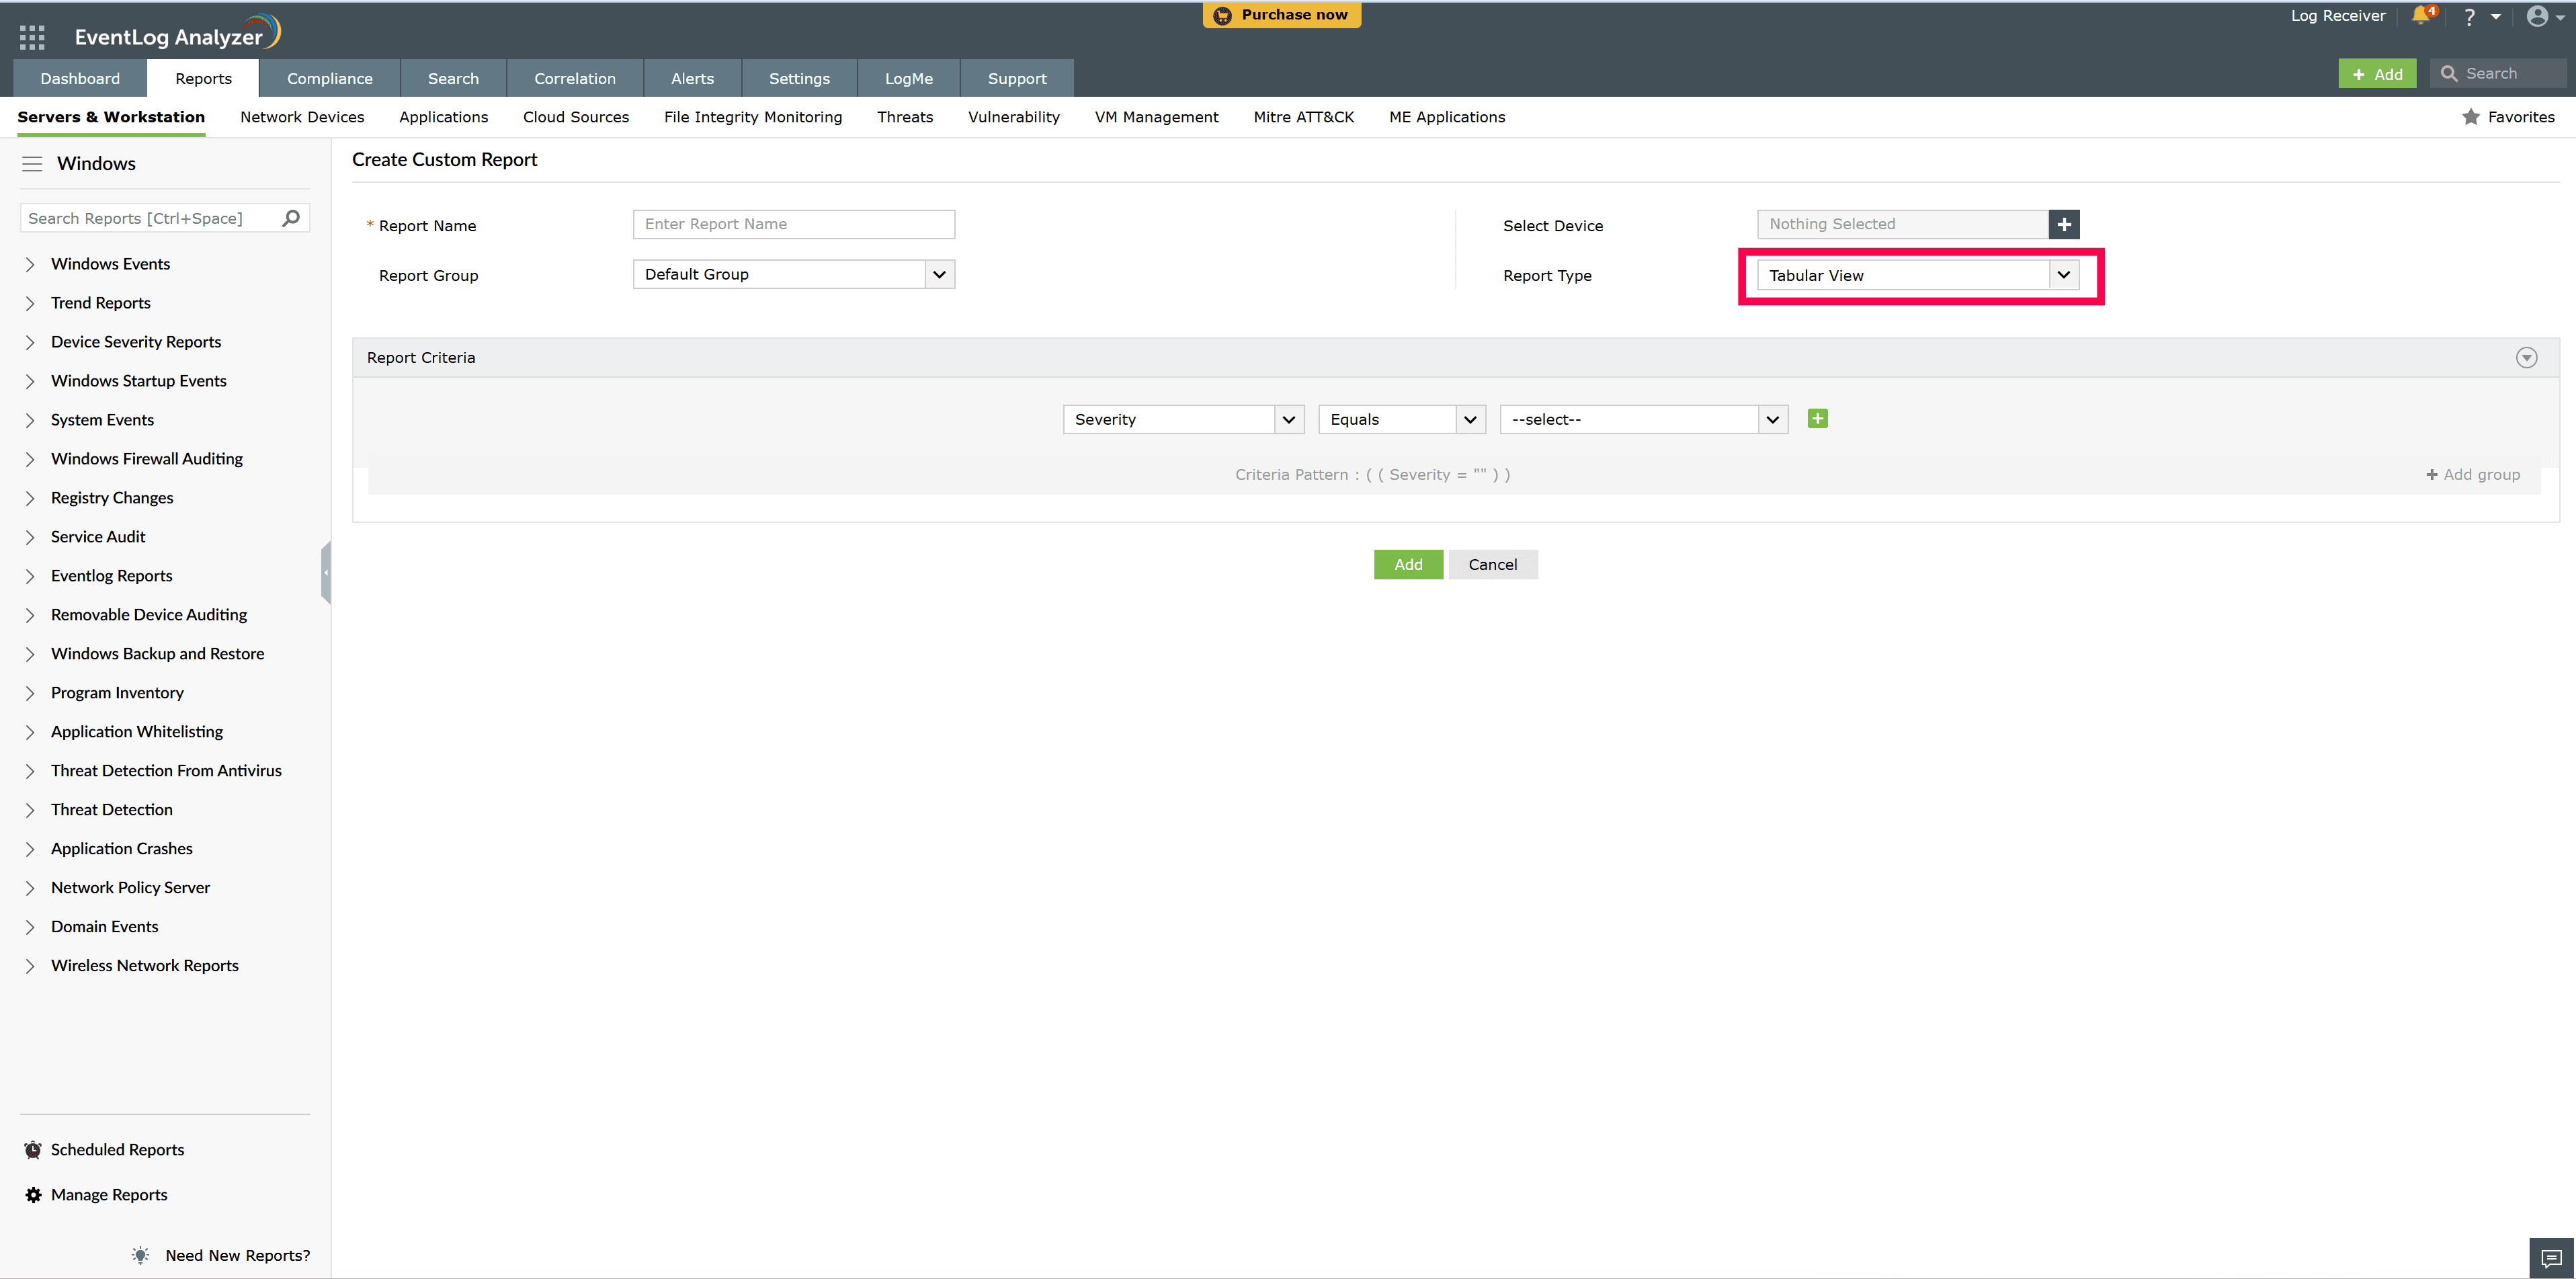
Click the Report type dropdown.
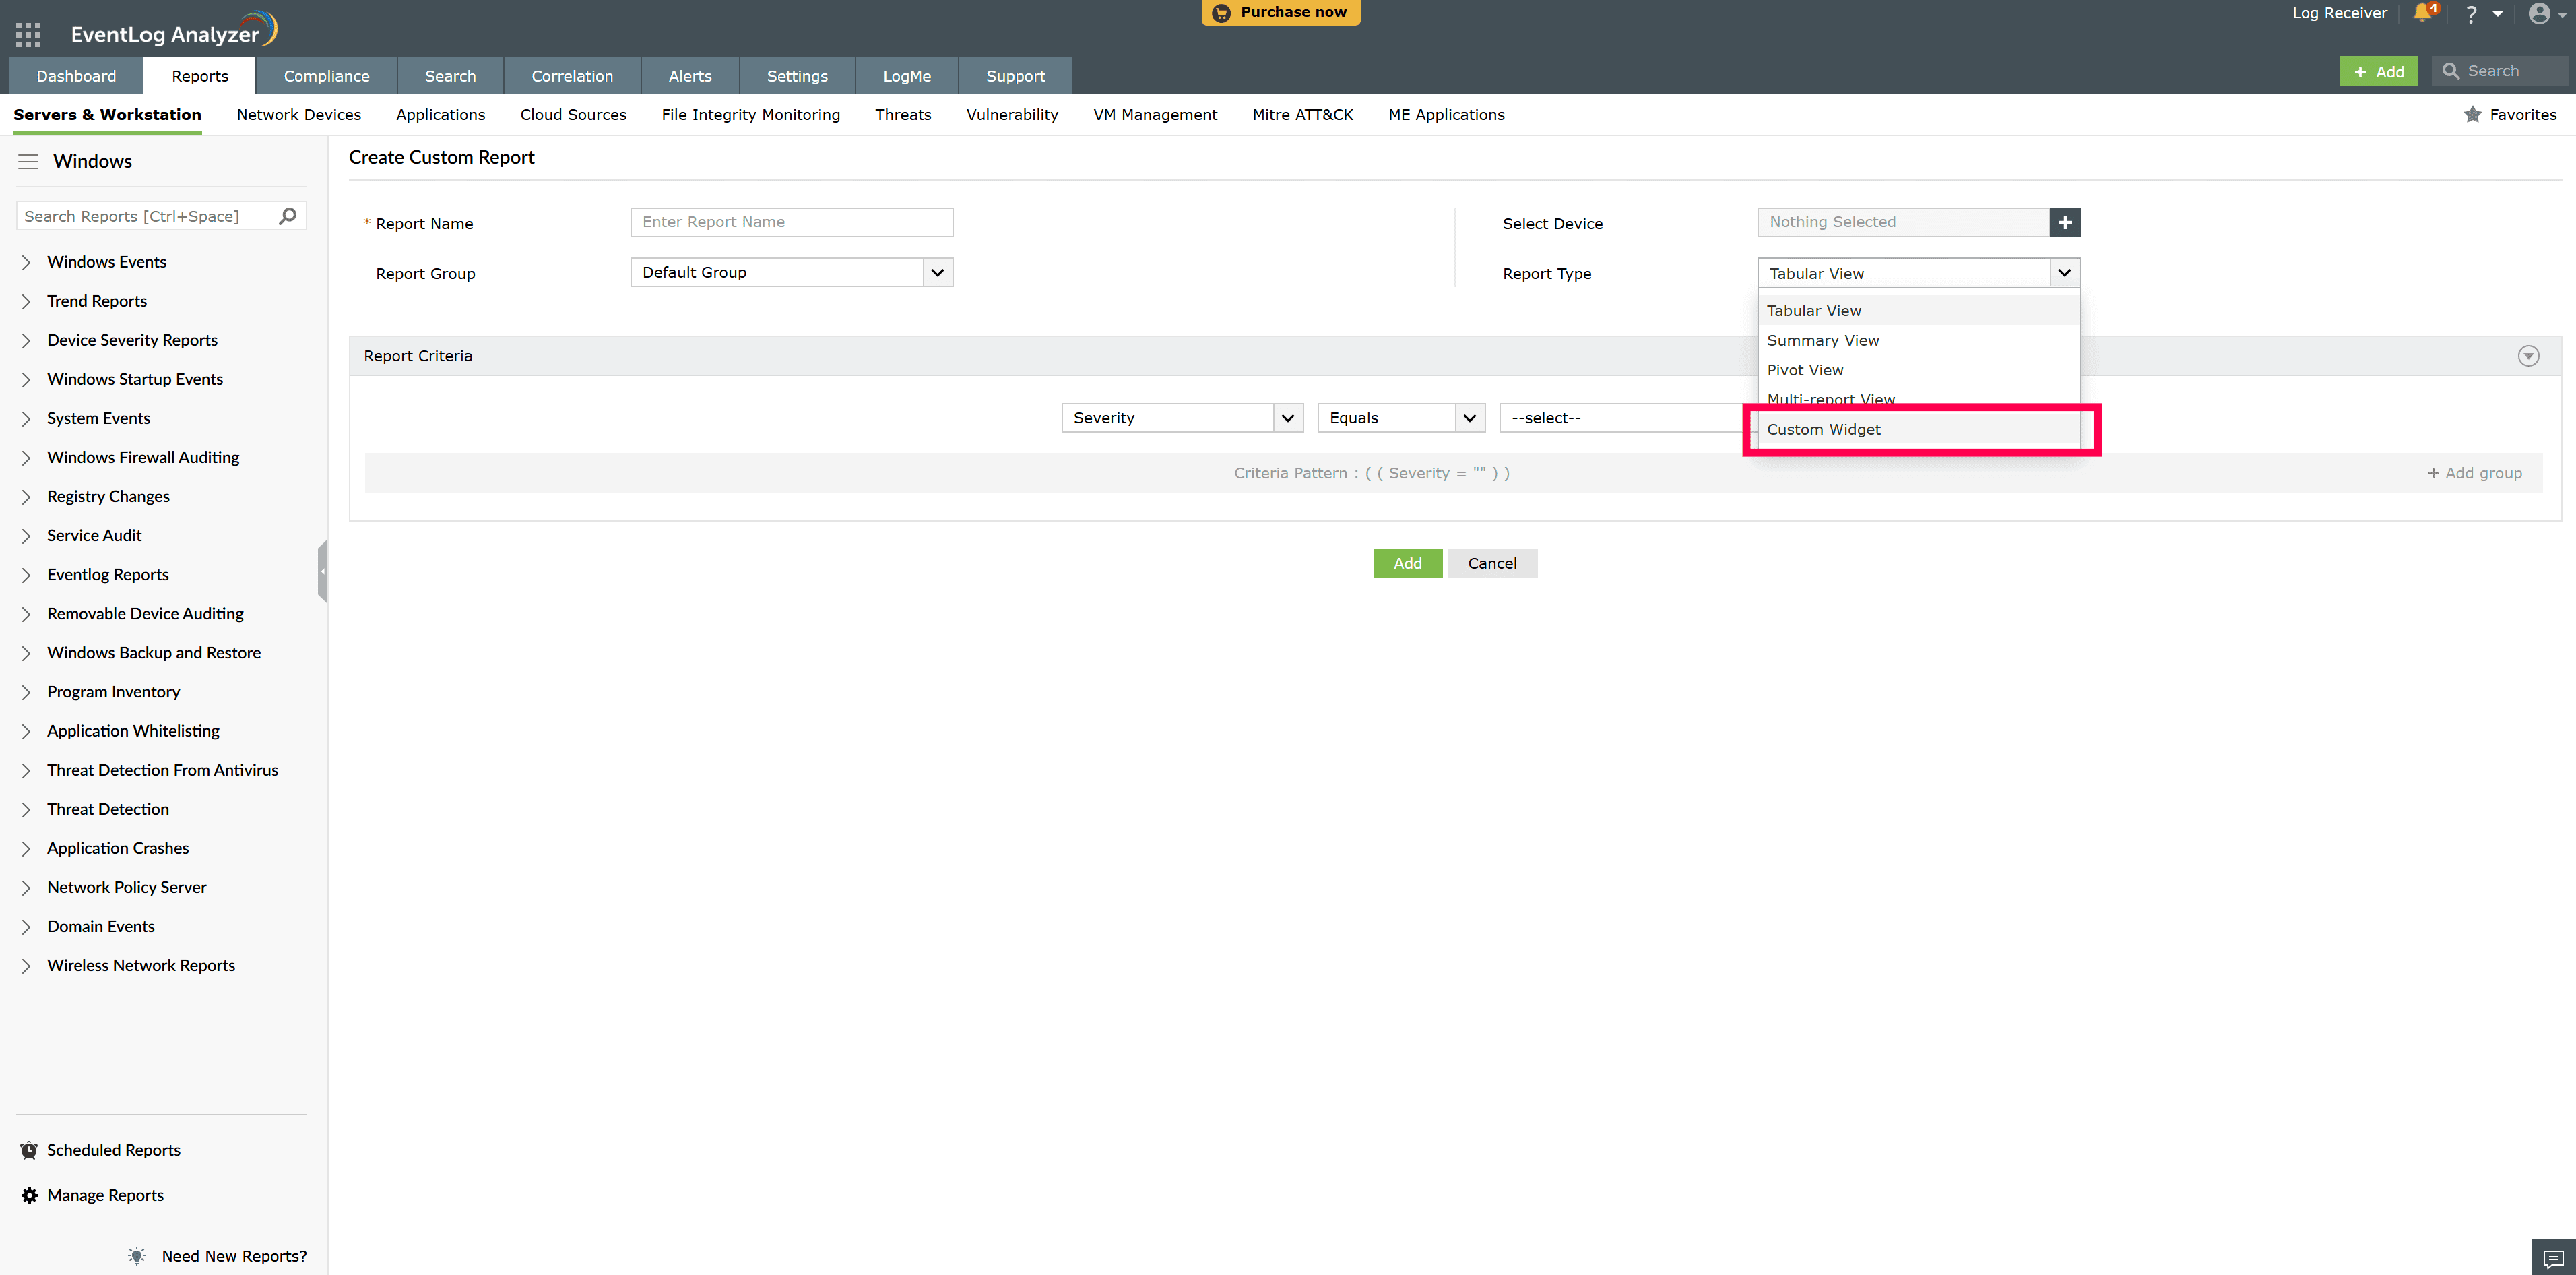
In the Report Type dropdown, select Custom Widget.
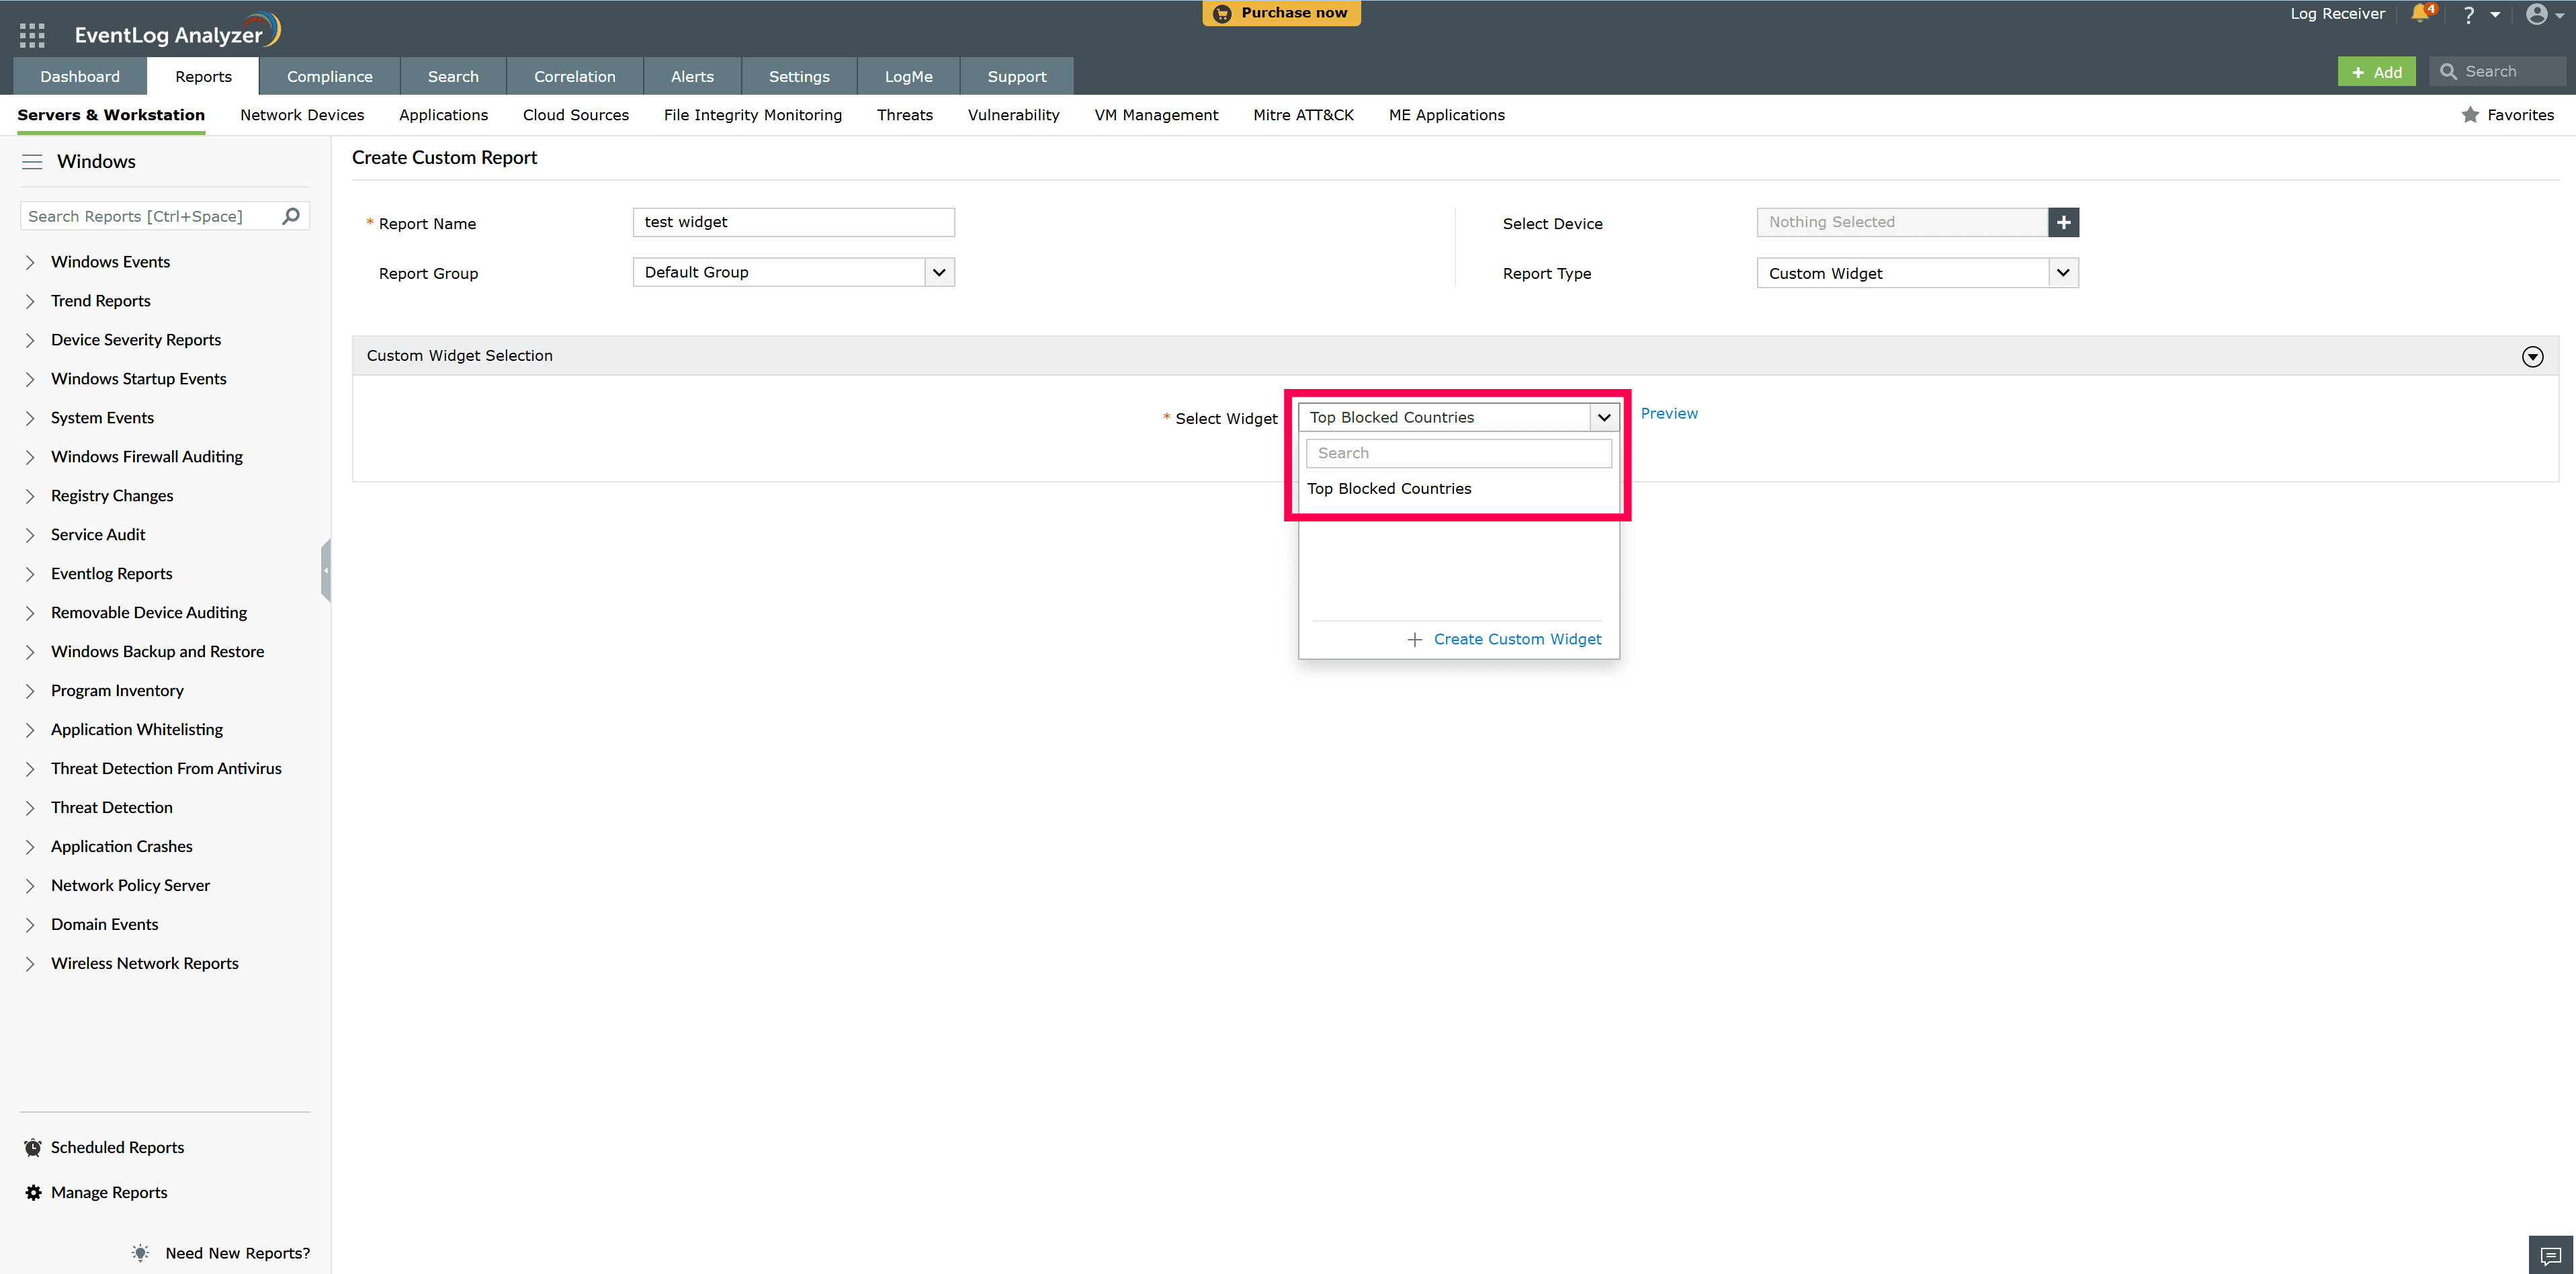
Under Custom Widgets, select the desired custom widget.
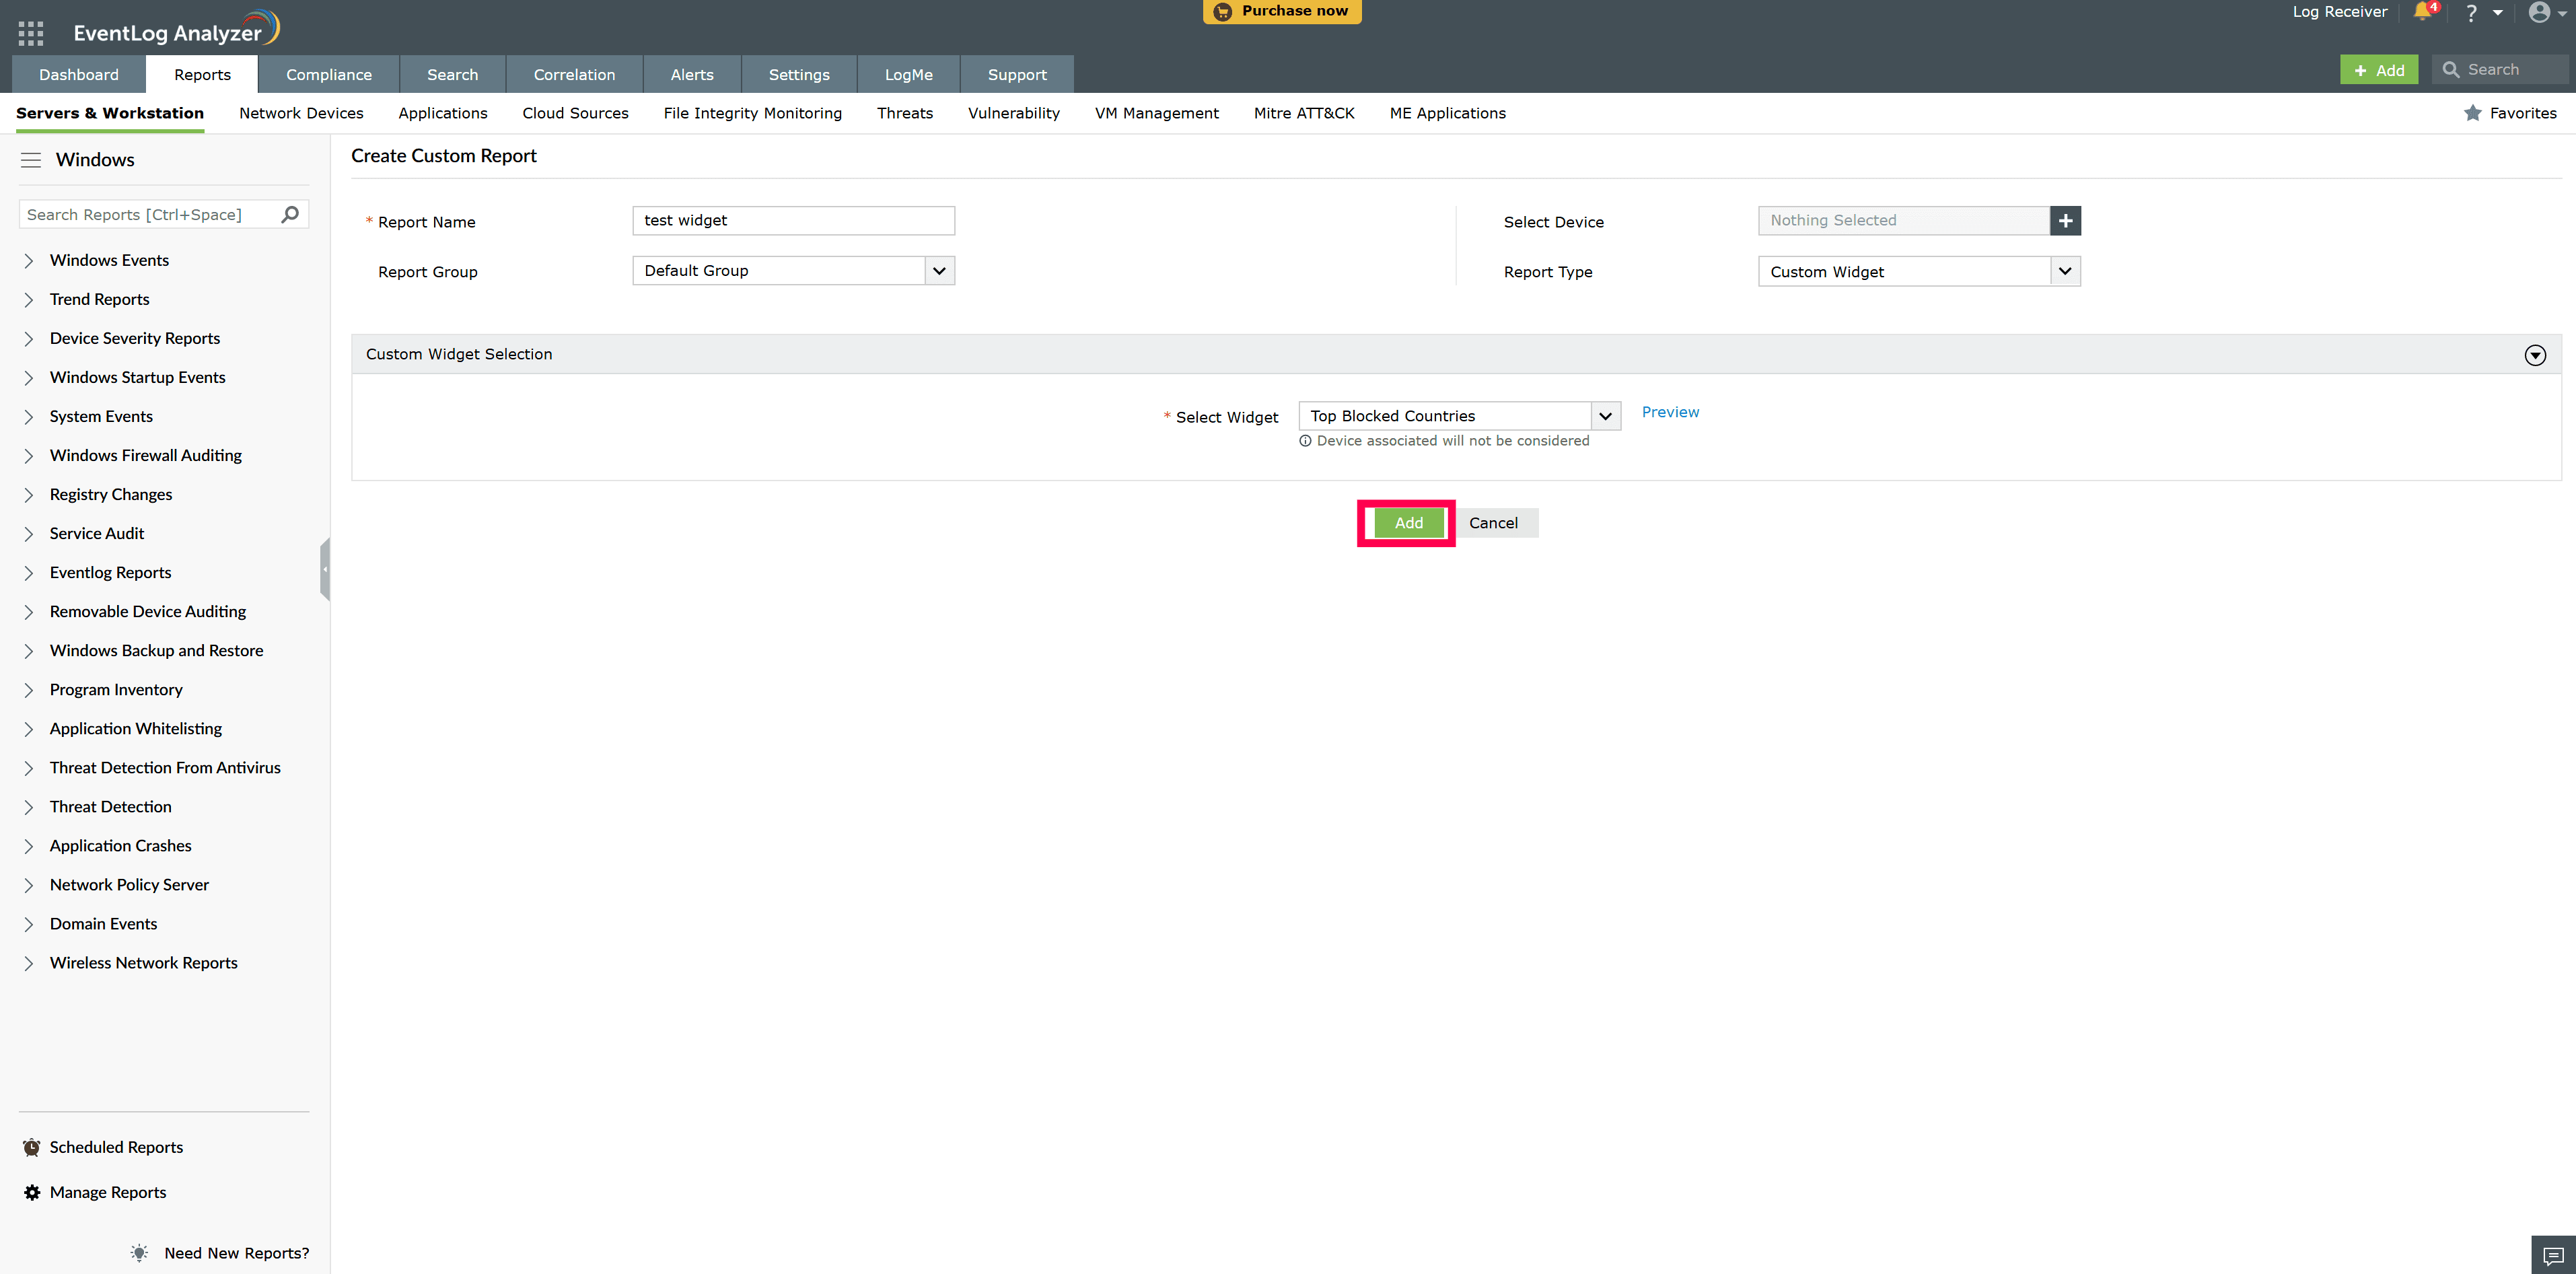
Then, click Add to create the custom report with the custom widget.
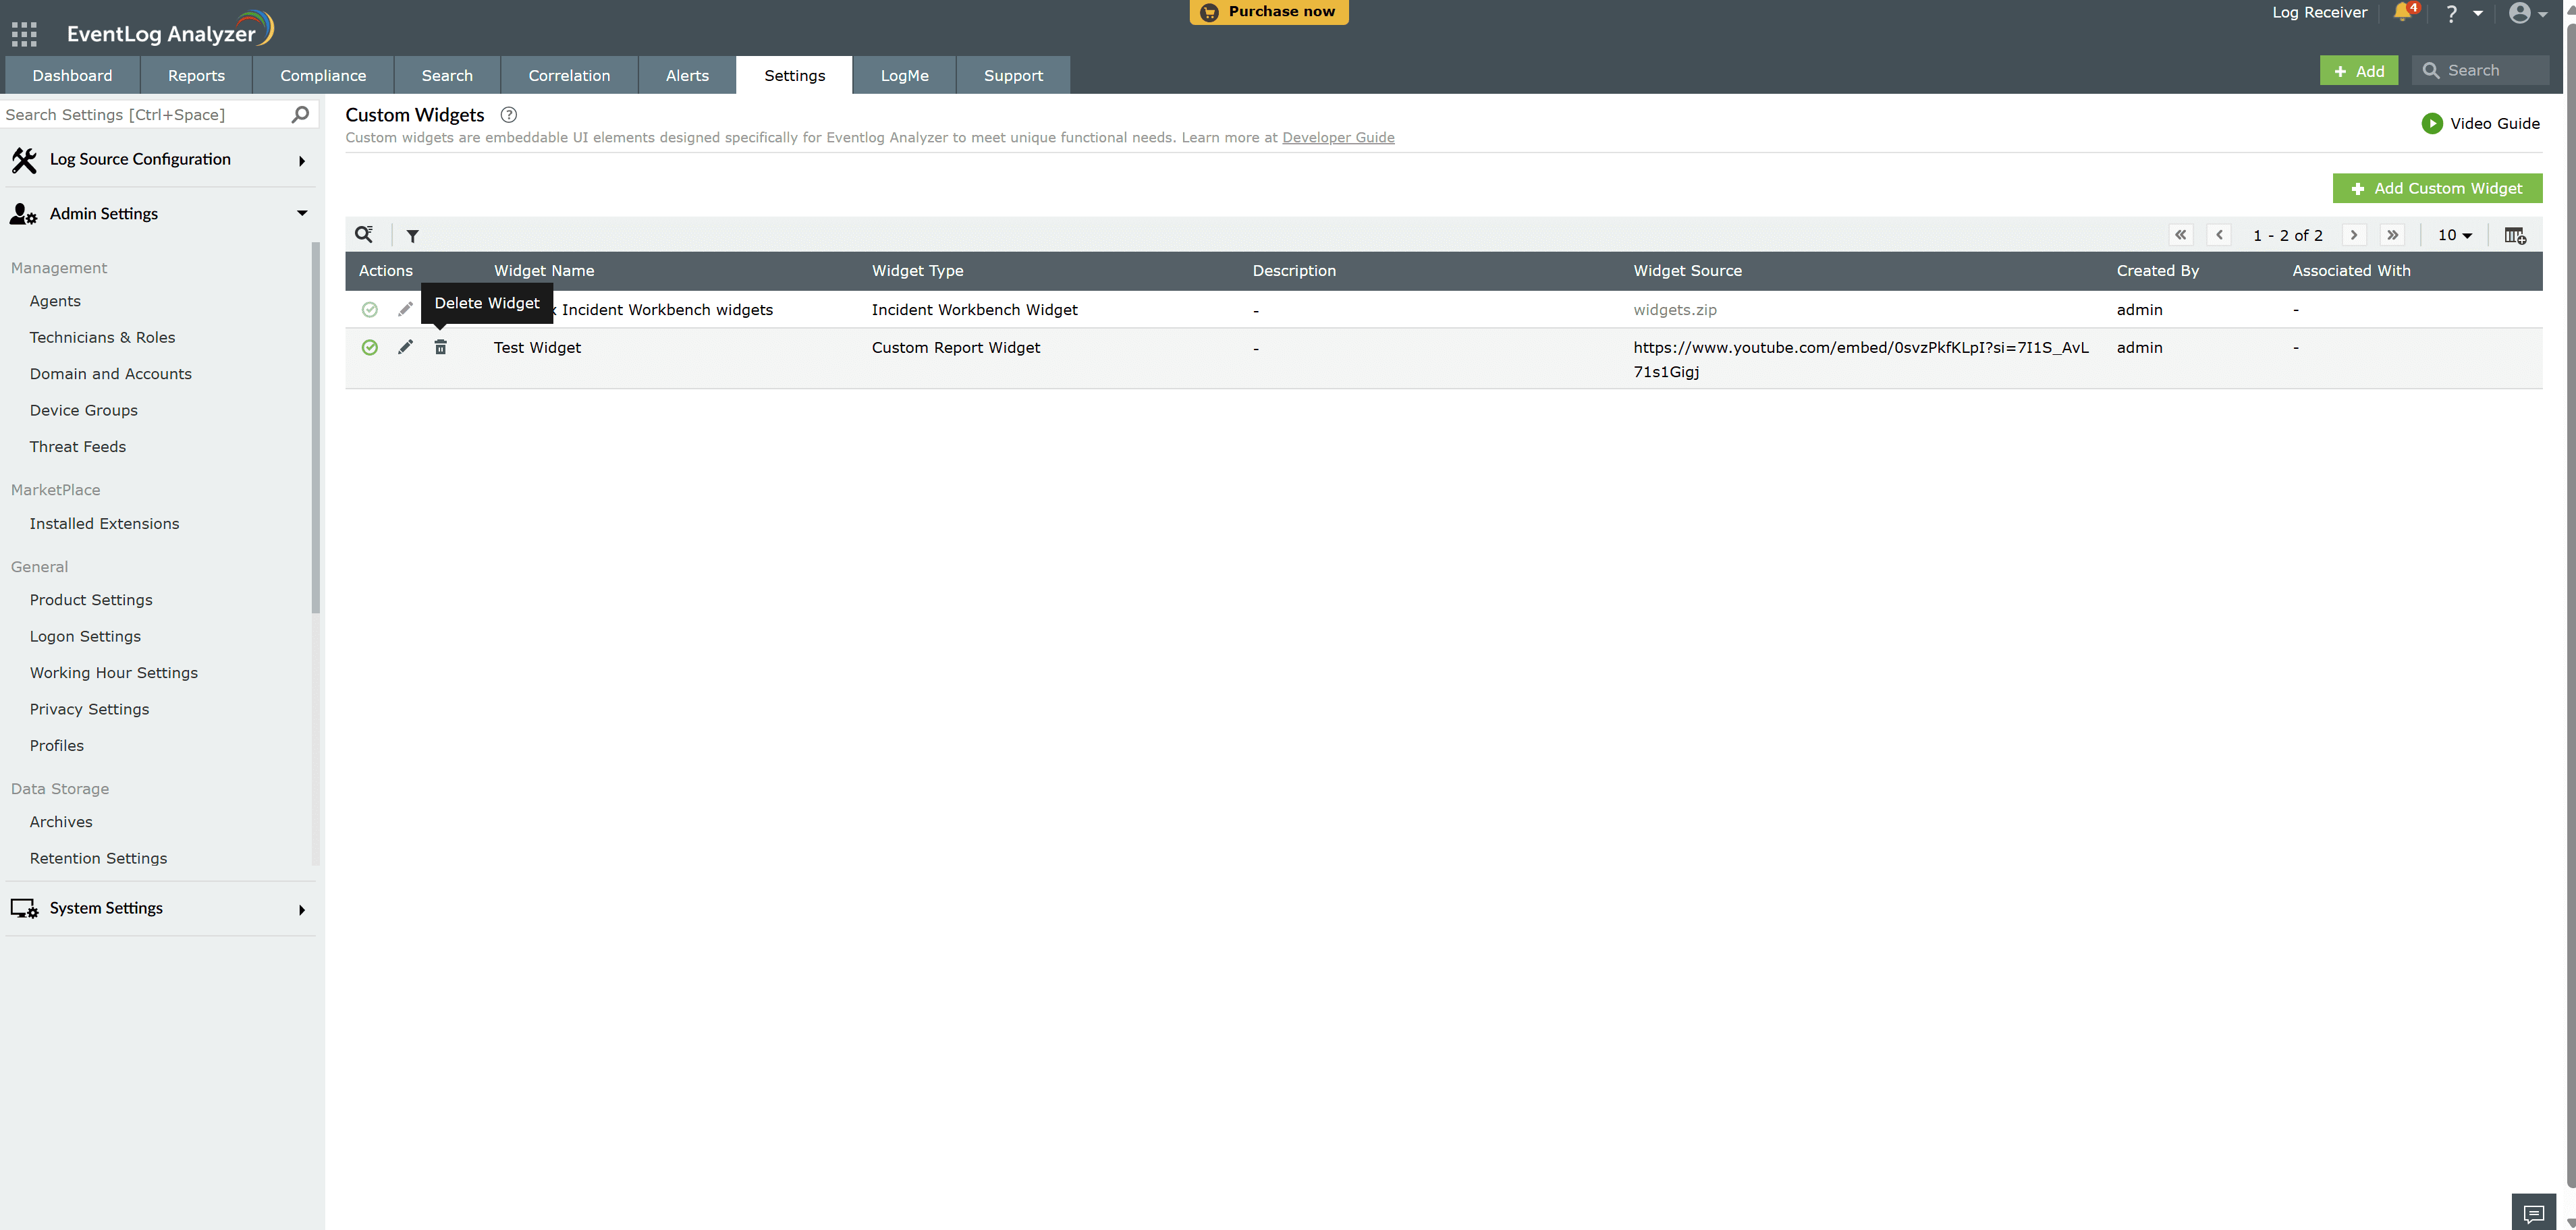
A widget can be added to the Incident Workbench in EventLog Analyzer. This can be done directly from the Custom Widgets tab in the Settings, allowing you to integrate the custom widget seamlessly into the Incident Workbench.
Note: Only users with access to view incident workbench can view custom widgets.
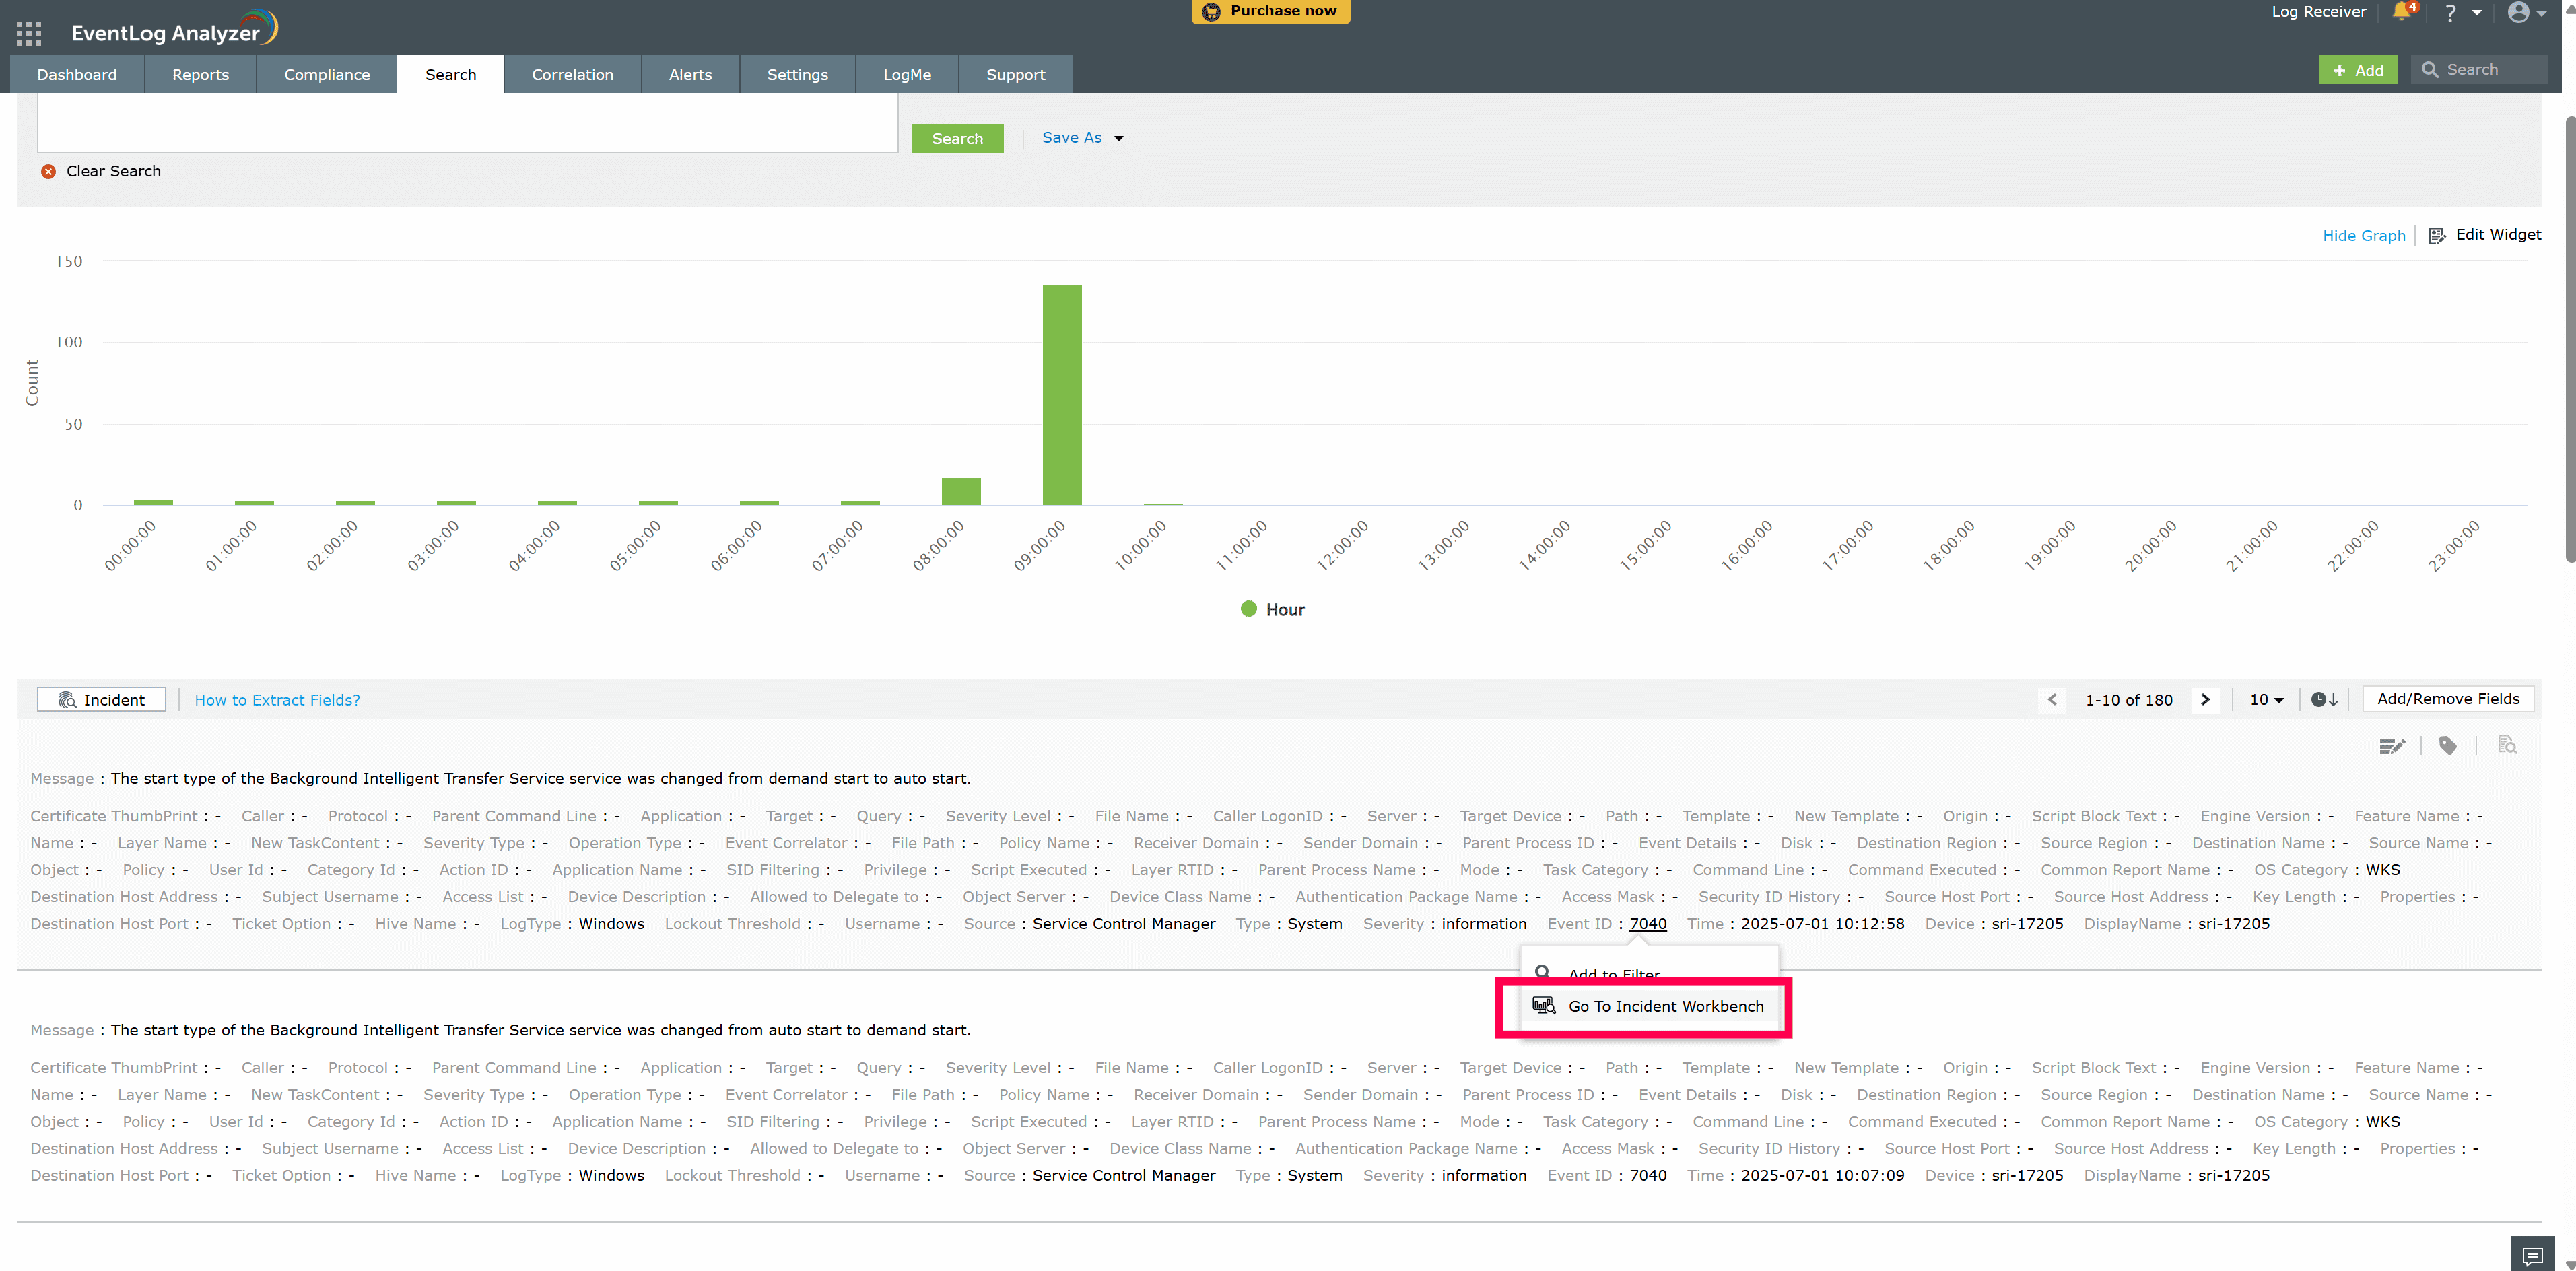
Select the field you need to analyze, then click Go to Incident Workbench.
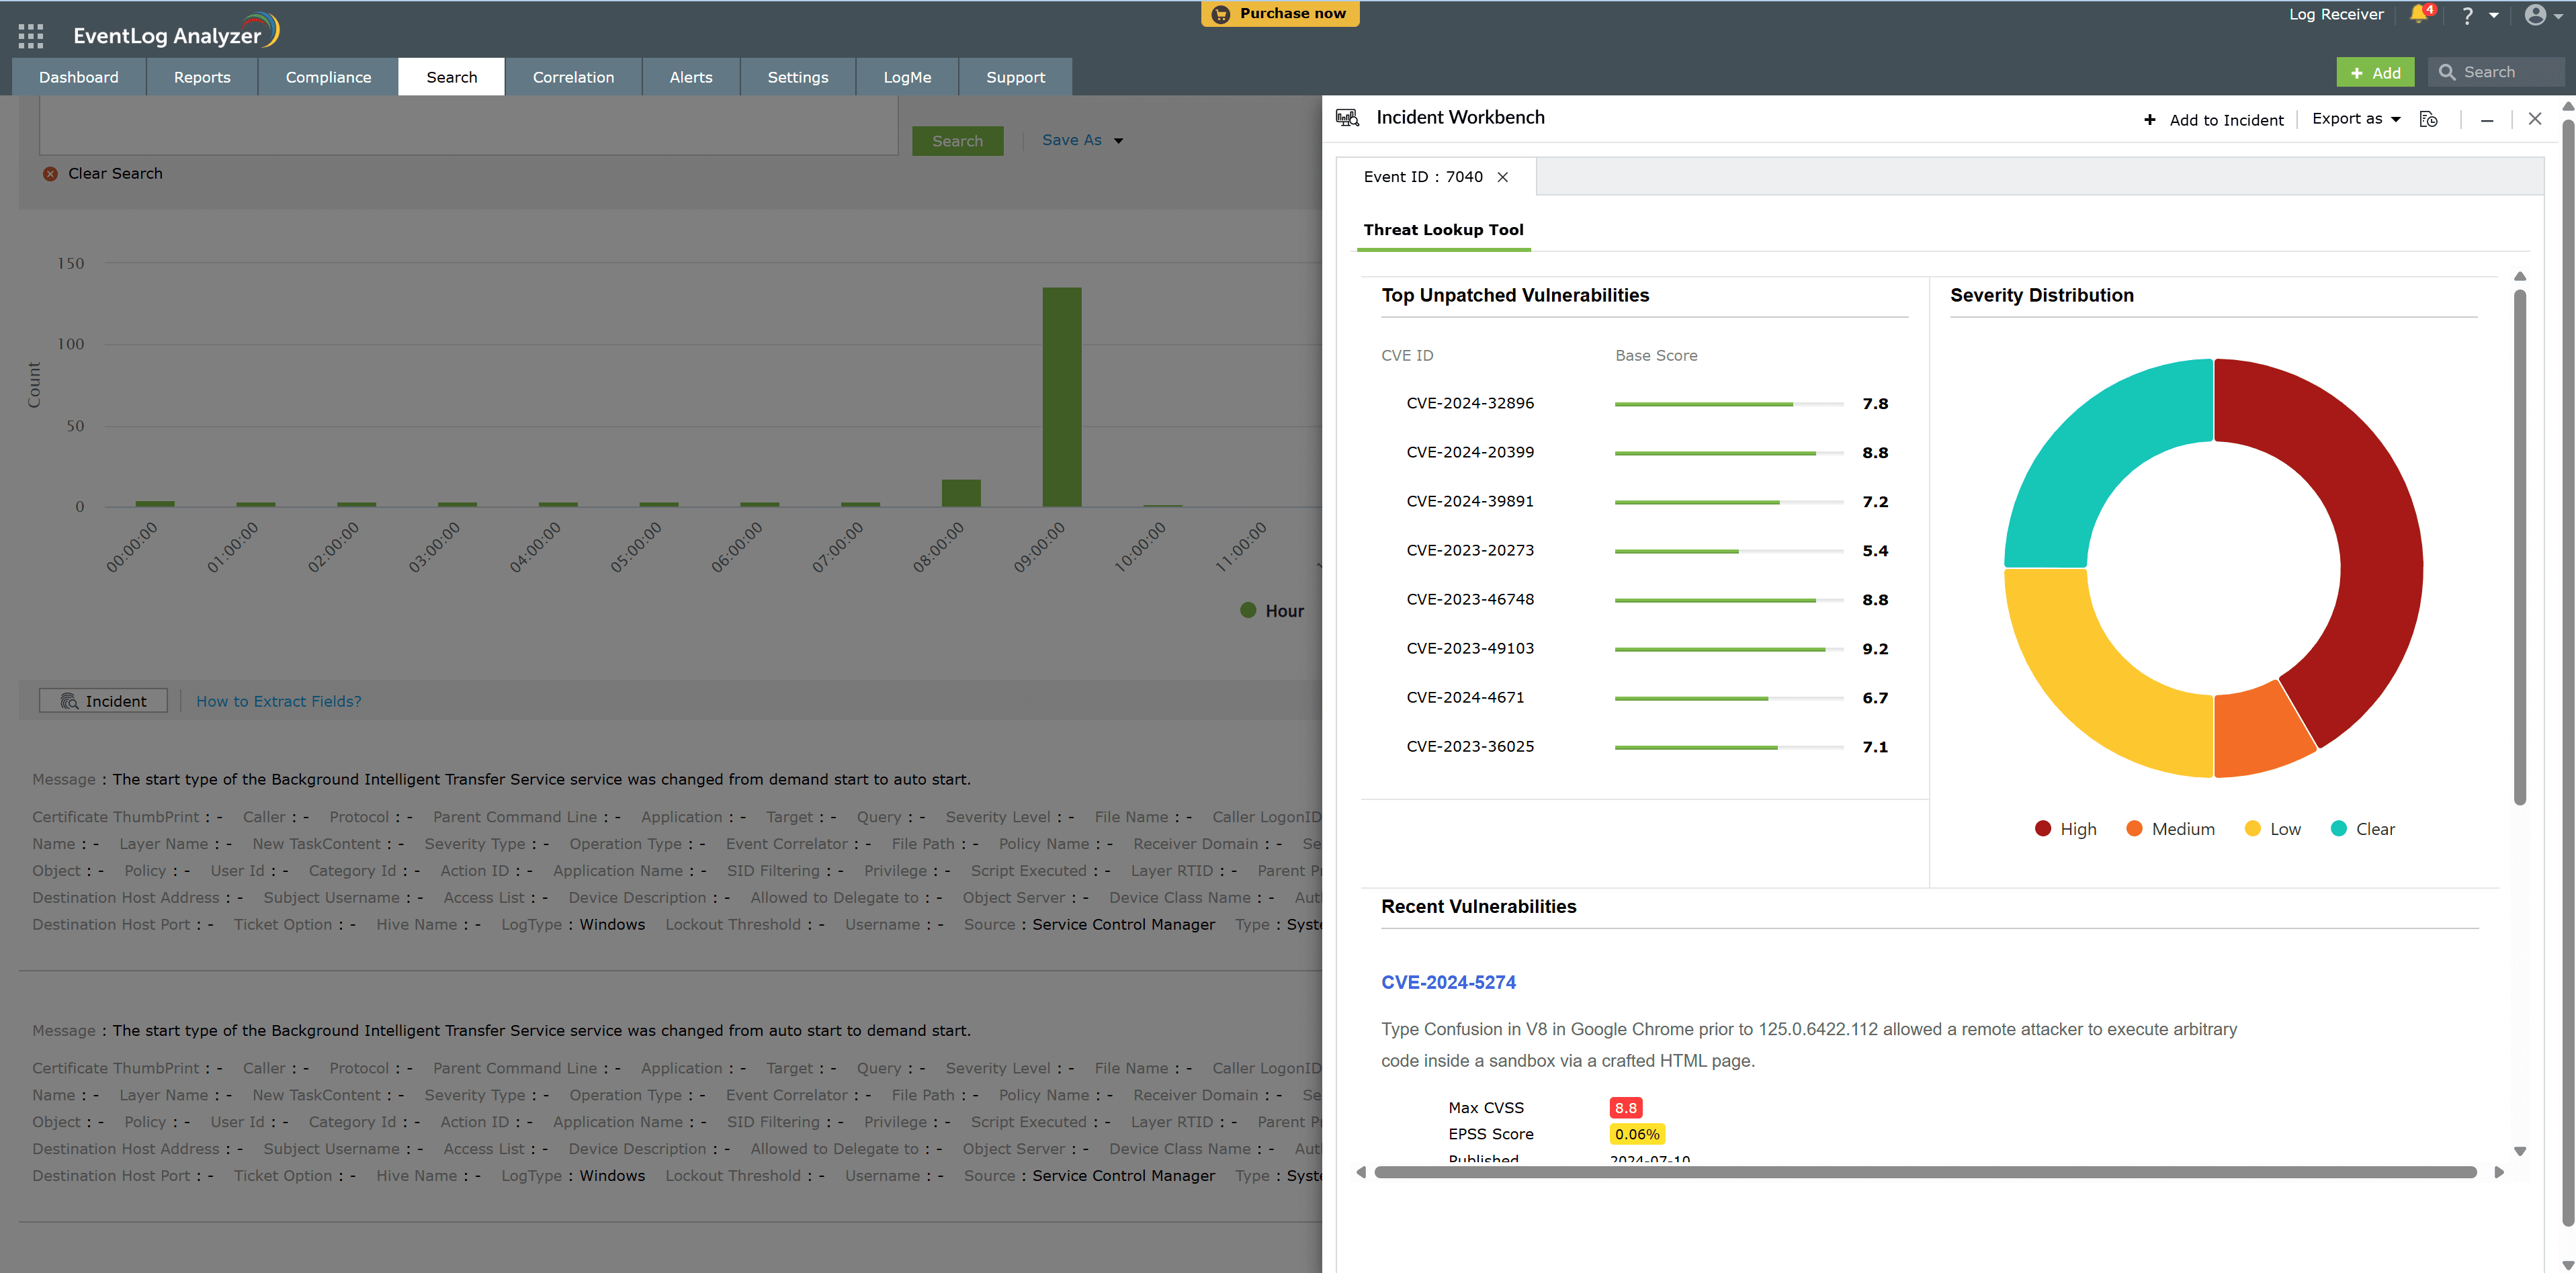
The available widgets for the selected fields, including any custom widgets, are displayed in tabs.
A custom widget can be added to EventLog Analyzer using the Zoho Extension Toolkit (ZET).
ZET, or the Zoho Extension Toolkit, is a command-line interface (CLI) designed to help developers build and package custom widgets for ManageEngine EventLog Analyzer.
A CLI is a text-based interface that allows users to interact with software by typing specific commands, receiving responses, and executing actions directly from the terminal or command prompt. While graphical user interfaces (GUIs) offer visual interaction, CLIs provide a simpler and more efficient way for developers to work, particularly when it comes to creating applications, managing software, or even building operating systems.
Here's how you can build custom widgets using ZET and package and integrate these widgets with ManageEngine EventLog Analyzer for enhanced functionality.
Prerequisites
Check Node.js version
node -v
This will return the installed version of Node.js, e.g., v14.18.1.
Check npm version
npm -v
This will return the installed version of npm, e.g., 6.14.12.
If both commands return a version number, it means Node.js and npm have been successfully installed.
To install the Zoho Extension Toolkit (ZET) CLI, follow these steps:
Run the following command to install the zapps CLI node package:
npm install -g zoho-extension-toolkit
Once installed, run the following command to ensure that the installation was successful:
$ zet //
If the installation is successful, help information related to the zet command will be displayed.
Creating a New Project Using ZET
Follow these steps to create a new project using the Zoho Extension Toolkit (ZET):
Initialize a New Project
Run the following command to create a new project:
zet init
This command will display a list of available Zoho and ManageEngine services. Select the Log360 Cloud service for which you want to create a project template.
Once the project is created and the local development server starts running, verify its status by opening one of the following URLs in your browser:
If these URLs load correctly, your project has been successfully created and the local server is running.
All necessary files required for rendering your custom widget are stored inside the "app" folder of your project.
To run your app locally and test it in your sandbox instance, start a local HTTPS server using the following command:
$ zet run
This will start the HTTPS server on your local machine at port 5000. Ensure that this port is not occupied by any other process before running the command.
Once the server starts, open the following URL in your web browser to check if it is running successfully:
https://127.0.0.1:5000/app/widget.html
If the page loads correctly, your widget is now running in a local environment and is ready for testing.
Before uploading your application, it is essential to validate and package it correctly. Follow these steps:
Run the following command to check for any issues in your app package:
$ zet validate
This will scan your application for any violations. If issues are detected, they must be resolved before proceeding with the upload.
Once validation is successful, generate an uploadable ZIP file by running:
$ zet pack
This will create a ZIP file inside the "dist" folder of your project directory. The packaged file can then be uploaded to EventLog Analyzer for deployment.
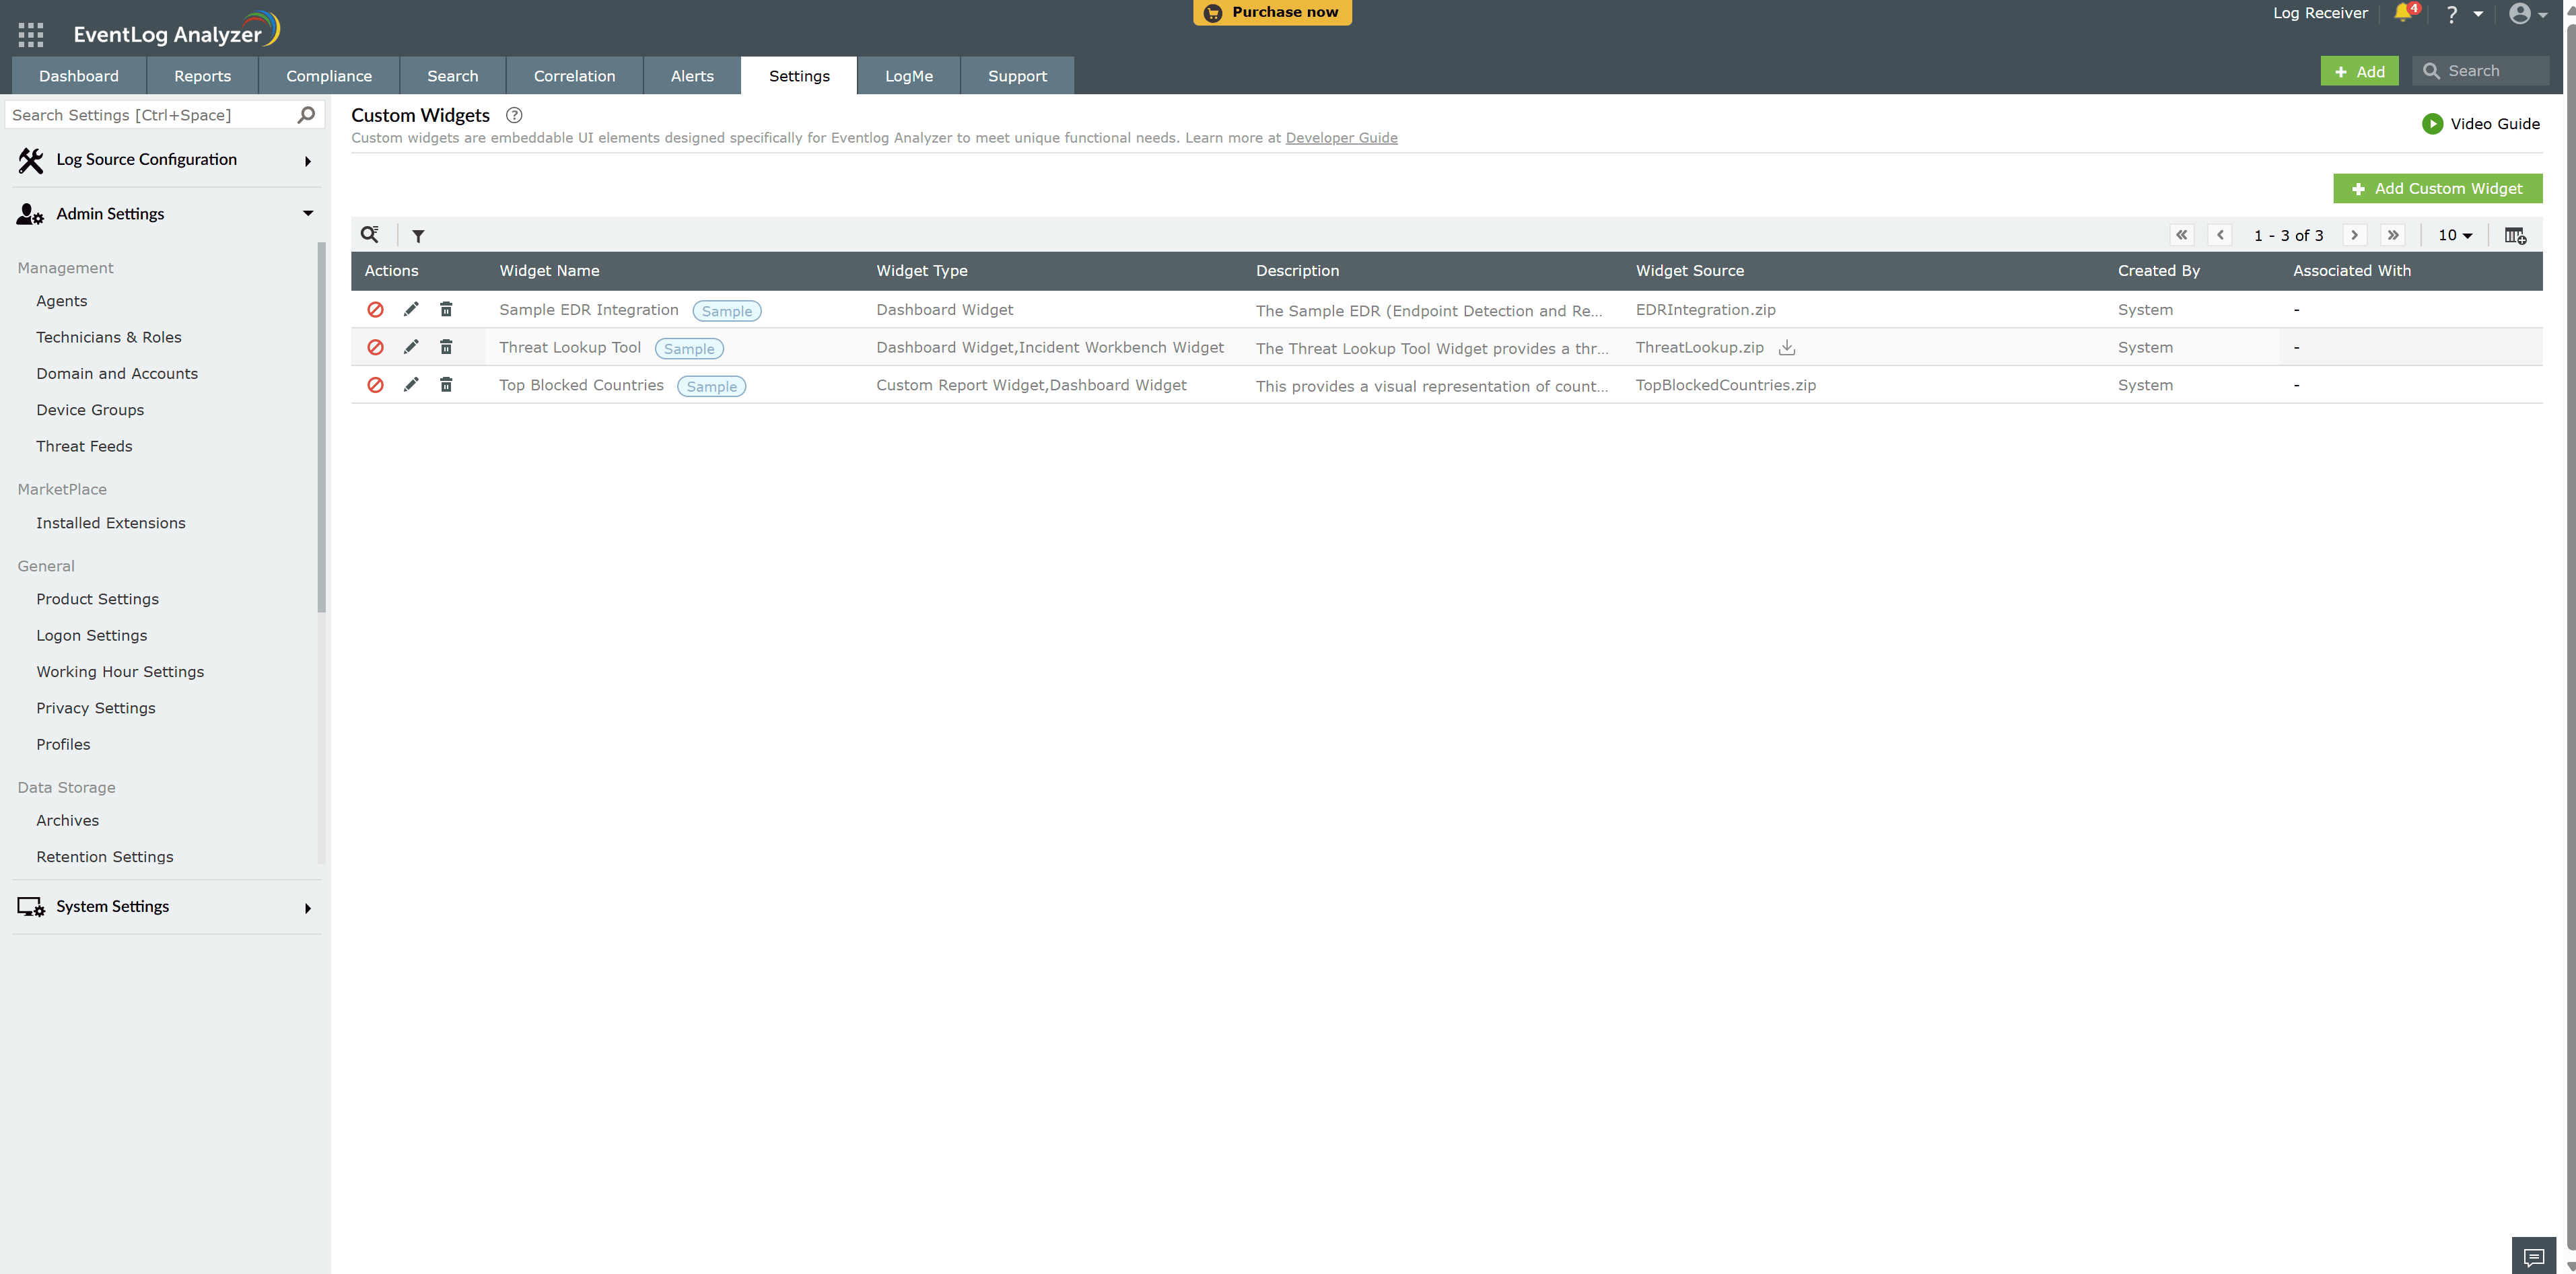
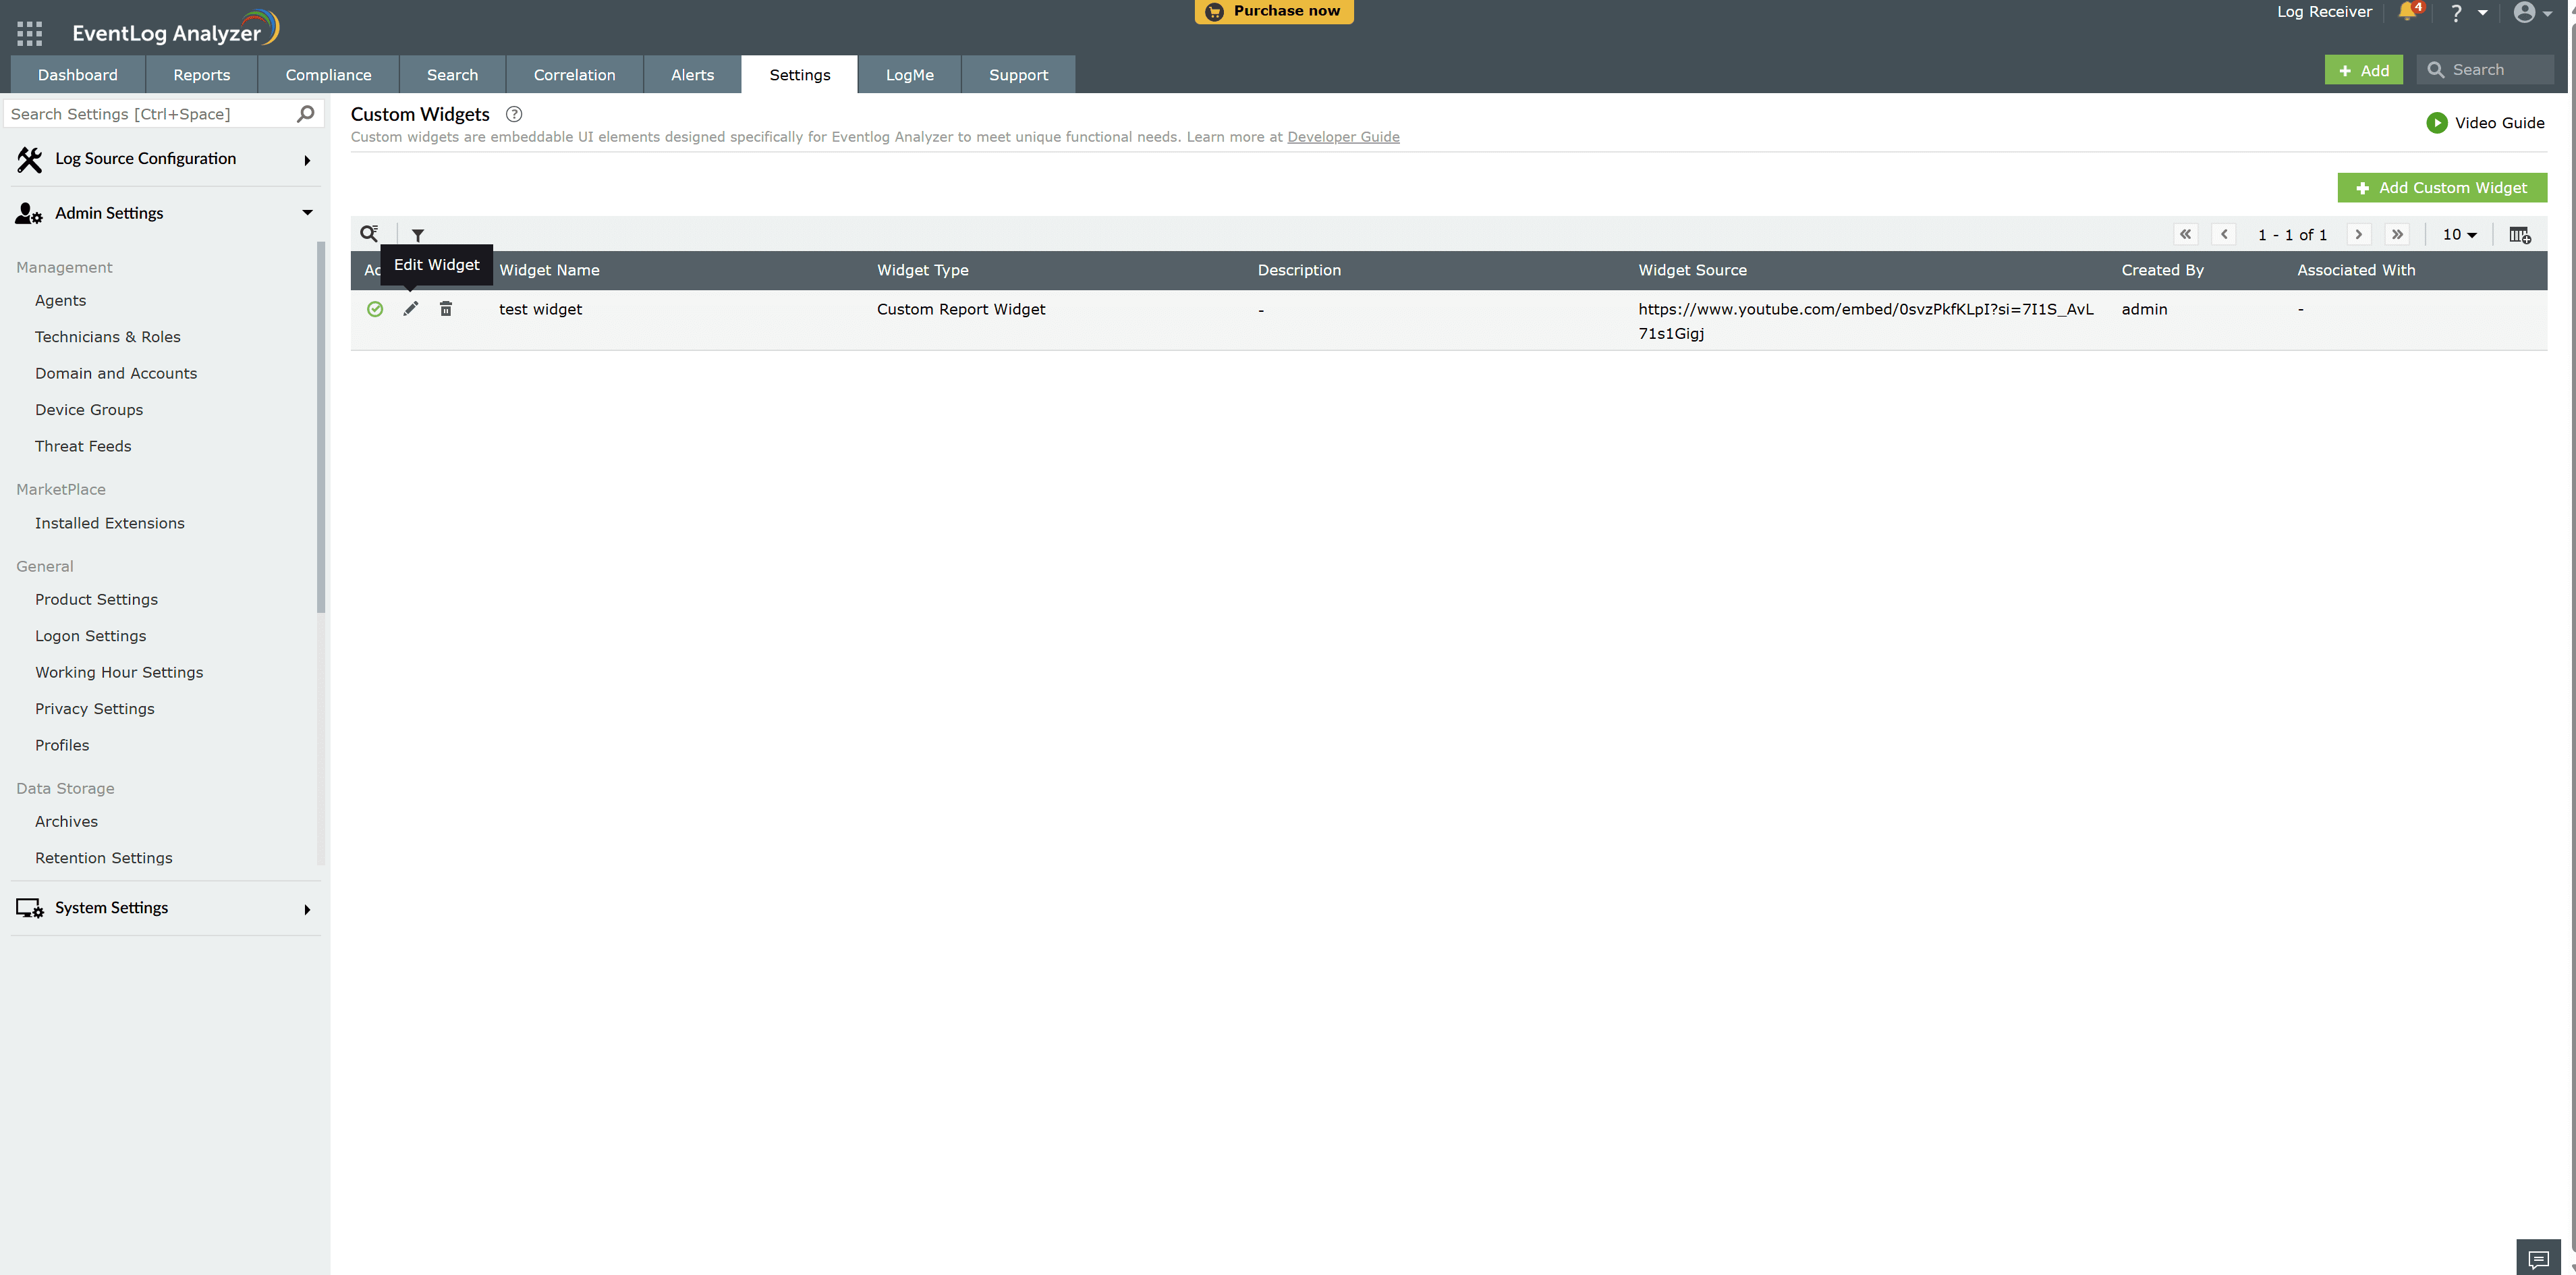
Follow these steps to add the custom widget to EventLog Analyzer:
Go to Settings → Developer Space → Custom Widgets in EventLog Analyzer.
The Sample Widgets section takes you to pre-created widgets within EventLog Analyzer.
To create a new widget, click on Create Custom Widget → Create Now.
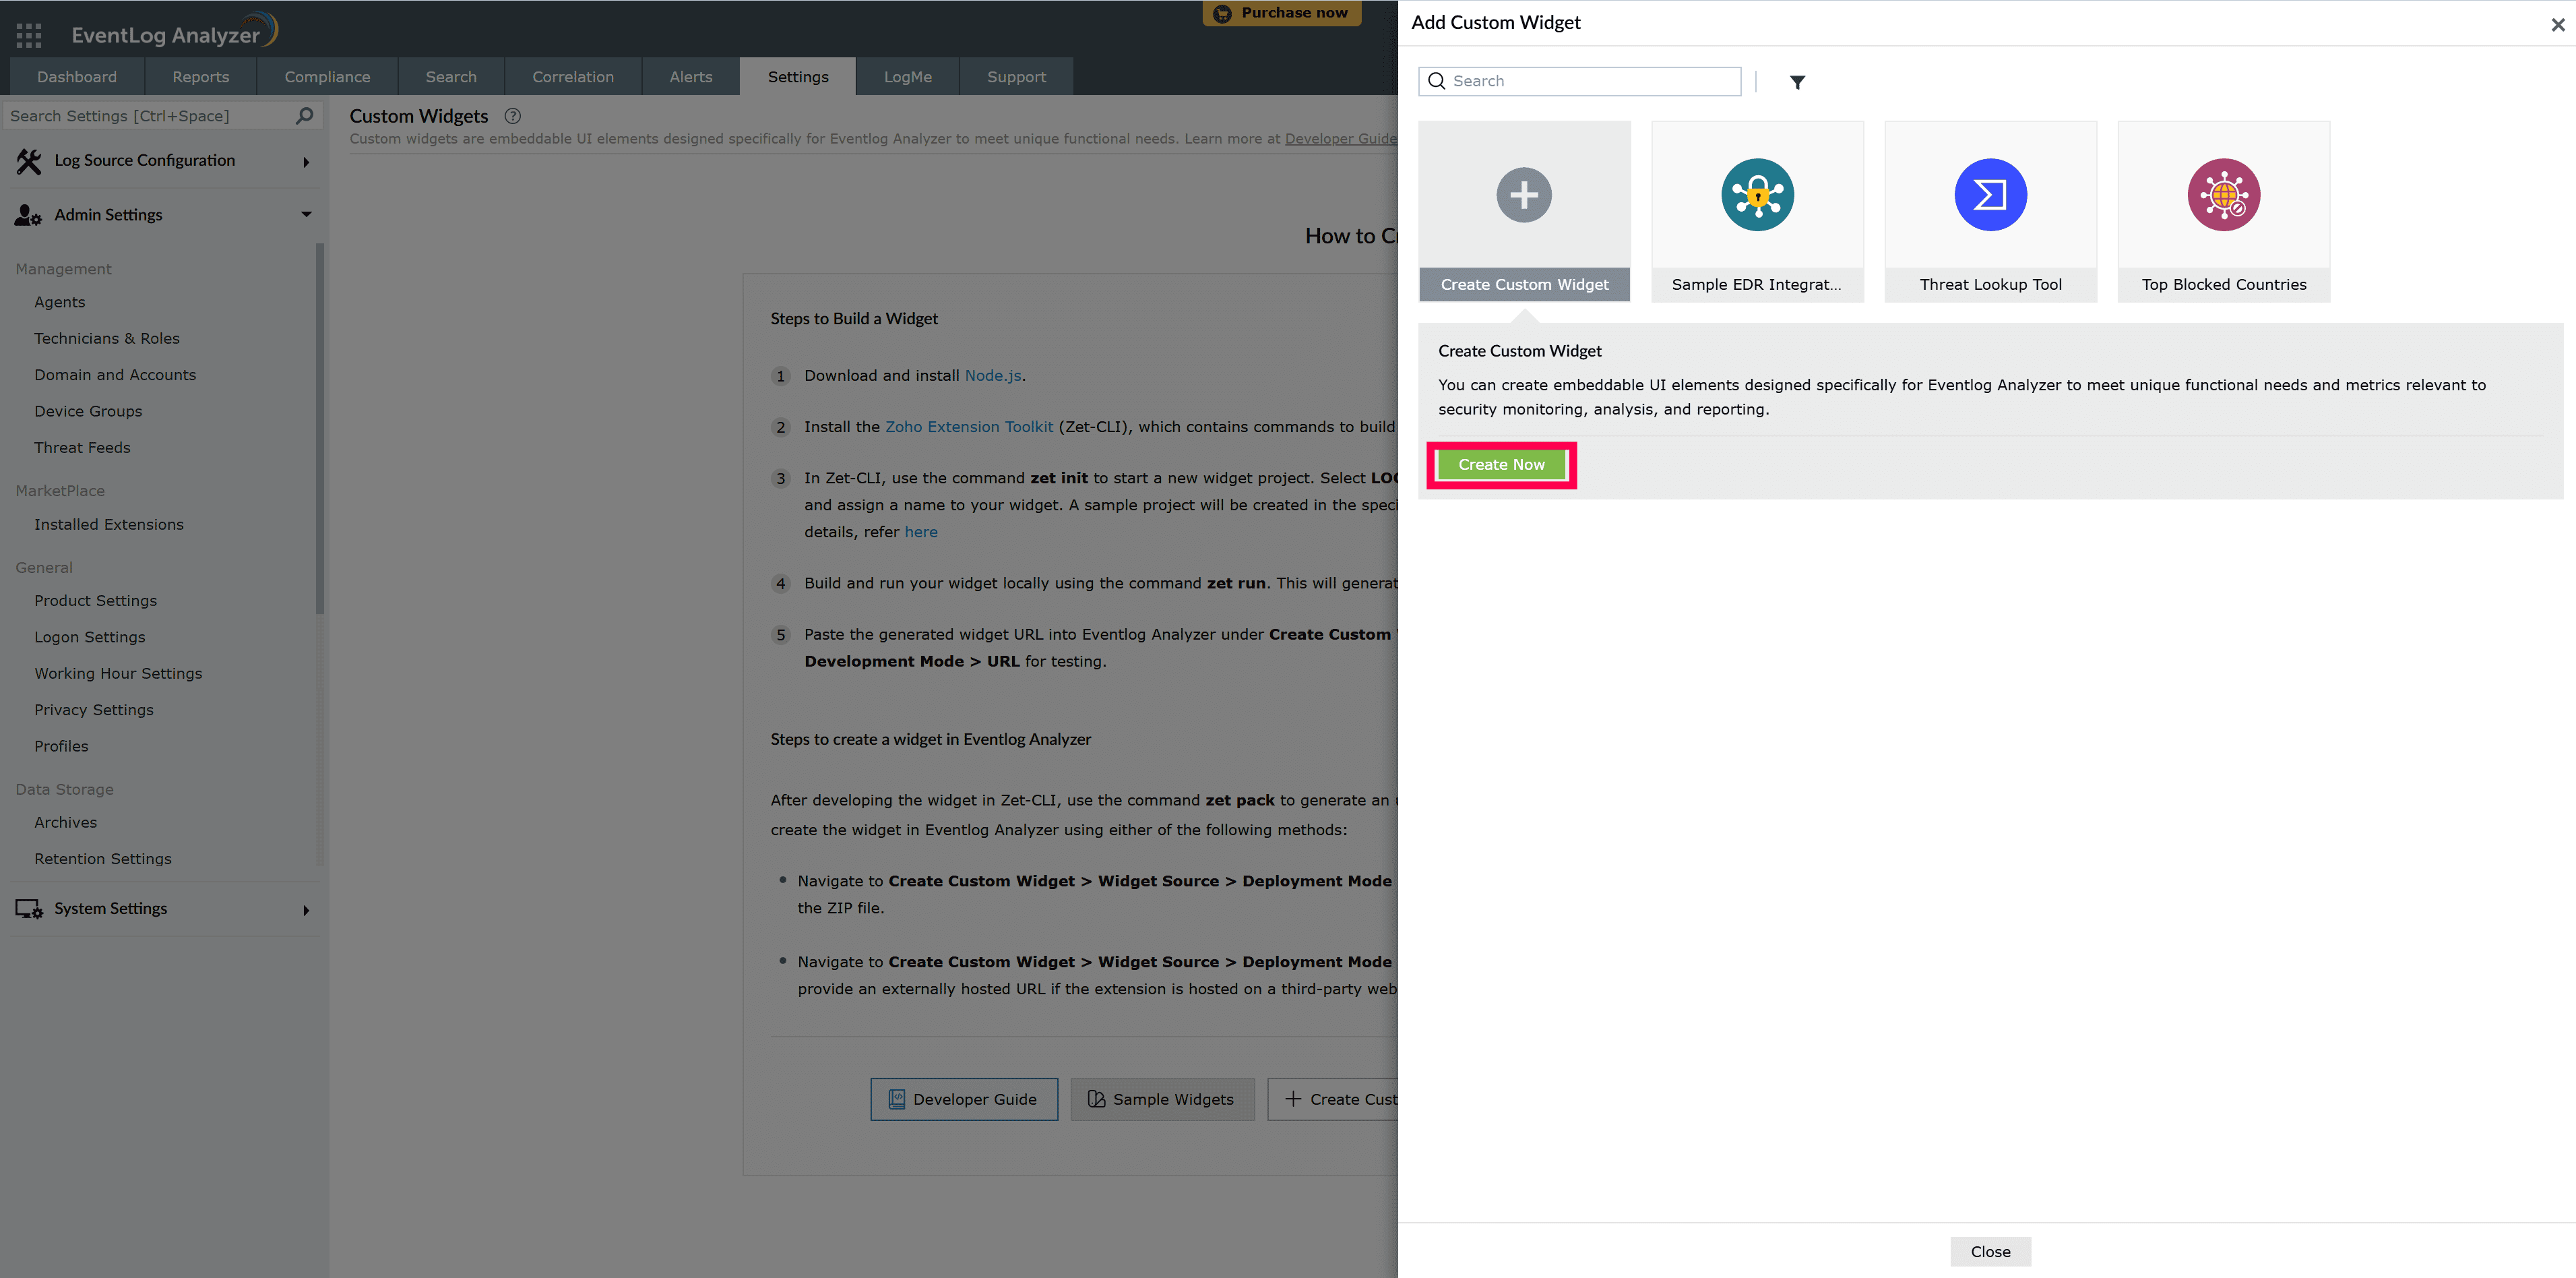
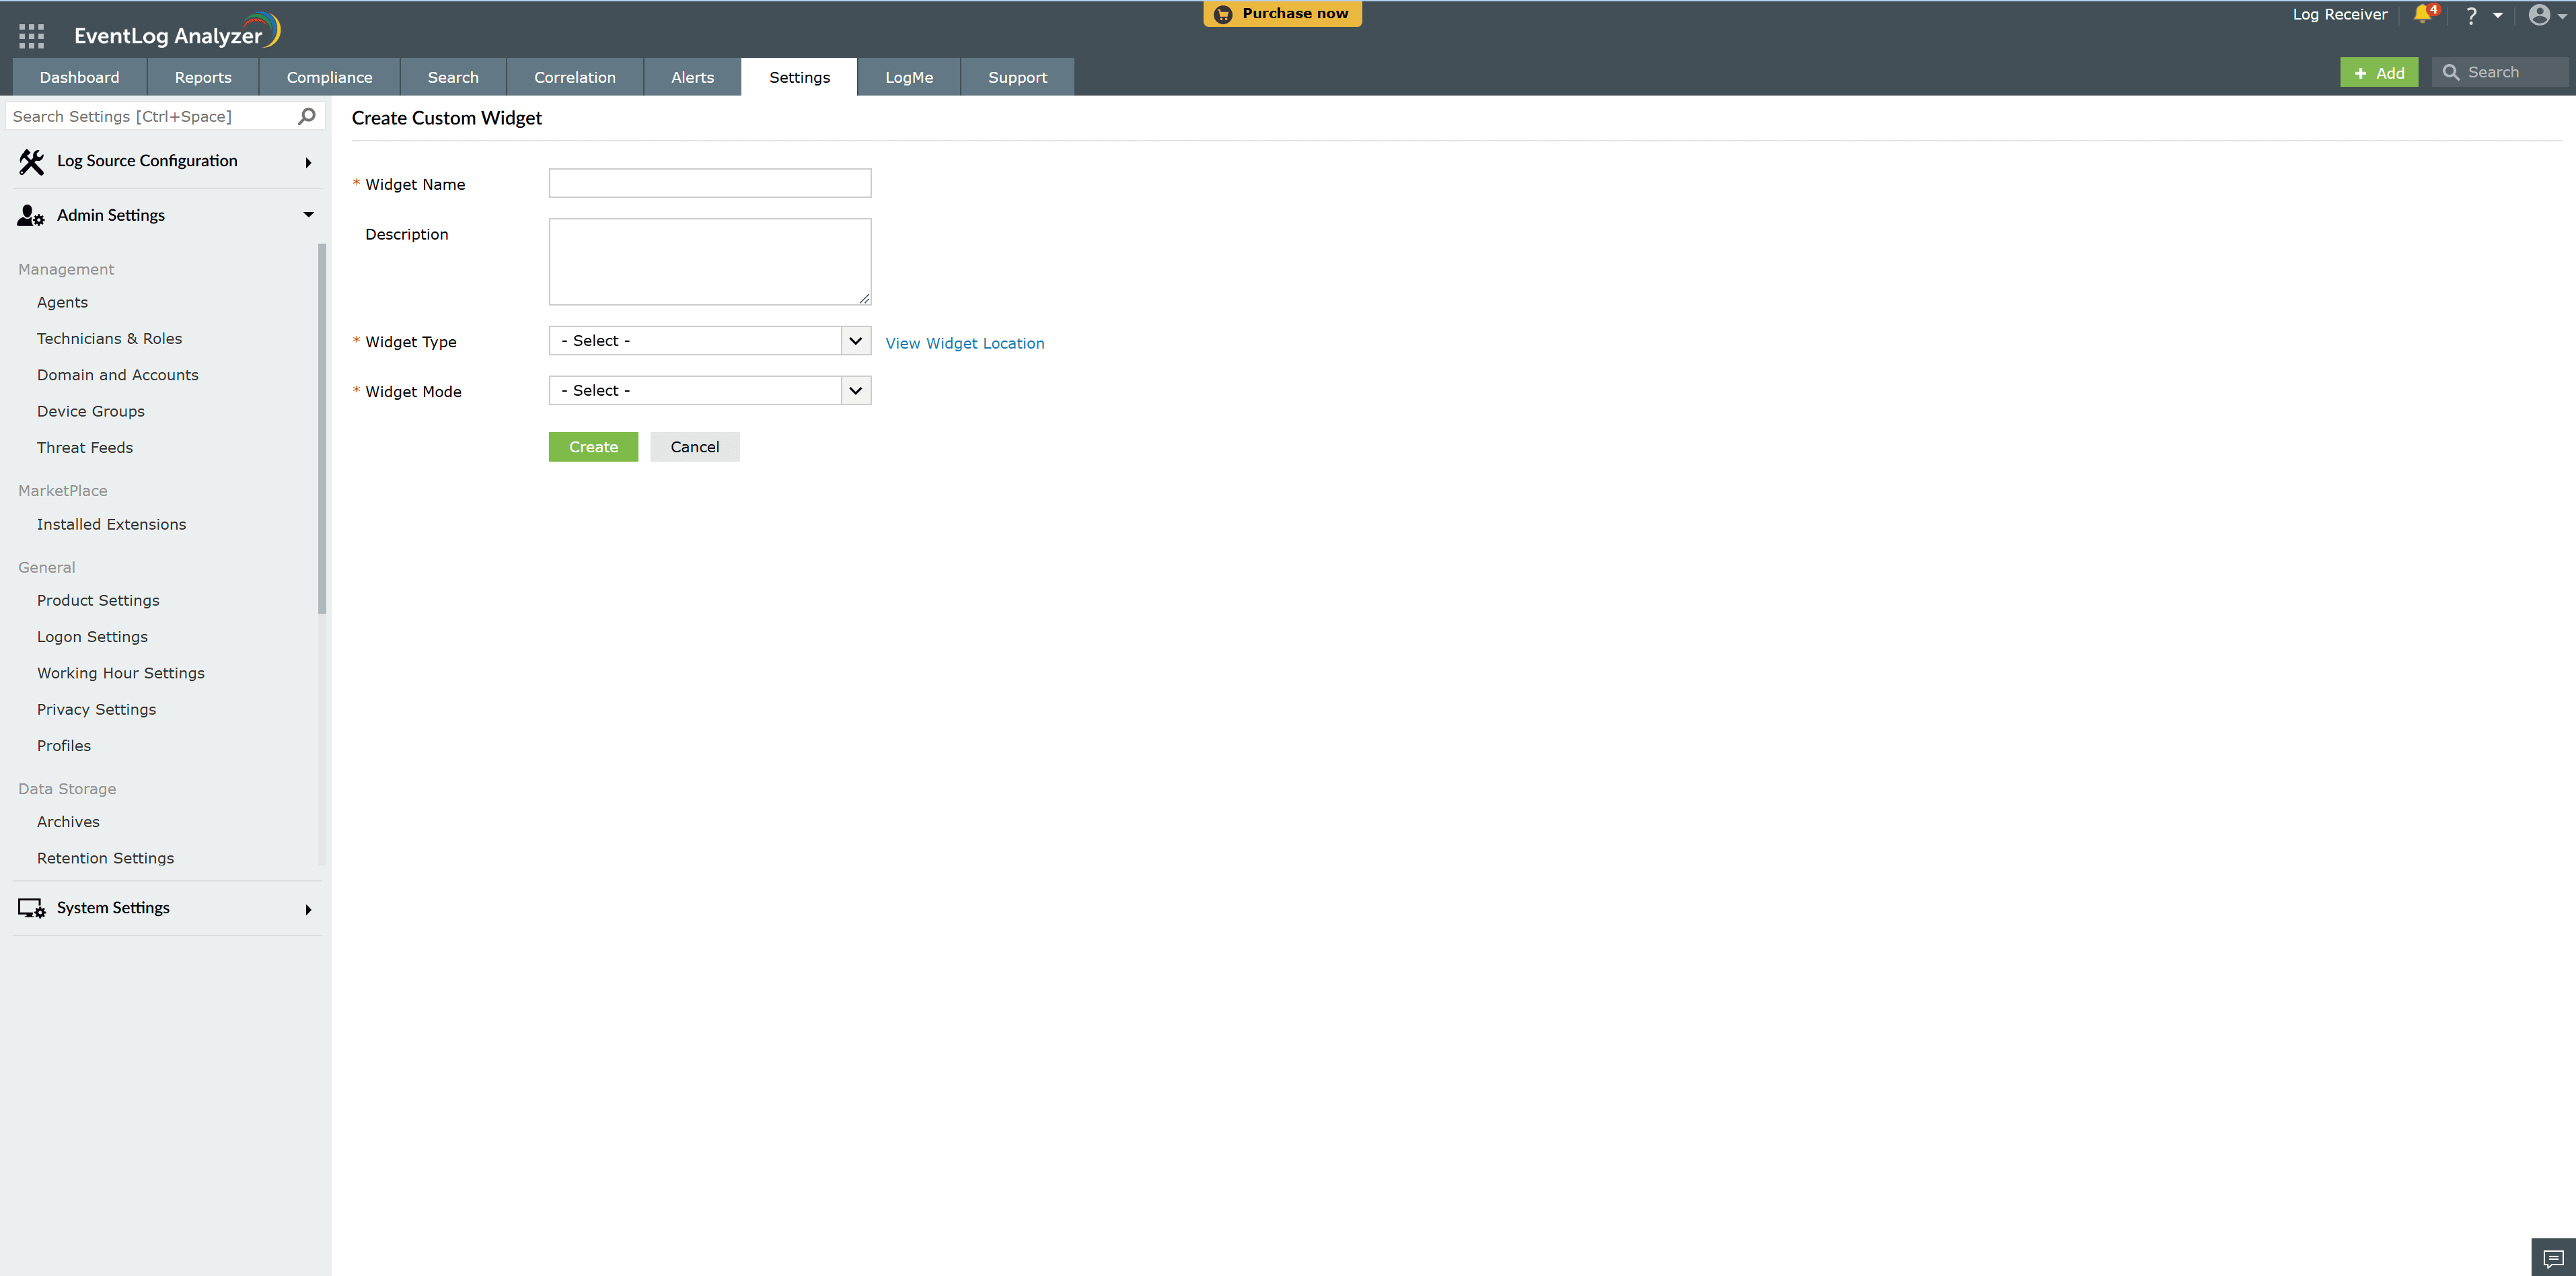
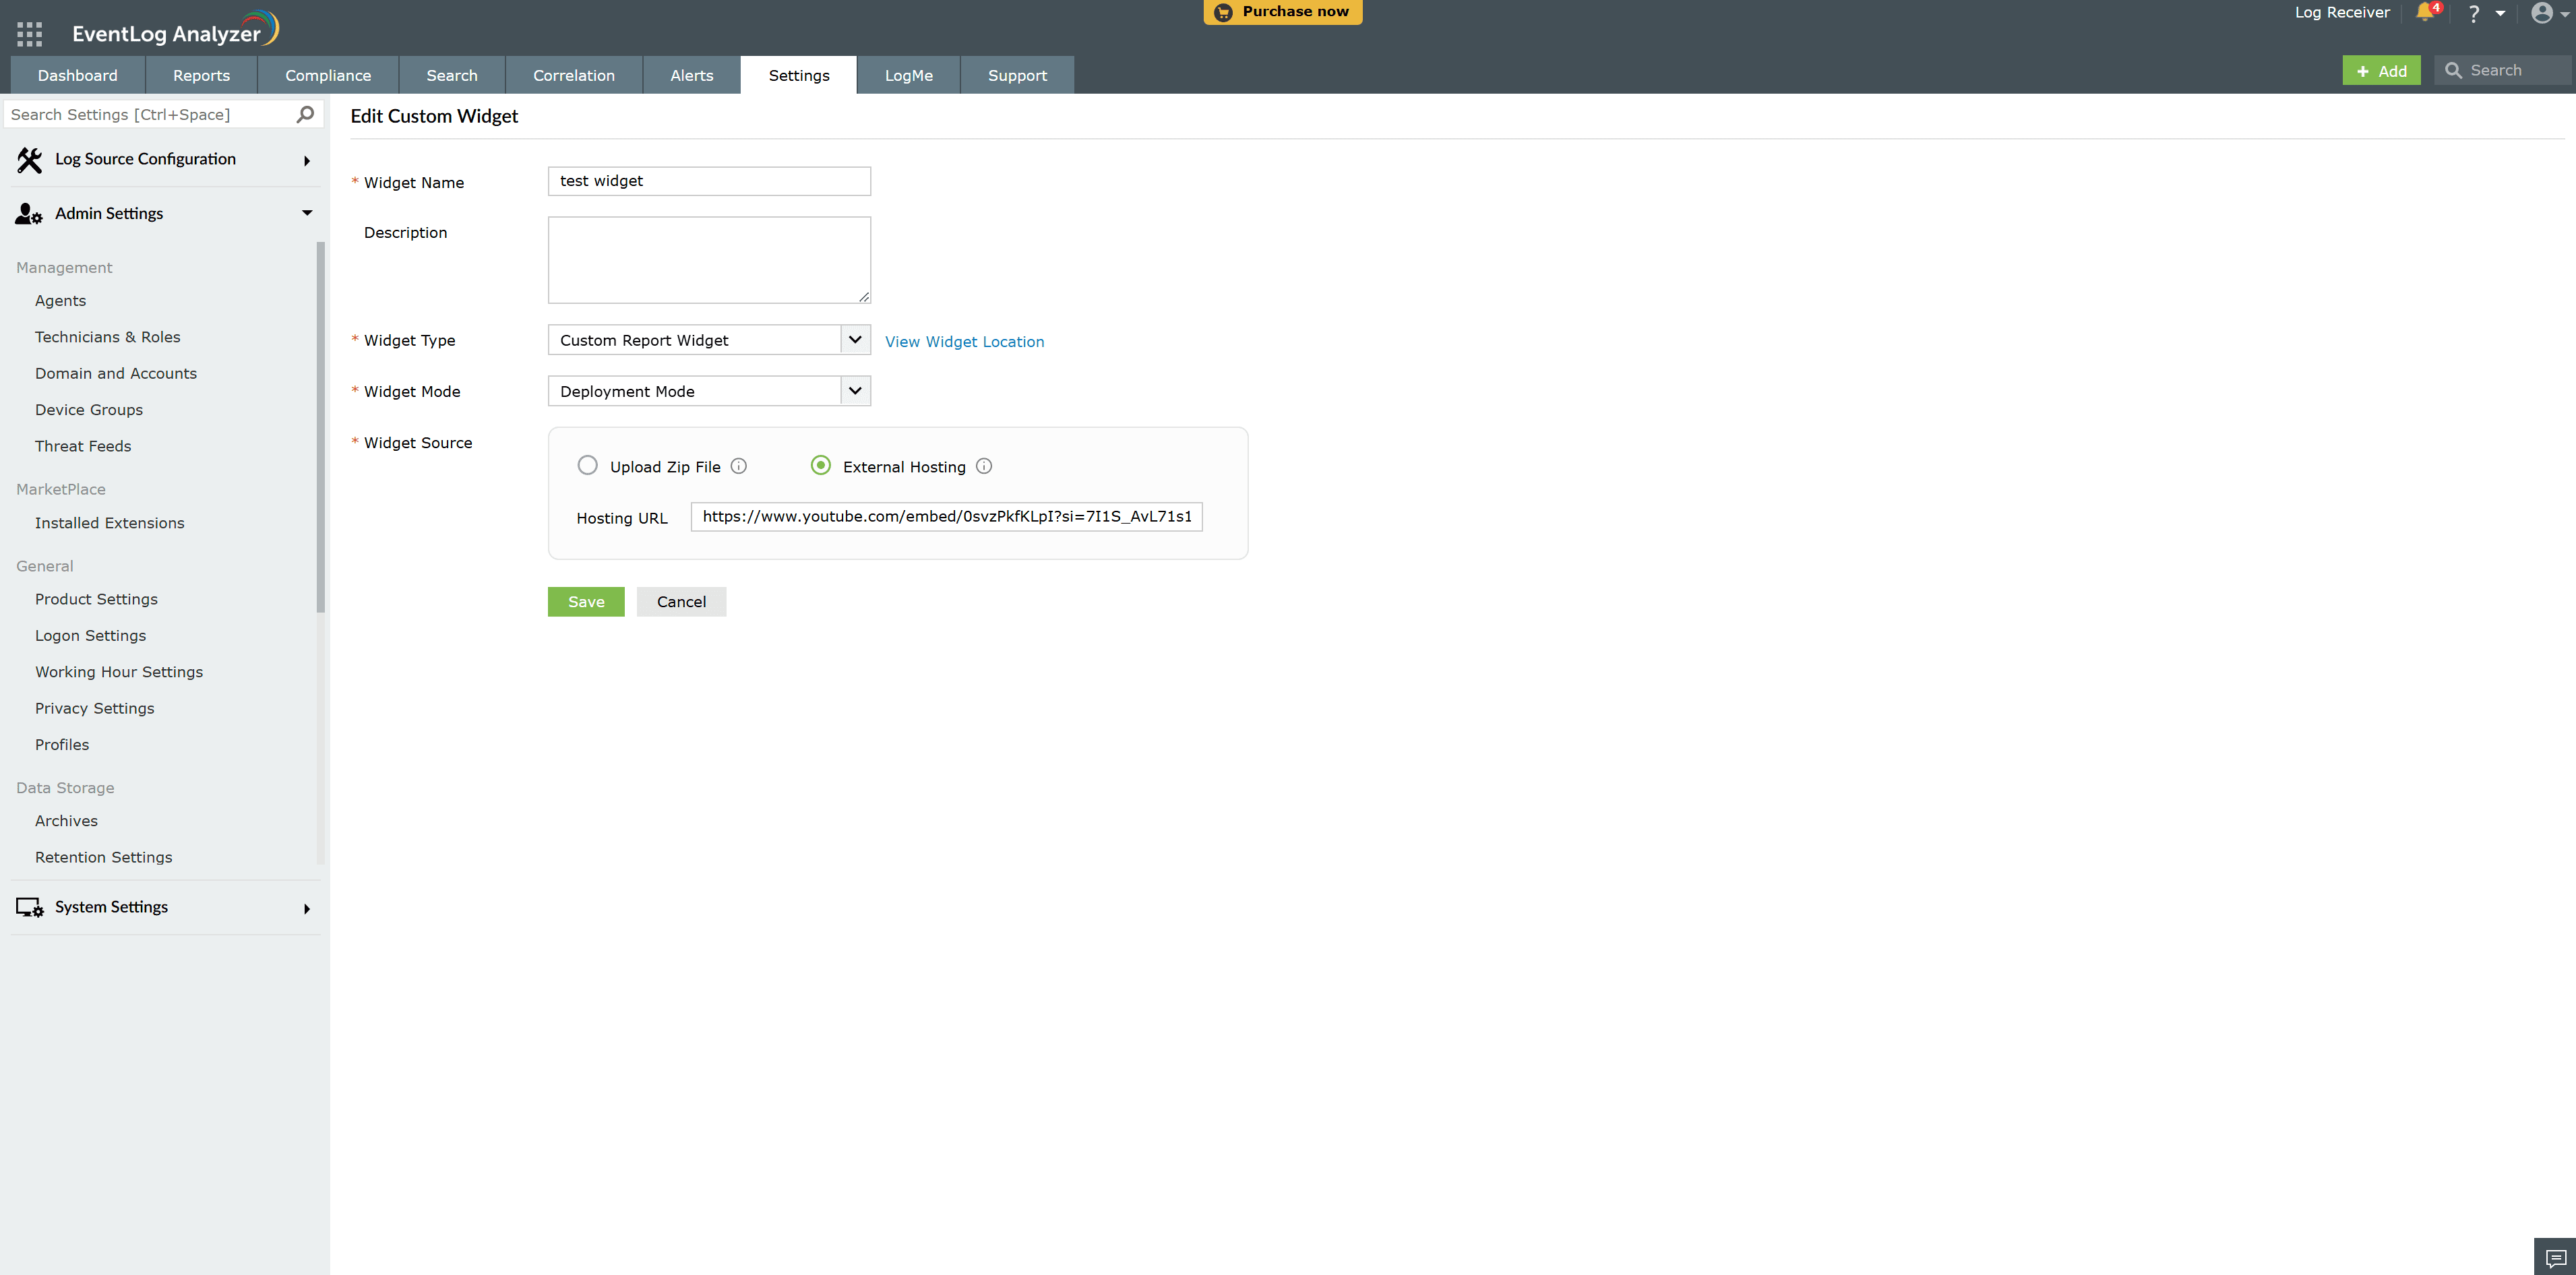
In the Create Custom Widget Form:
EventLog Analyzer supports two modes for custom widget creation:
$ zet run
In deployment mode, you have two options to add the widget to EventLog Analyzer:
a) Upload ZIP File (ZET Package)
$ zet pack
b) External URL Embedding
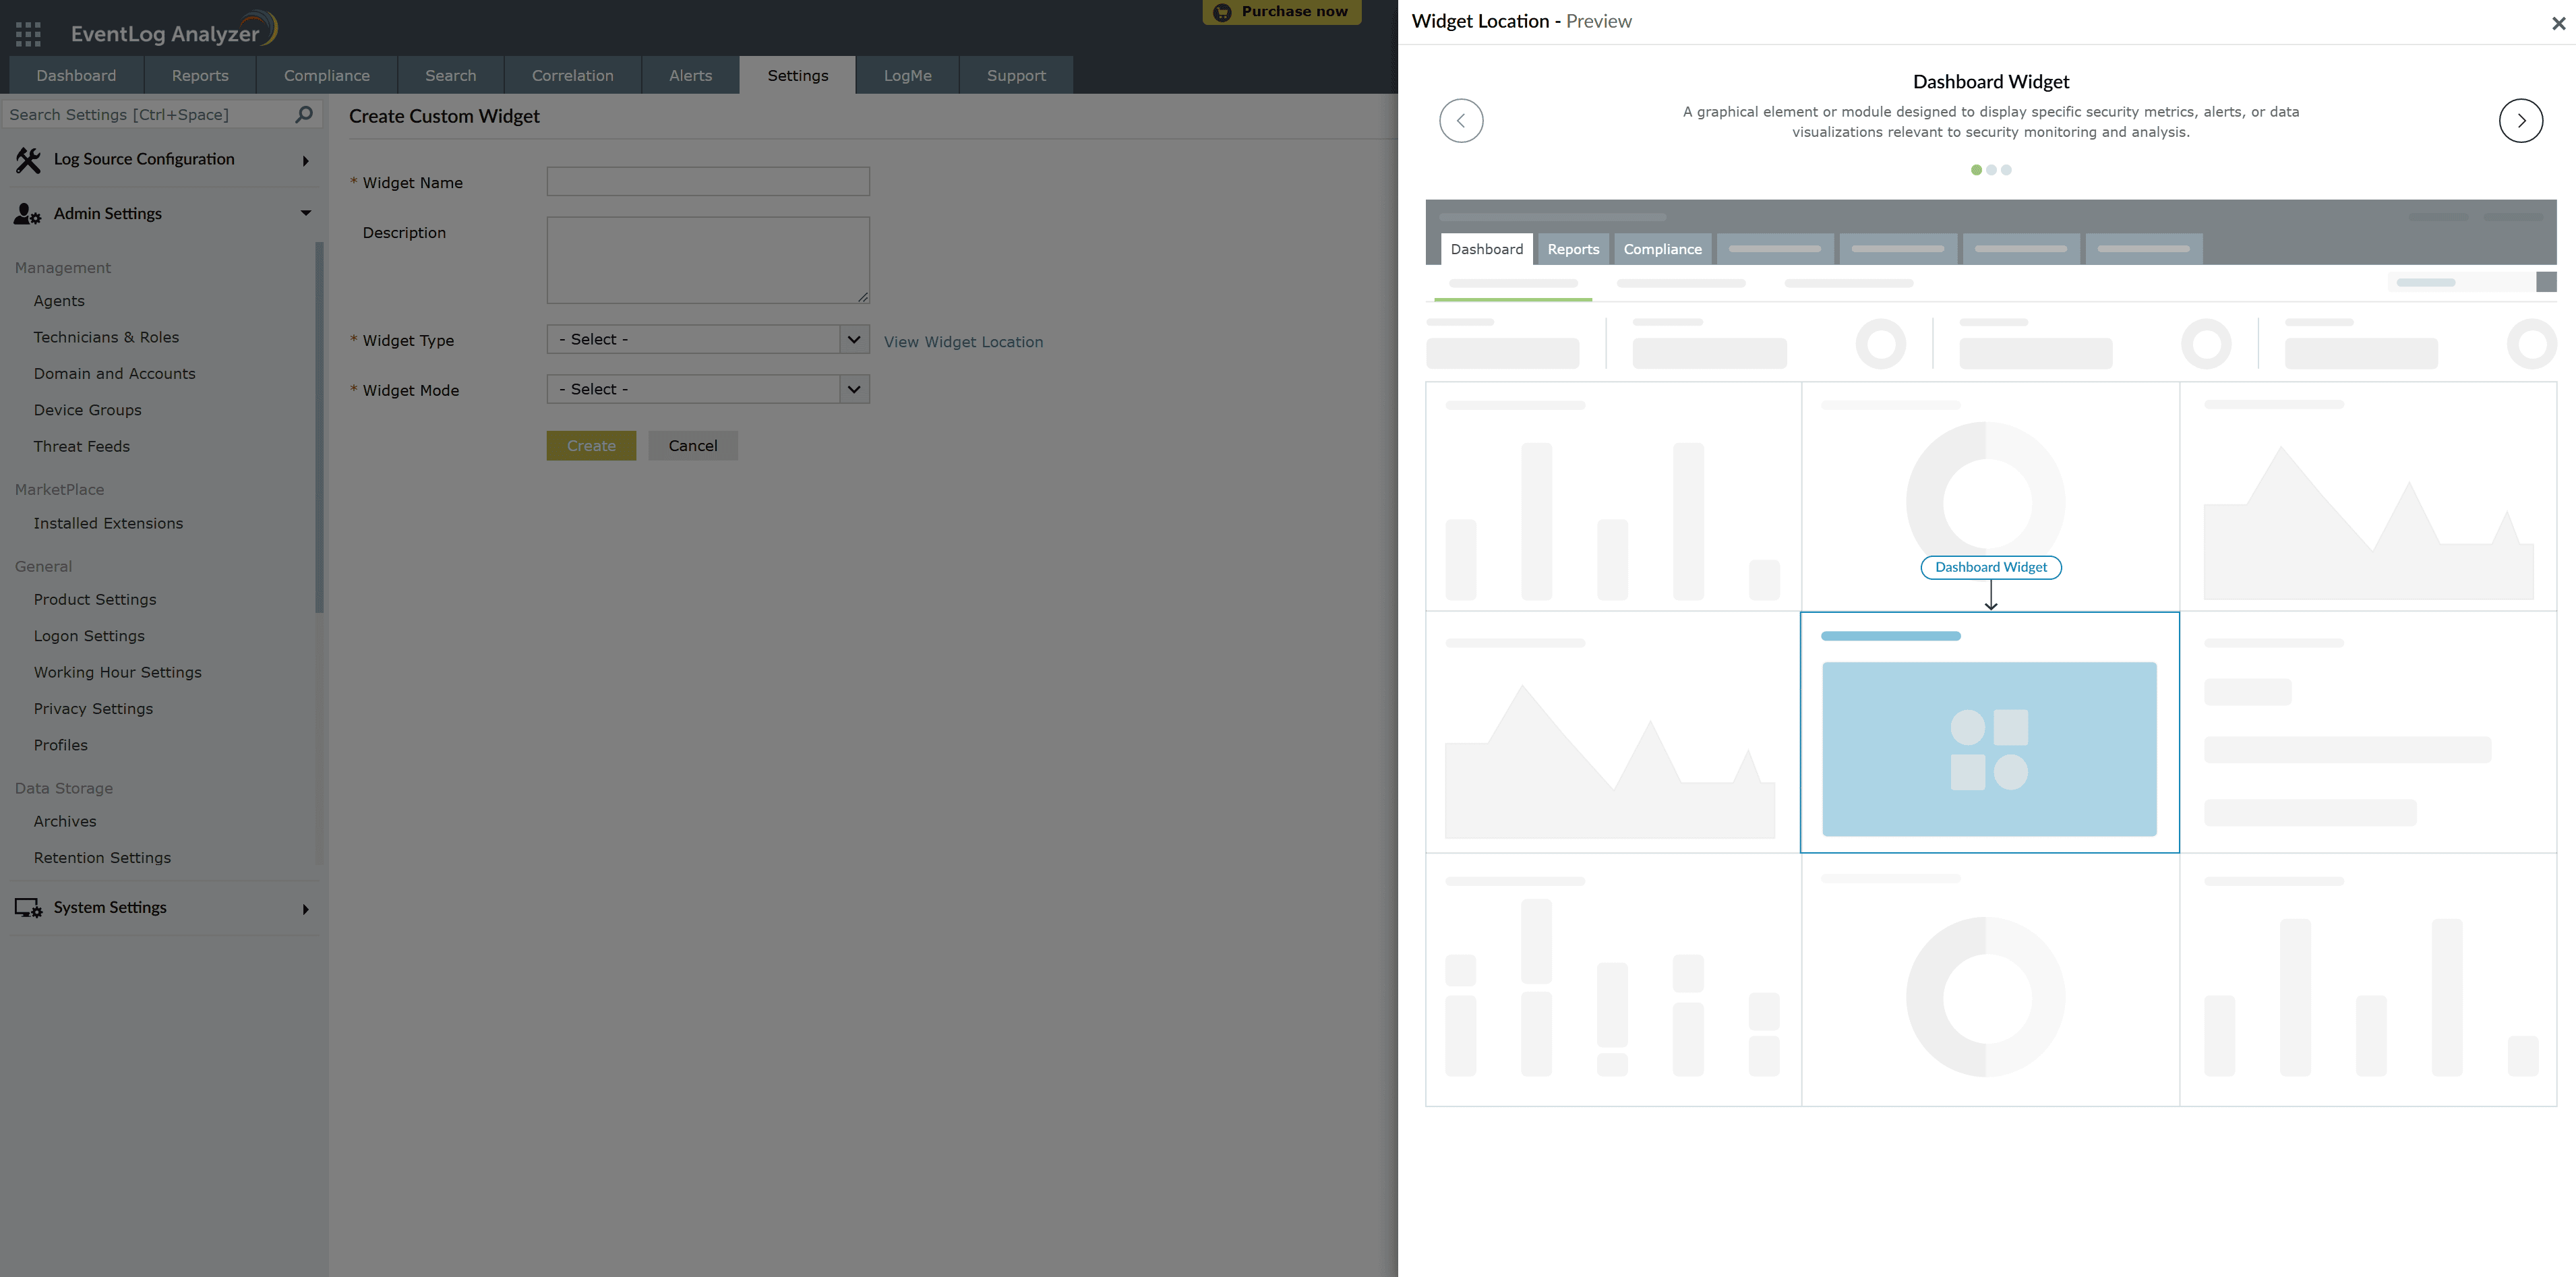
Custom widgets can be added to the following sections of EventLog Analyzer:
After creating an HTML page for the custom widget, add the following configuration to the plugin-manifest.json file inside the widgets list:
{
 "location": "dashboard",
 "url": "/app/widget.html",
 "name": "Sample Eventlog Analyzer widget",
}
This will ensure that the widget appears on the EventLog Analyzer dashboard.
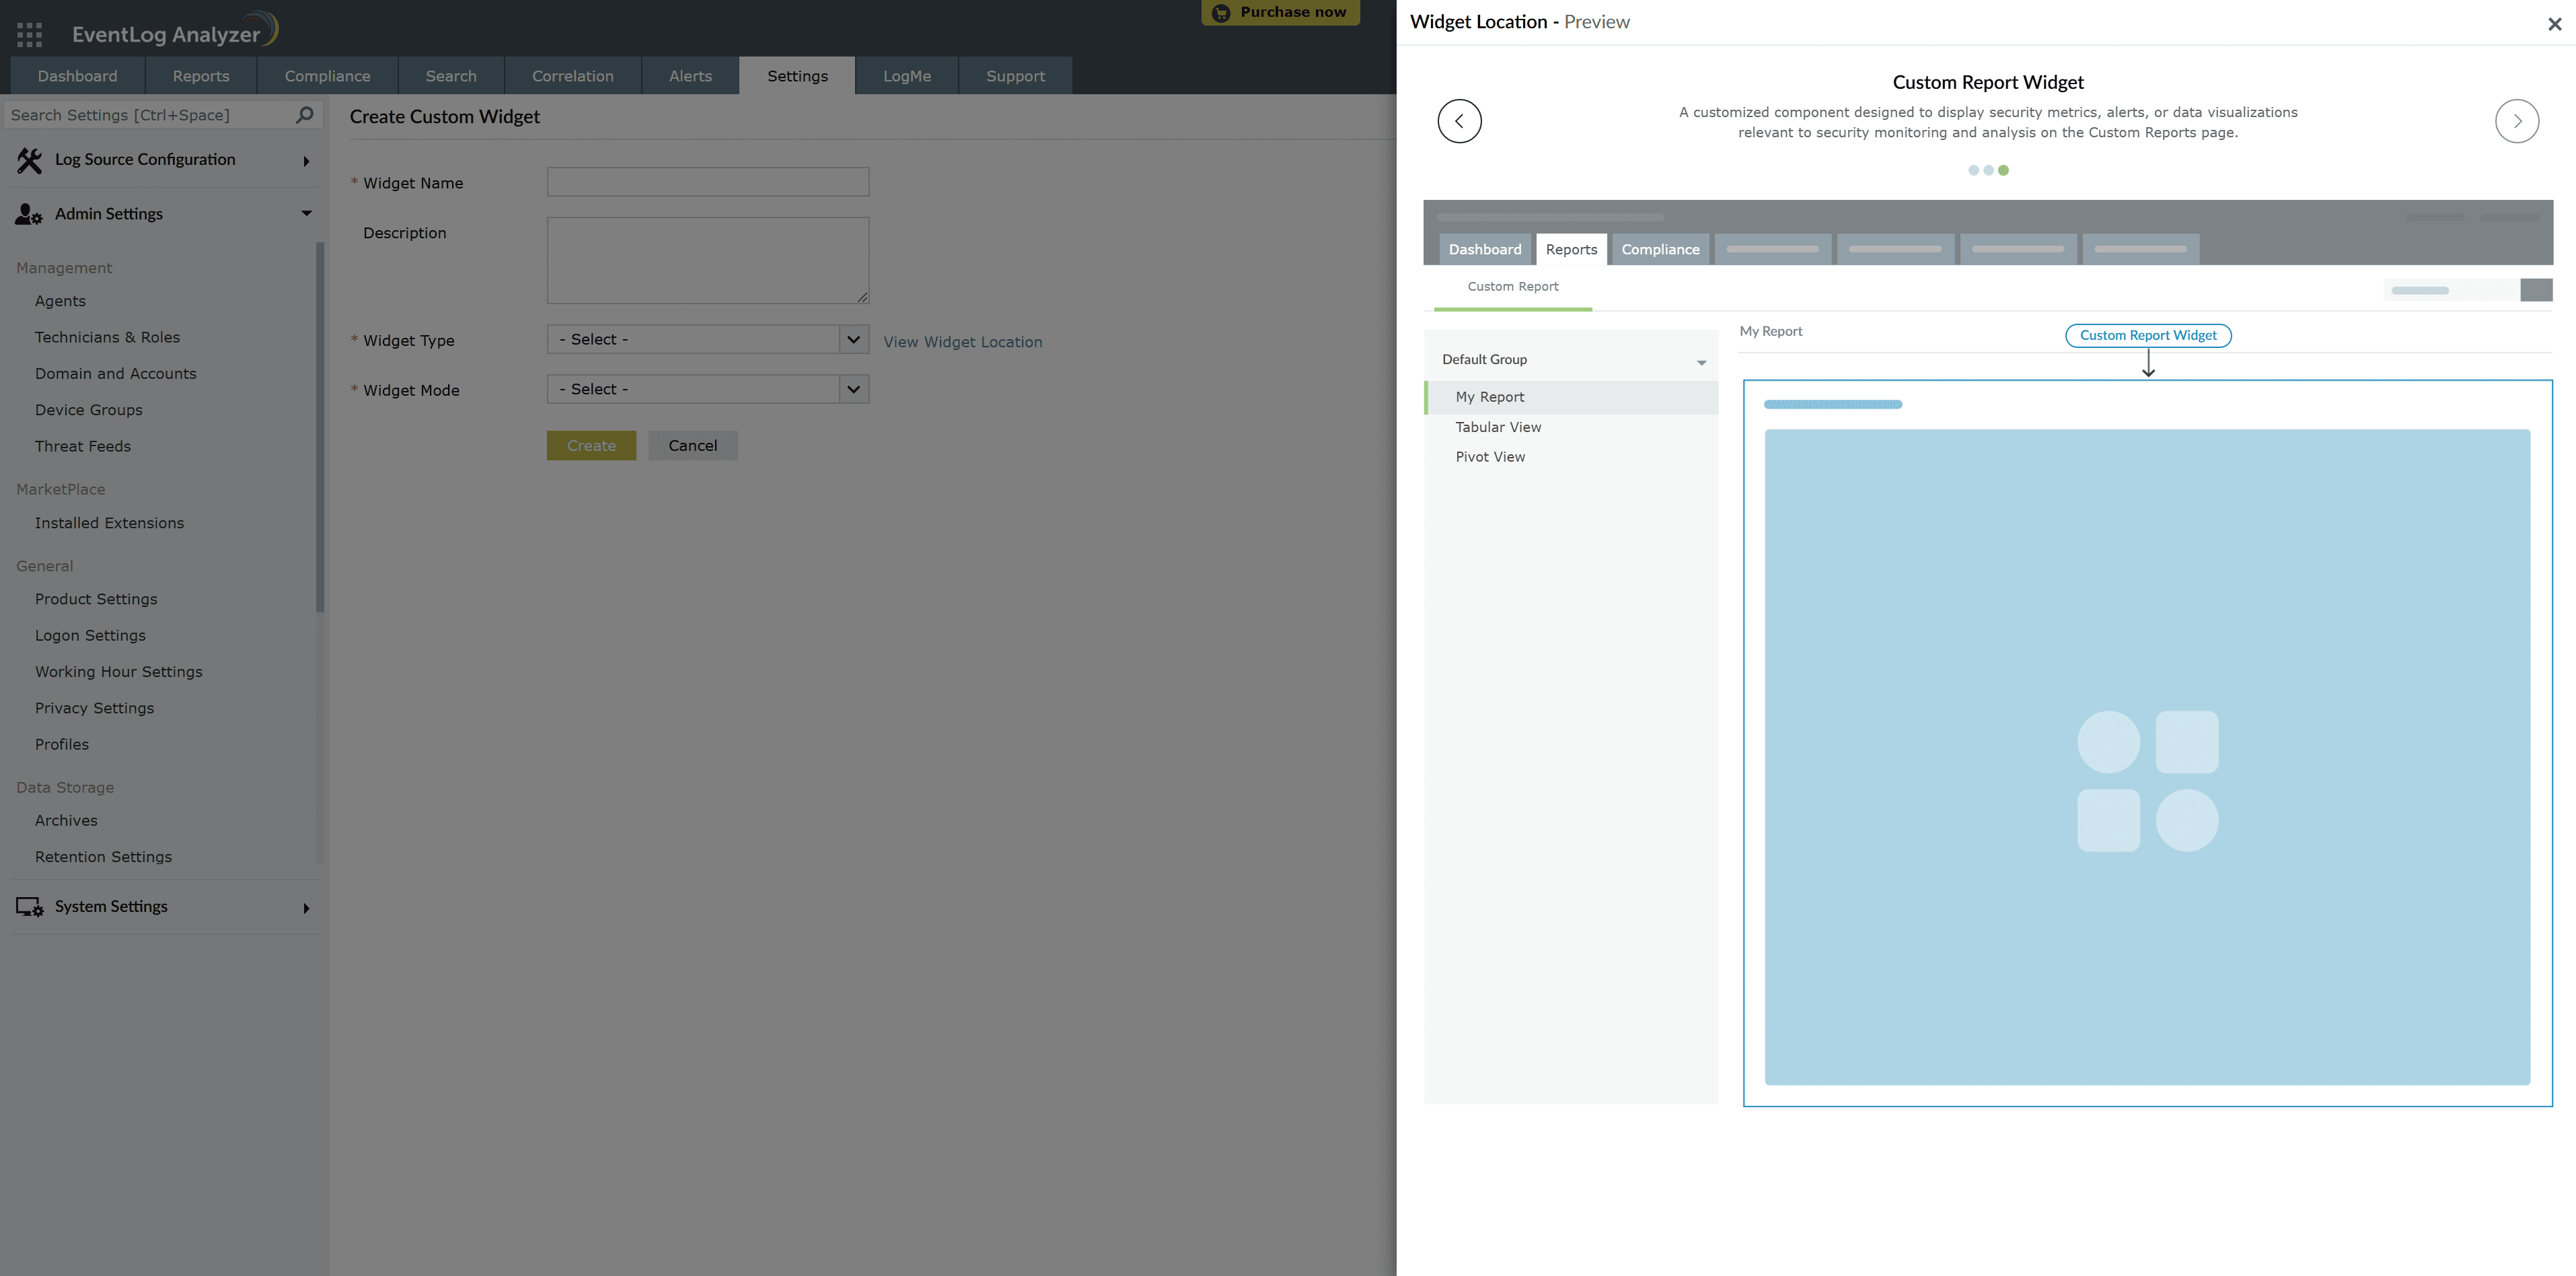
For adding a custom widget to Custom Reports, add the following configuration to the plugin-manifest.json file inside the widgets list:
{
 "location": "reports",
 "url": "/app/widget.html",
 "name": "Sample EventLog Analyzer widget",
}
This allows the widget to be used as a custom report widget.
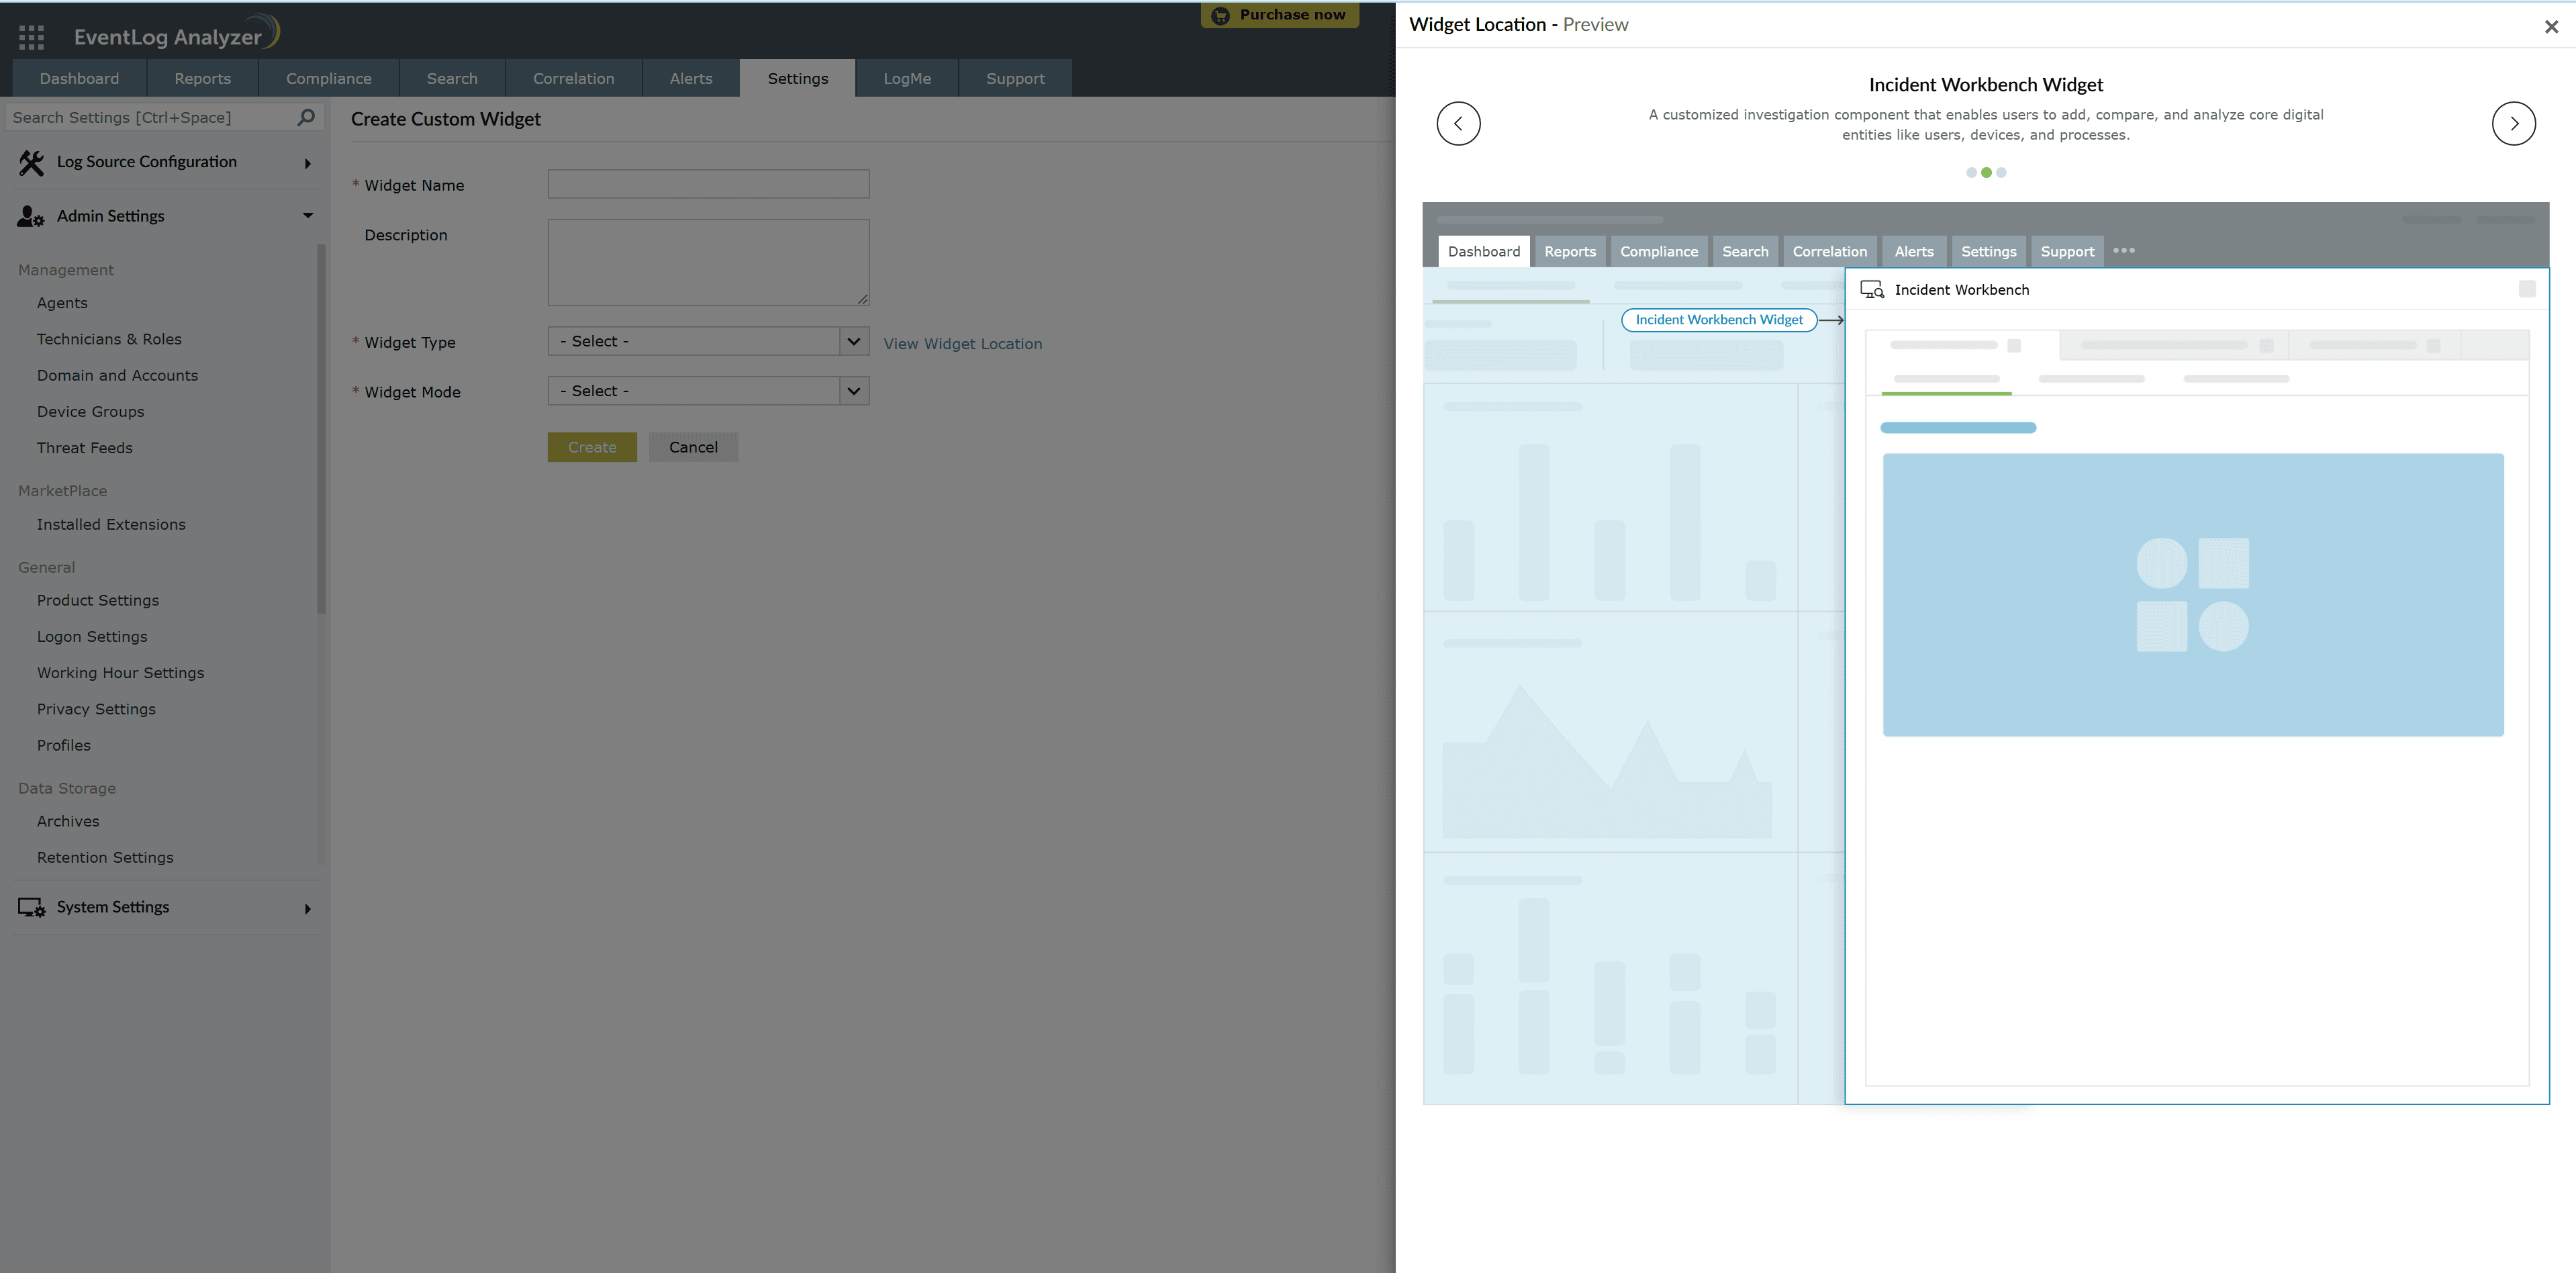
For including a custom widget in Incident Workbench, use the configuration below:
{
"location": "incident-workbench",
"url": "/app/incident-workbench.html",
"name": "Security Analysis",
"options": {
"fieldName":"FILEHASH"
 }
}
This ensures the widget is integrated with the Incident Workbench for real-time incident analysis.
Important
Modifying and uploading the name attribute for a custom widget after it has been added will result in the removal of the widget from its mapped module (Dashboard, Reports or Incident Workbench).
Following are the locations allowed in EventLog Analyzer:
Adding a custom widget in Incident Workbench differs from other modules as it requires mapping specific fields to the widget. When adding a widget to the Incident Workbench, you must specify options where the fieldName will be mapped with the custom widget.
Here are some of the important fields.
When a field associated with Incident Workbench is clicked, the log data corresponding to that row will be passed from the table data to the Custom Widget.
{
  "logUUID": 430453503444,
  "HOSTNAME": "EVENT-TEST",
  "USERNAME": "admin",
  ...
}
When editing a custom widget, certain changes can affect its associations with other modules.
Note: The widget name serves as the primary key for maintaining associations.
→ Only if the widget name (in the form or ZIP) is also changed.
Note: To avoid breaking associations, keep both the Widget Source and Widget Name unchanged when making edits.
JS SDK provides a set of JavaScript functions to integrate EventLog Analyzer functionalities into your custom widget. These APIs enable seamless interaction between your widget and the platform.
This function acts as a foundational call to establish a connection between the custom widget and the product. Other JS APIs will be defined only when the initialization is completed.
Returns promise
LOGS360CLOUD.init().then(function (res) {
    console.log(res);
});
Fetch the product data, such as meta data, or any input data in the custom widget, from the product server. Note that only Logs360 APIs can be invoked using this function.
var options ={url:"/api/v2/log-types"};
LOGS360CLOUD.get(options).then(function(response) {
        console.log(response);
    }).catch(function(response) {
        console.log(response);
    });
Note: Please ensure that only api/v2 APIs are used.
Add data to the server from the custom widget.Note that only Logs360 APIs can be invoked using this function.
var options ={url:"/api/v2/search",  params:{query:query, start_time:startTime, end_time:endTime, from: '1', limit:'1000', log_types:[logtype]}};
LOGS360CLOUD.add(options).then(function(response) {
        console.log(response);
    }).catch(function(response) {
        console.log(response);
    });
The function is used to display a loading indicator on the widget window. This helps improve user experience by visually indicating that a process is in progress, such as data fetching, API calls, or background computations.
LOGS360CLOUD.showLoader(opts).then(function(response) {
        console.log(response);
    }).catch(function(response) {
        console.log(response);
});
The function is used to remove or hide the loading indicator from the widget window. It is typically called after a process, such as data retrieval or API execution, has been completed.
LOGS360CLOUD.hideLoder(opts).then(function(response) {
        console.log(response);
    }).catch(function(response) {
        console.log(response);
});
The function is used to display a top notification in the widget. This notification can be utilised to inform users about important updates, alerts, or process statuses.
var opts = { type: "success" , message: "message shown successfully",autoClose:true,duration:2000};
    LOGS360CLOUD.showNotification(opts).then(function(response) {
        console.log(response);
    }).catch(function(response) {
        console.log(response);
});
The function is used to hide or remove the top notification from the widget window. This can be useful when you need to manually dismiss a notification before its auto-dismissal time or when clearing notifications based on user interactions.
LOGS360CLOUD.hideLoader(opts).then(function(response) {
        console.log(response);
    }).catch(function(response) {
        console.log(response);
})
Fetches the details of all successfully installed API applications.
LOGS360CLOUD.getConnections().then( function(res){
        console.log(res);
 });
The function is used to fetch data from integrated third-party applications by making API calls. This function supports multiple configuration options, such as URL, HTTP method, headers, parameters, and payload, allowing seamless interaction with external services.
let headers = [{ "headerName": "accept", "headerValue": "application/vnd.atlas.2023-01-01+json"}];
let params = [{"bodyParamName": "path", "bodyParamValue": "/dharun_test/sub folder/_ My Paper doc.paper" }];
var opts = {
         url: "https://cloud.mongodb.com/api/atlas/v2/groups?envelope=false&includeCount=true&itemsPerPage=100&pageNum=1&pretty=false",
        method : "GET",
        connectionLinkName: "mongotest",
         headers : headers,
         params: params
    };
LOGS360CLOUD.invokeUrl(opts).then( function(res){
    console.log(res);
});
Copyright © 2020, ZOHO Corp. All Rights Reserved.