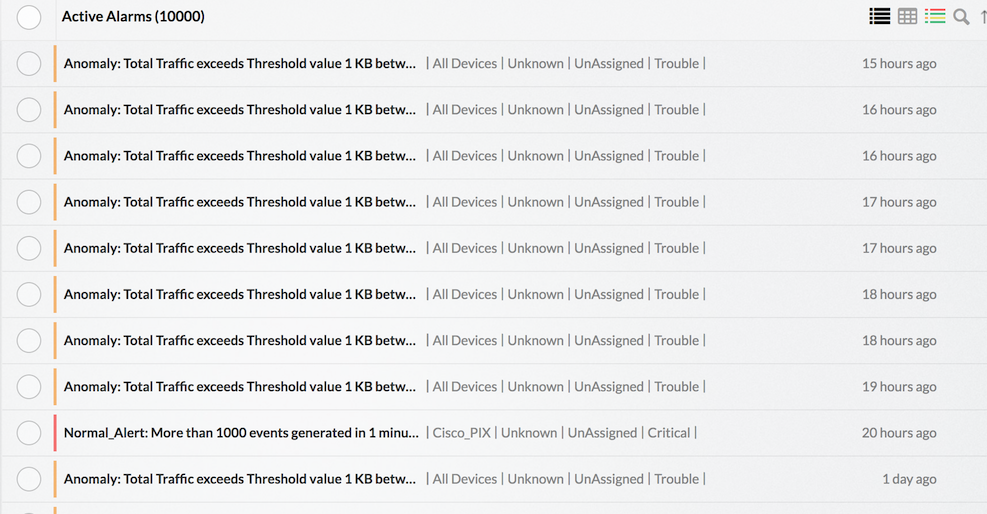
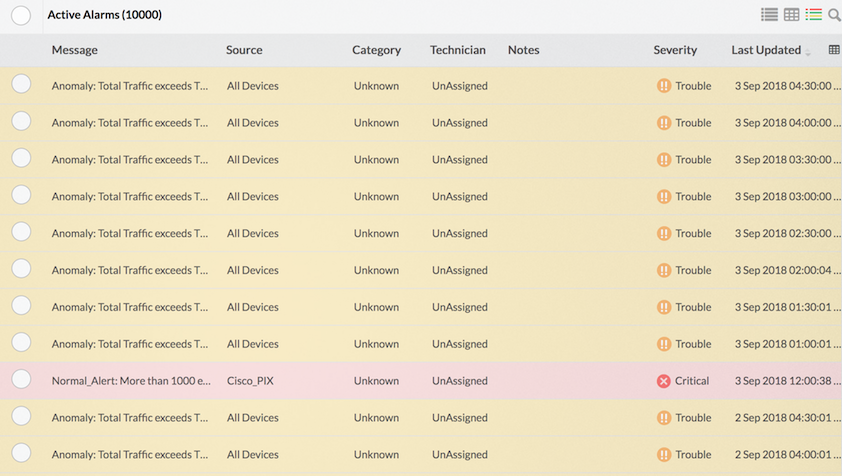
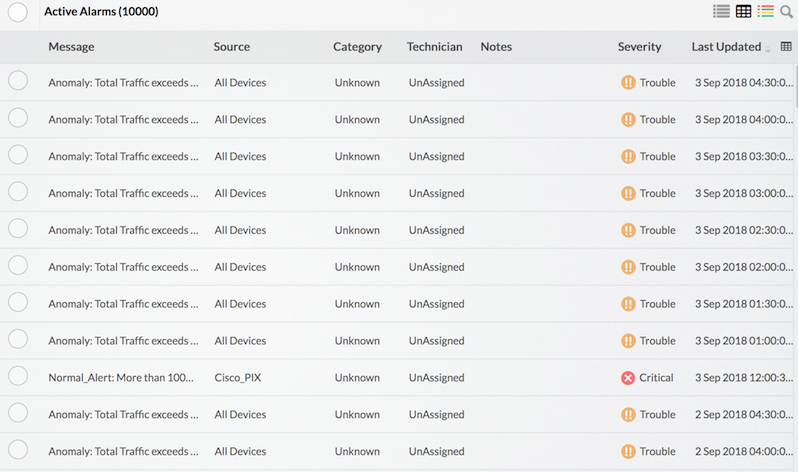
View Security and Bandwidth Alarms
After setting up Alarm Profile, select the Alarms tab to see the list of alarms triggered.
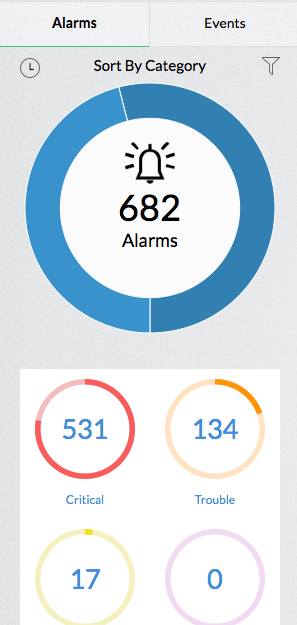
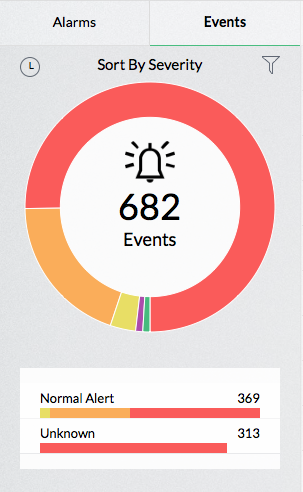
On the left side of alarms page, Alarms and Events snapshots are displayed as doughnut graphs.
Alarms are sorted by Category and they can be sorted by Time. They can be filtered by Active Alarms and All Alarms.
Alarm Type such as Firewall Alarms and can be sorted by Severity and Category.
Events are sorted by Severity and they can also be sorted by Time. They can be filtered by Trap Count and Unsolicited Traps
On the right side of the Alarms page all the alarms triggered so far are listed. The list shows the timestamp of the alarm, the host which triggered it, the alarm priority, and the status of the alarm. Clicking on each alarm would provide the details of the alert like why, when, and for which device the alarm was triggered. The list can be displayed in rows, table and severity colored rows. You can search for a specific alarm and the rows can be sorted in ascending or descending order.
