Exporting flows to monitor bandwidth
NetFlow Analyzer uses flow technology to provide real-time visibility into your network bandwidth performance. The first and most crucial step in monitoring your network bandwidth is exporting flows.
Exporting flows in NetFlow Analyzer is a simple process that involves adding credentials, followed by selecting interfaces by selecting/adding flow export commands, and finally executing the commands. It has been simplified with NetFlow Analyzer's Discovery steps.
You can access the Export Flow page using any of the three ways:
- You can click on Settings > NetFlow > Discovery > Export Flow or
- Navigate to Inventory, click on the Add icon in the Devices tab and access the Flow Export page or
- Access the Export Flow page from the Getting Started page
Device Info
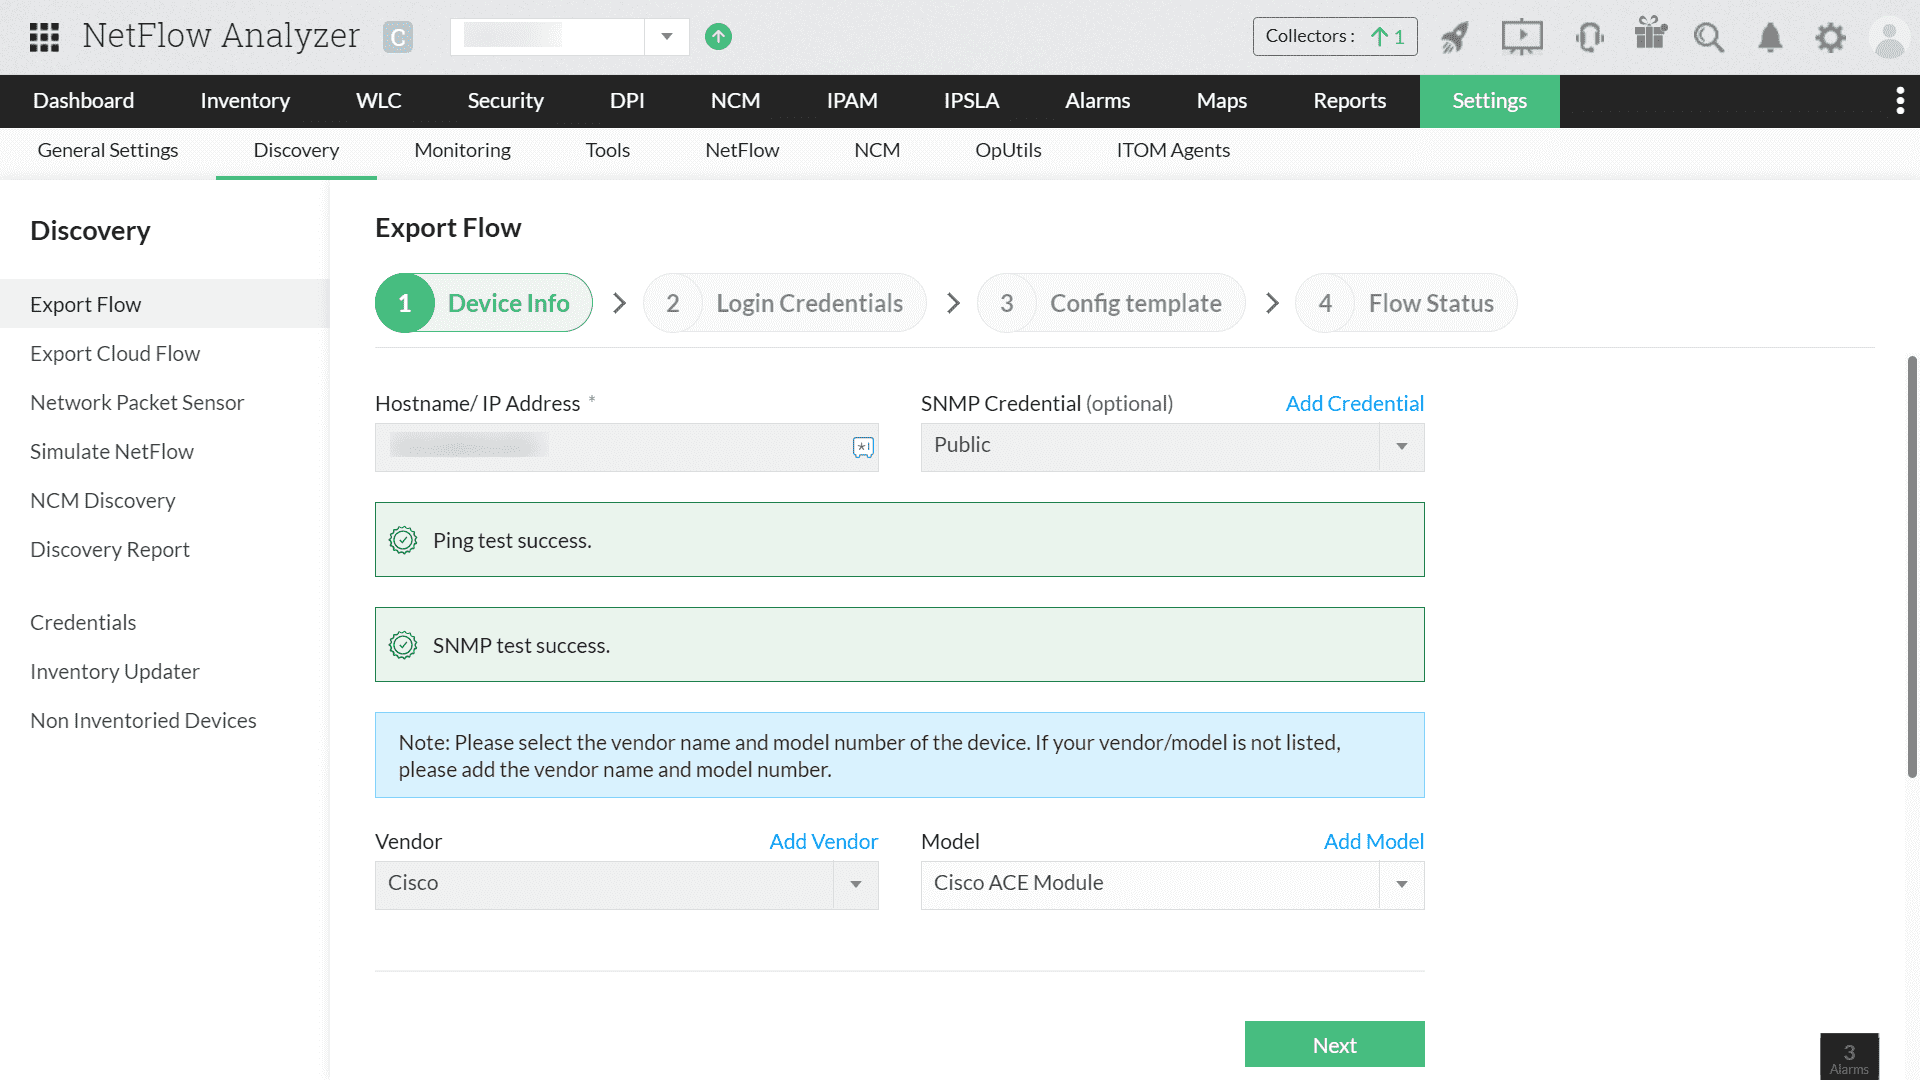
- Enter the hostname/IP Address
- As an optional step, you can add SNMP credential for NetFlow Analyzer to fetch the device and its interfaces or ignore this step.
- When you select the SNMP credential, the vendor will be automatically selected, and you can choose the model.
- If you have skipped choosing an SNMP credential, you need to manually select the vendor and model.
- Next, you can test the connection further by clicking on Test Connection. NetFlow Analyzer's Ping test will start verifying the device reachability.
Note: If your device vendor and model name is not listed, you can click on Add Vendor or Add Model option to start a chat with our support team, or contact us at netflowanalyzer-support@manageengine.com. You can also configure the devices through GUI
- On successful completion of these steps, you will be taken to the next step where you'll enter the device login credentials.
Device Login Credentials
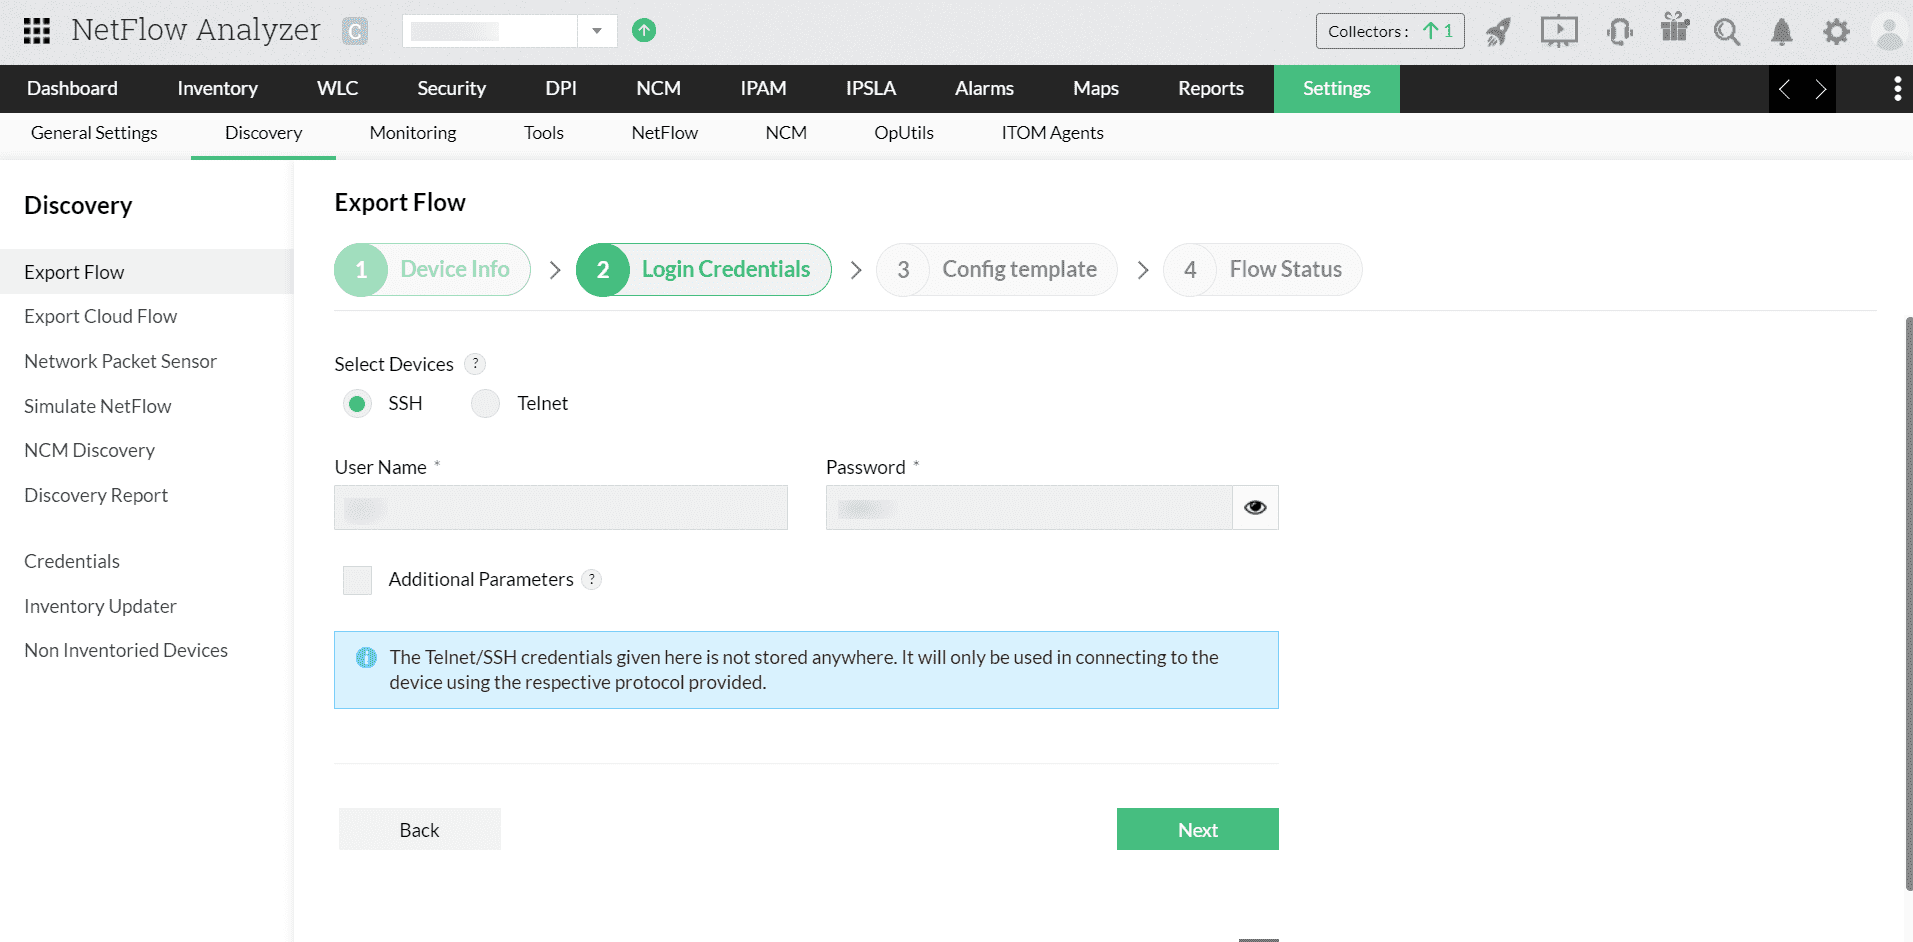
- You can select Telnet or SSH protocols, and provide the User Name and Password of the device.
- If you wish to customize the device parameters to establish the connection:
- Click on the Additional Parameters checkbox, and enter details such as Prompt, Enable Command, Enable UserName, Enable Password and Enable Prompt.
- You can further specify the port numbers such as Telnet/SSH, and other credentials.
- A success message will be shown just like in the below image once the credentials are verified. If not, you can recheck the credentials.
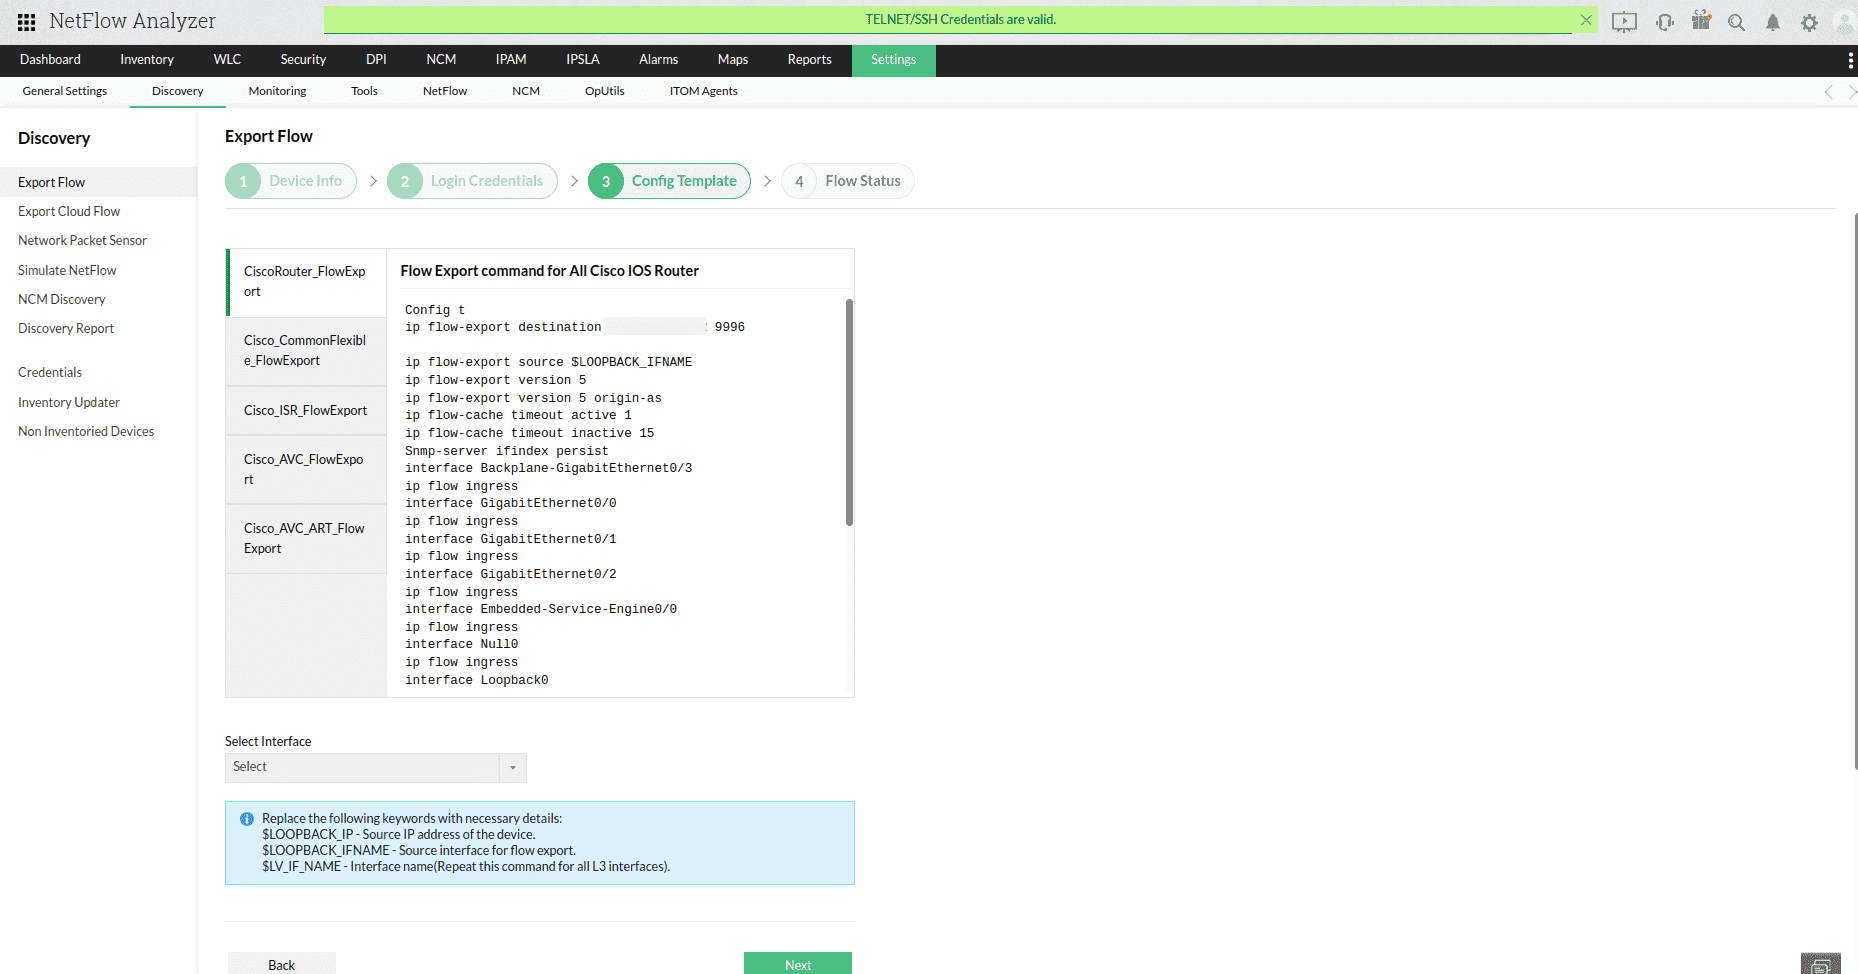
- By clicking on Next, you can proceed with verifying the respective device configurations.
Config Templates
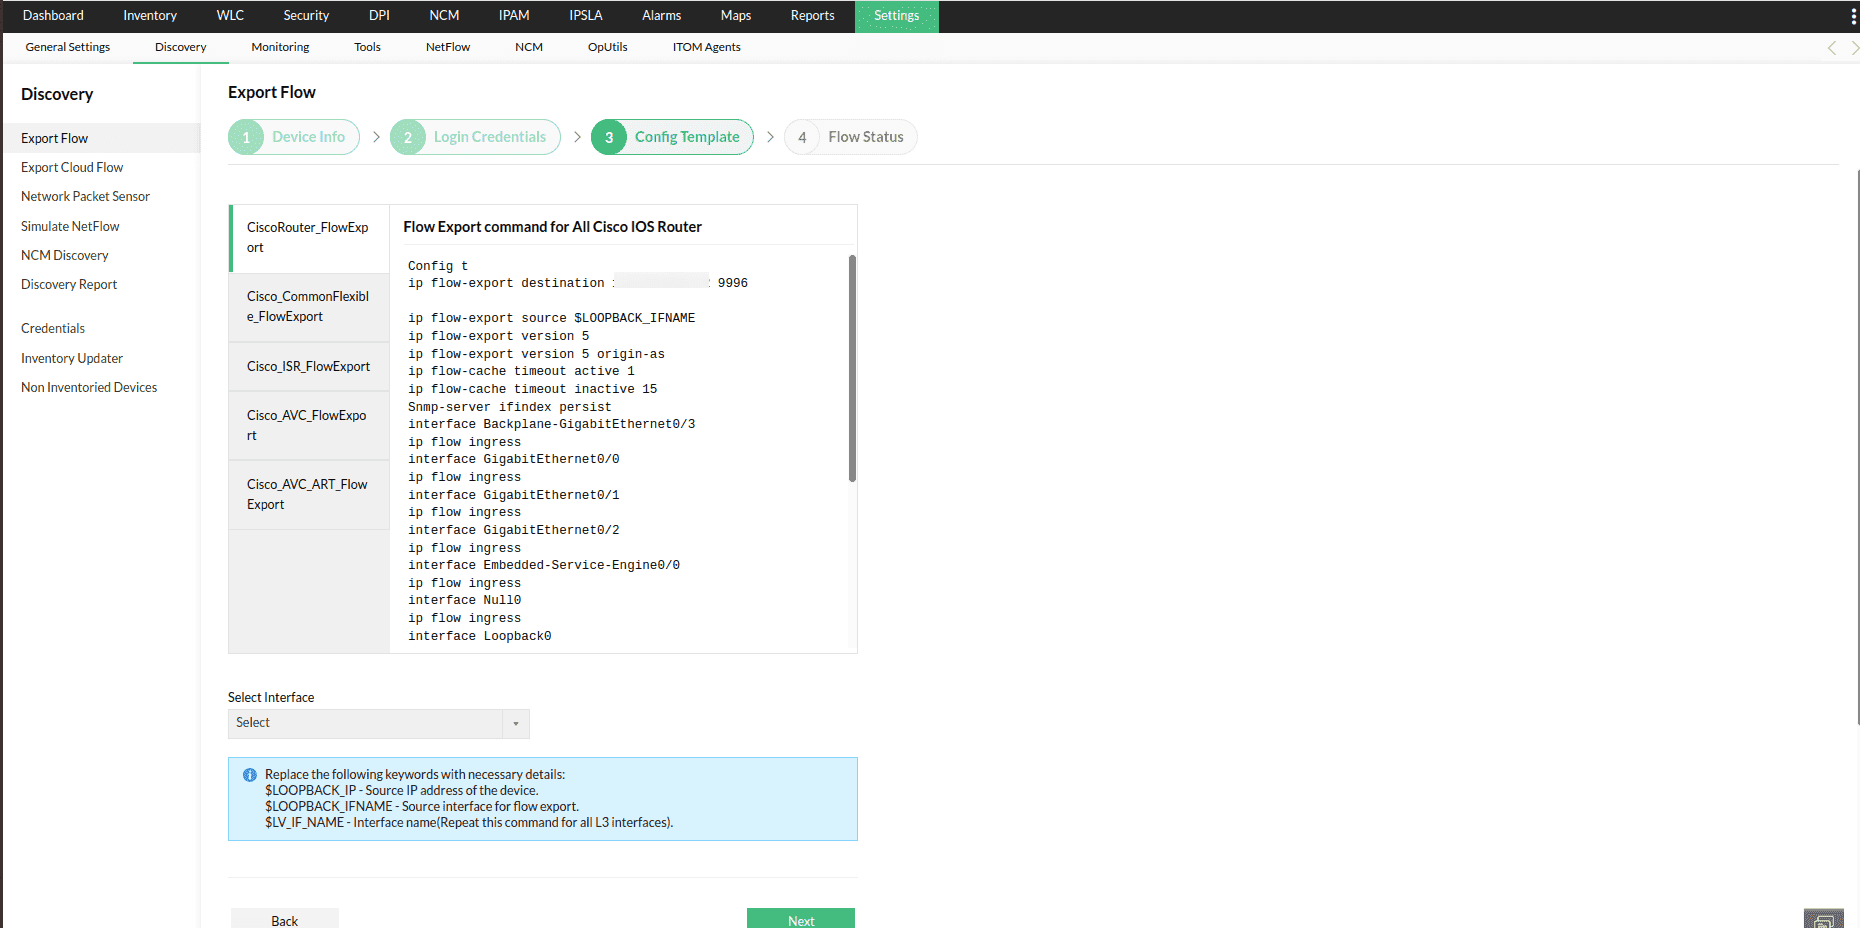
Configuring templates step allows you to verify the list of devices and edit the device flow export commands from the NetFlow Analyzer's database.
- If you have added SNMP credentials, NetFlow Analyzer would automatically select the Source/Loopback interface device type that could be verified. You can verify the commands and manually change the interface as you require.
- In the absence of any associated SNMP credentials, you can select the Source/Loopback interface manually, edit the commands, and execute them.
Note: You could edit the commands given, or if the displayed source interface and device type don't match, you can reach out to our chat support to help with different device configurations.
Flow status
On successful exporting of the flows, NetFlow Analyzer would show you the success message as given in the screenshot.
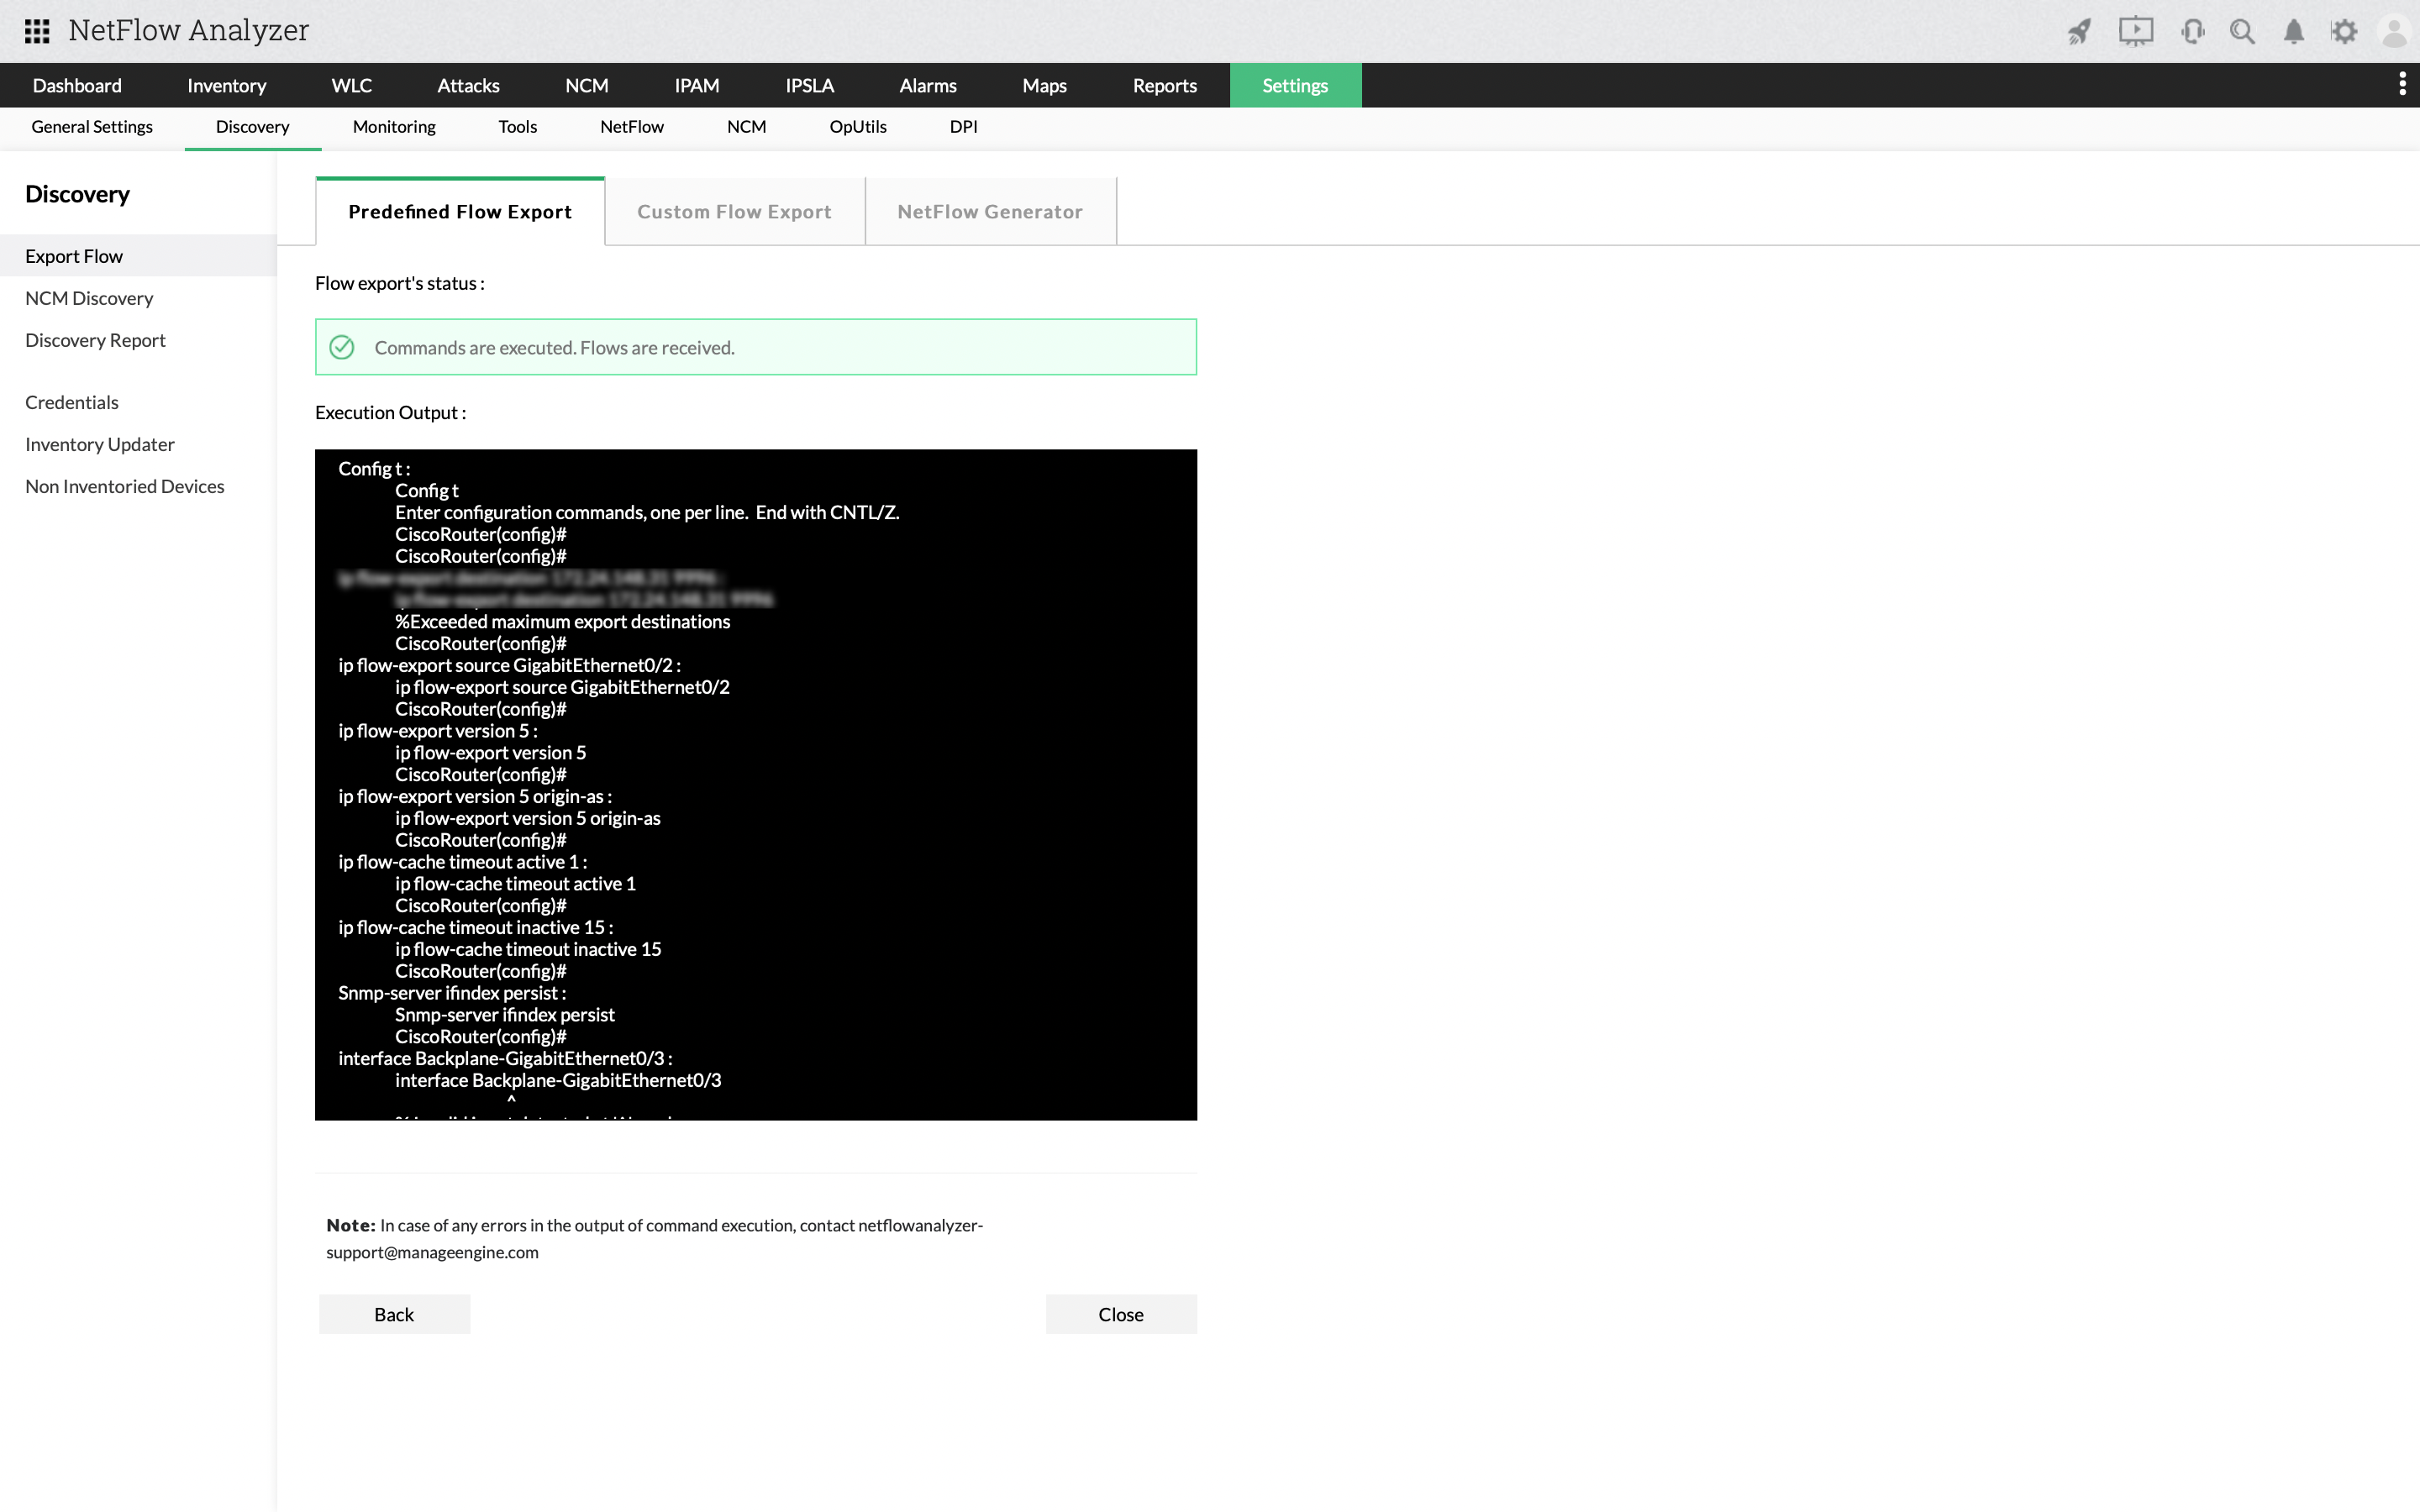
If the flows processing fails, it could be most commonly because of the misconfiguration of the device or if there is wrong access-list or QoS configured which is blocking the flows.
For any queries about flow processing errors or command unavailability, please refer to this help document or use our live chat support feature to connect with our team.
Note: You can disable the chat option by navigating to Systems Settings > Client Settings > Chat support, and then clicking on Disable option.