Custom Reports
SupportCenter Plus enables you to create reports that meet your organization needs.
To create your own custom reports,
-
Click on the Reports tab in the header pane to open the All Reports page.
-
Select New Custom Report button. The Custom Reports form opens.
-
Specify the Report Title.This field is mandatory.
-
Choose the Report Type by selecting either Tabular Reports or Matrix Reports radio button.
-
Select a module (Request, Time Spent, Survey and so on) for which you would like to create custom reports.
-
Click Proceed to Report Wizard >> button. The next page differs for each report type.
Generating Tabular Reports
Tabular reports are simple reports that allow you to list your data based on certain criteria. You can select the columns to view and group the output data. If you had selected the Tabular Reports option in step 5 above, then follow the steps below to create a tabular report.
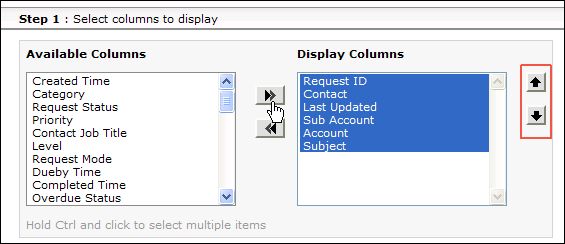
Step 1: Select Columns to Display
-
Click Select columns to display title.
-
Select the columns to be displayed in the report by selecting it from the Available Columns list and move it to Display Columns list using >> button. You can also order the column list using upward and downward button.
Step 2: Filter Options
On selecting the columns to be displayed in the reports, you need to specify the Filter Options for the columns.
-
Click the Filter Options title.
-
Specify the Date Filter by selecting the Column, Day and Date.
-
If you wish to add Advanced Filtering, select the Column Name and Criteria from the drop down list. Specify the value by clicking on pick value icon  . You can add 'n' number of Name and Criteria and match with AND or OR condition.
Step 3: Select Column to Group
-
Click Column to Group title to open the link.
-
Select the column data to be grouped from the Group by and Order by drop down. You also have an model column on the right hand side of the page.
Step 4: Select Summary Type
If you have selected any numeric field in the columns to display option then, this option will be available. Select the column summary options available for each column. Column summary options are count, sum, average, maximum value and minimum value.
Select the column summary options by enabling the check box. These selected column summary will be displayed in the reports.
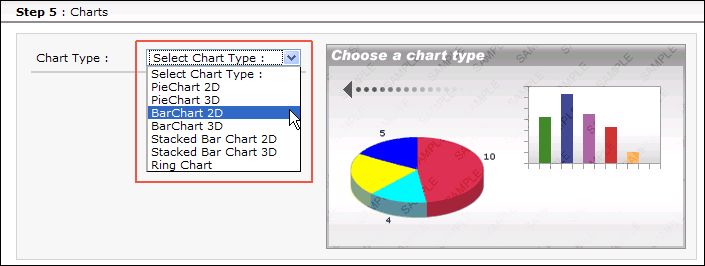
Step 5: Charts
Choose the chart type to show the result in graphical format.
-
Clicking the Charts title opens the choose a chart type page.
-
Select the Chart Type from the combo box. Say, Pie chart or Bar chart and so on. On selecting the chart type a model chart type is displayed on the right hand side of the page.
-
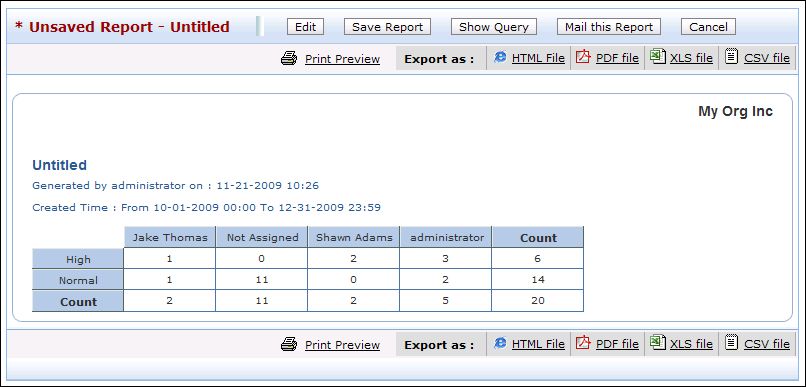
Select Rum Report >> button. On running the report you get a tabular report as well as the graphical view for the selected column data.
Generating Matrix Reports
Matrix reports provides the data in a grid manner (m x n format). It allows you to study different scenarios based on the chosen criteria. If you have selected the Report Type as Matrix Report, follow the steps below,
Step 1: Select Column to Group
You have simple grouping and advanced grouping option for matrix reports.
Simple Grouping
-
Click the Simple tab. A sample matrix is displayed with options to select the Top column information and left column information. Both are mandatory fields
-
Select the Top column information to be displayed in the report.
-
Select the Left column information to be displayed in the report.
-
You can Summarize the columns by Count, Average, Minimum or Maximum value Of the Request ID or the Elapse Time.
Advanced Grouping
-
Click the Advanced tab. In Advance Matrix Report you have Column Grouping and Group by options. Both are mandatory.
-
Select the Columns and Date format from the drop down.
-
You can group the matrix in tree levels by selecting the respective levels under Group By column.
-
You can Summarize the columns by Count, Average, Minimum or Maximum value Of the Request ID or the Elapse Time.
Step 2: Filter Options
On selecting the columns to be displayed in the reports, you need to specify the Filter Options for the columns.
-
Click the Filter Options title.
-
Specify the Date Filter by selecting the Column, Day and Date.
-
If you wish to add Advanced Filtering, select the Column Name and Criteria from the drop down list. Specify the value by clicking on pick value icon . You can add 'n' number of Name and Criteria and match with AND or OR condition.
-
Click Run Report >> button. On running the report you get a Matrix report for the selected column data.
-
Save the Report.