Introduction to SaaS Manager Plus
Overview of the Dashboard interface
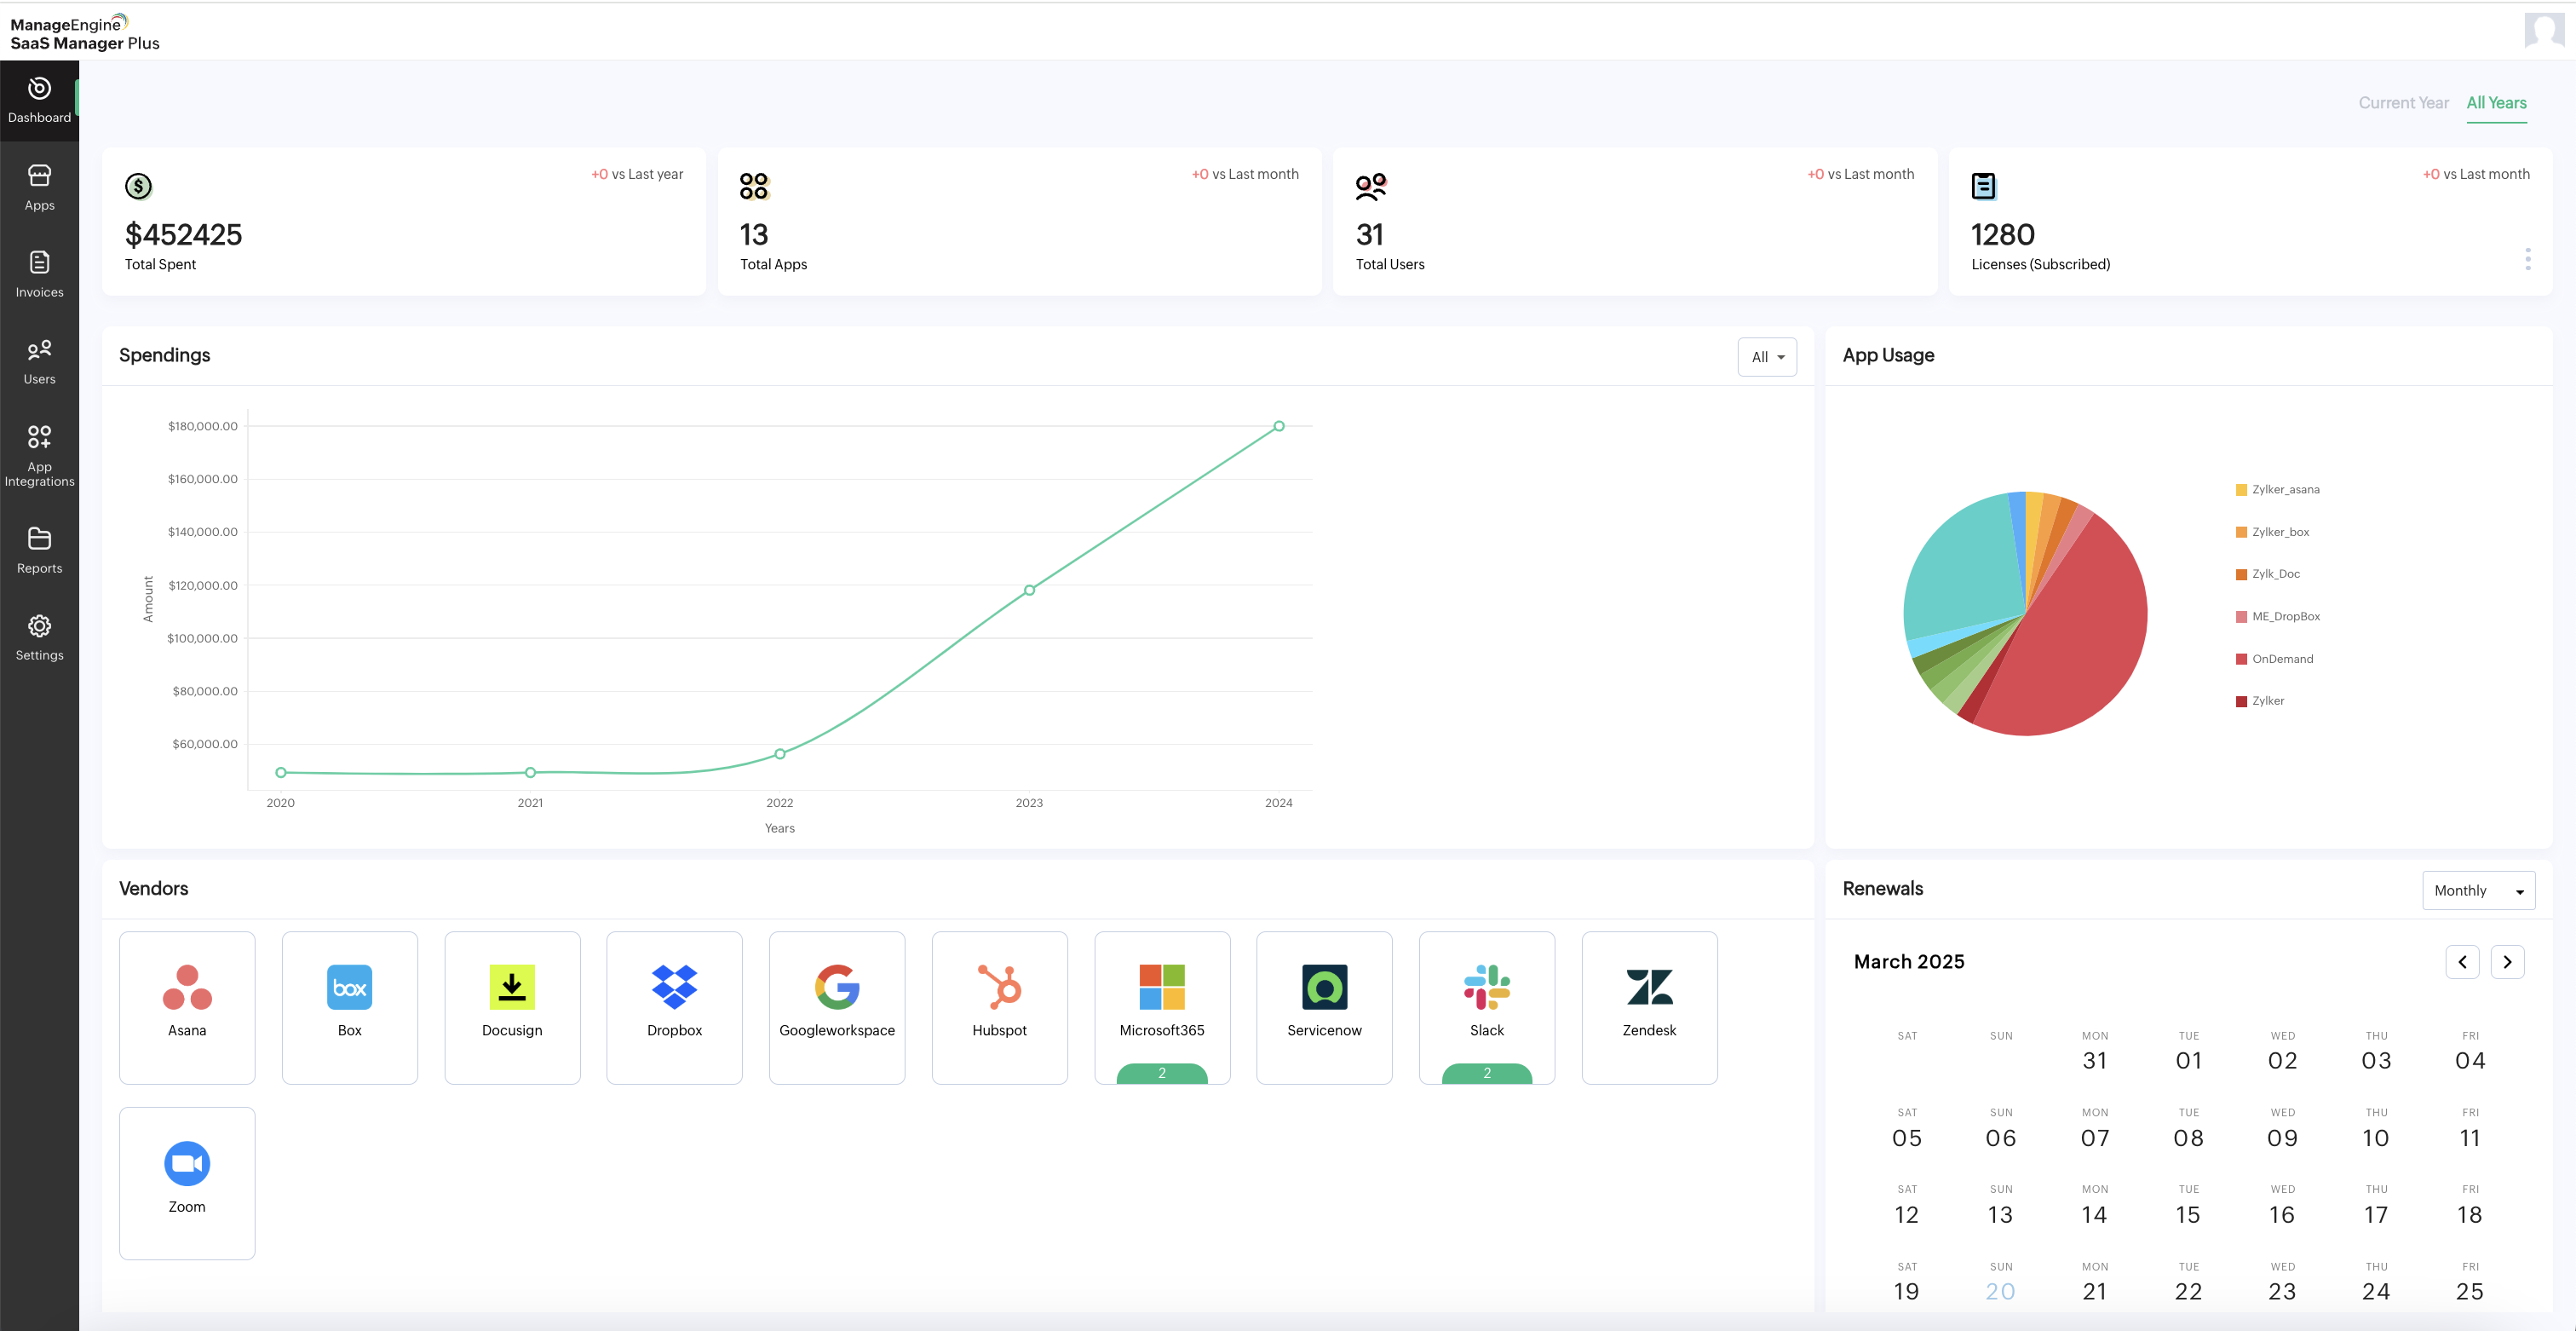
The Dashboard in SaaS Manager Plus provides an intuitive interface to gain insights into your SaaS ecosystem. It offers a comprehensive overview of key metrics and visualizations to help you effectively manage your subscriptions and expenditures.
Key metrics and visualizations
Upon accessing the Dashboard, you will find the following elements:
- Current Year and All Years: These options are in the top-right corner. These options allow you to choose between viewing data for the current year or all years.
- Total Spent: An overview of your total spending on SaaS subscriptions, helping you understand the overall financial impact on your organization.
- Total Apps: The number of subscribed applications in your SaaS ecosystem. It gives you insights into the breadth of software services your organization utilizes.
- Total Users: The total count of users across your subscribed applications, providing an understanding of the user base and potential collaboration opportunities.
- Licenses: This section provides an overview of licenses with three options: active, inactive, and total. It allows you to assess the license status and manage them accordingly.
- Spendings: By selecting the year and month, you can track your total spending over time. This visualization presents a bar graph with Months/Years on the X-axis and Sum(Sales) on the Y-axis. It allows you to analyze spending trends, gain insights, and make well-informed decisions regarding your budget allocation.
- App Usage:This section provides a comprehensive overview of the total number of subscribed users, categorized as assigned and unassigned subscribers. It enables you to monitor user engagement and optimize the utilization of your subscriptions. The data is presented as a pie chart illustrating the percentage of assigned and unassigned users, helping you visualize the distribution and take necessary actions to maximize subscription efficiency.
- Vendors: You can add vendors and view the list of vendors already added. Clicking a specific vendor will display detailed information of that vendor, such as Spending Report, App Usage, Total Spent, User Spent, Subscriptions, and Recent Activities. Use the drop-down box in the top-left corner to toggle between different vendors. Clicking the vendor again will display the detailed Vendor Overview.
- Renewals: This section allows you to track upcoming renewals. Select either the weekly or monthly option from the drop-down box to view the dates when renewals need to be completed. Stay organized and ensure timely subscription renewals.
Navigating the Dashboard provides valuable insights to manage your SaaS subscriptions effectively and optimize your overall SaaS ecosystem.