Working with Tables
A ManageEngine Analytics Plus workspace could contain a collection of tables. Two tables could be related to each other using lookup columns, thus enabling you to model a relational workspace (Refer Relating tables using Lookup columns). You can create any type of report over these tables which contain the actual data.
Type of a column defines the nature of values a column can contain and the operations that can be done over the same. e.g., an Age column could be "Positive Number" type.This column can contain only positive numbers and you could apply arithmetic operations over the same.
Table Operations
- Searching
- Filtering
- Sorting
- Find and Replace
- Show/Hide Columns
- Freeze Columns
- Reorder and Resize Columns
- Split columns
- Custom Sort
- Changing the column properties
- Copying a Table
- Exporting a Table
- Sharing a Table
- Publishing a Table
ManageEngine Analytics Plus offers a range of interactive options to work with a table. Some of the options include Filter, Sort, Format, Find and Replace values, Freeze, and Show/Hide Columns. ManageEngine Analytics Plus also allows to Export, Share and Publish a table.
Note:
- These options will be enabled only to users who have been provided with appropriate permissions during sharing by the Administrator. Refer to the topic Sharing and Collaboration to know more about sharing.
Searching
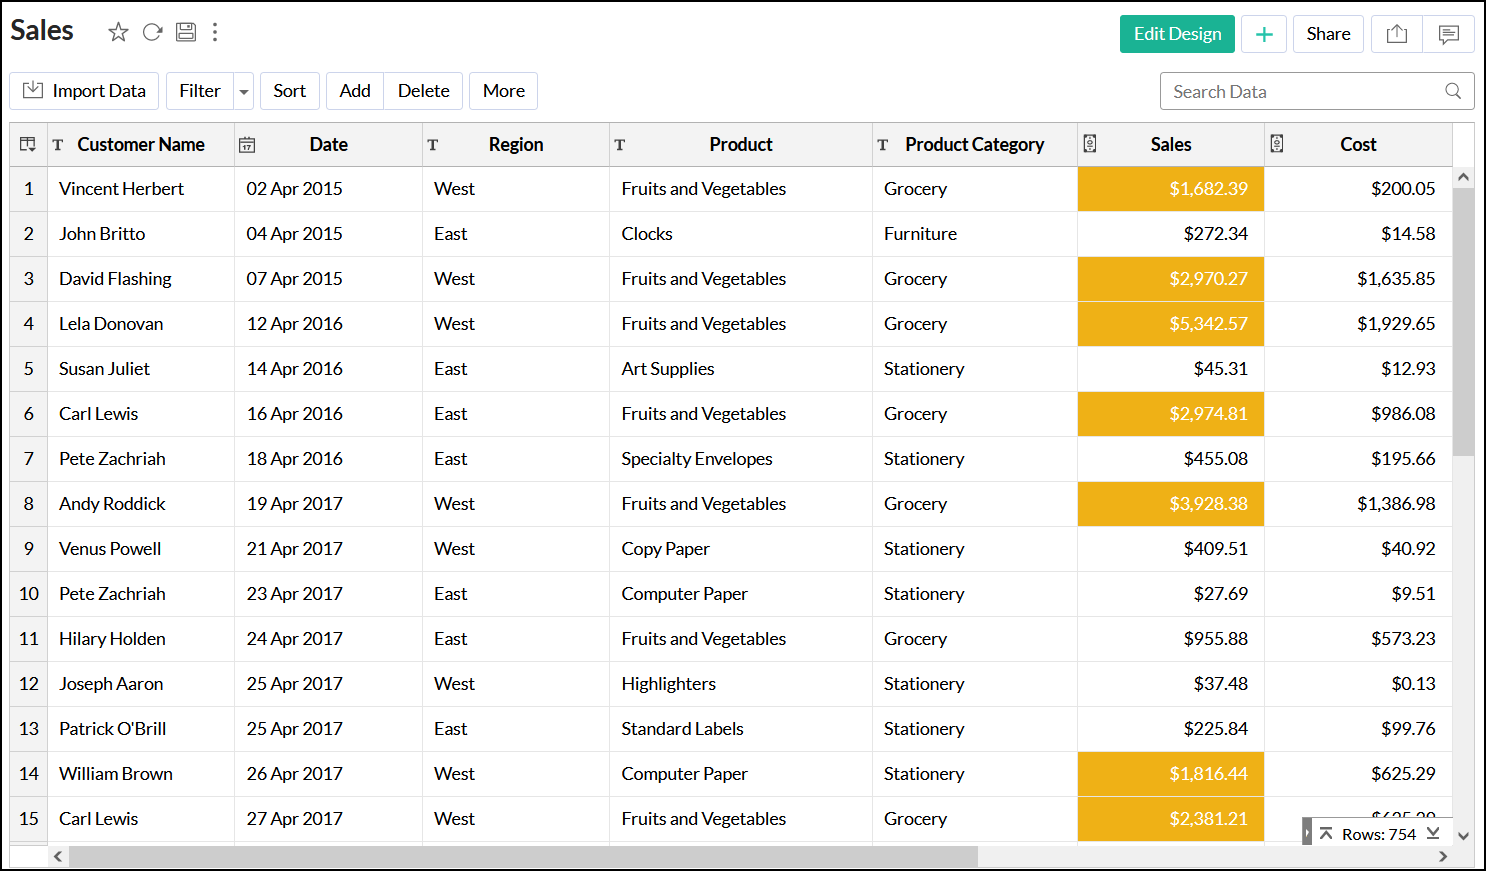
ManageEngine Analytics Plus allows you to quickly search for specific records within a large set of data. The search box on the toolbar can be used to locate records in a table that matches the keyword that you specify.
To search for records, type the keyword that you want to search for in the search box and click on the magnifying glass icon next to the search box. All the records containing the specified keyword will be filtered and displayed as shown below. Note that the search operation will search across data contained in all columns of the table.
Filtering
ManageEngine Analytics Plus provides a Filter option to easily filter records in your table based on criteria that you specify. Depending on the data type of the column, ManageEngine Analytics Plus offers various filtering options like filters based on specific numeric ranges, date ranges, individual values, partial match, etc. ManageEngine Analytics Plus also allows you to filter on multiple columns at a time.
Filter Pane Options:
Following is a brief description of various options provided in the Filter Pane when you apply filters.
- Hide: Click this option to hide the filter pane. You can also use icons at the column header to hide/show the filter pane.
- Clear: Click this option to remove all the filters applied.
- Save/Save as: Click this option and type the name in the dialog box that appears to save your filter for later/repeated use. How to save a filter for repeated usage is discussed below.
- Delete Rows: Select this option to permanently delete the filtered rows from the table.
Sorting
ManageEngine Analytics Plus allows you to rearrange rows in a table by sorting values in one or more of its columns. You can sort a column numerically, alphabetically, or by date depending on its data type. For example, you can sort a column of dates by their date order, while a column of numbers can be sorted numerically.
The sort options available in ManageEngine Analytics Plus are:
- Sort Ascending - Sorts text data in ascending alphabetical order (A to Z), numbers from smallest to largest (0-9), and dates from oldest to latest.
- Sort Descending - Sorts text data in descending alphabetical order (Z to A), numbers from largest to smallest(9-0), and dates from latest to oldest.
Refer to the following video to sort a table:
Find and Replace
The find and replace option can help you to locate a value in a column and replace it with another value. This feature can be very useful especially when you are working with large sets of data and have the need to quickly correct/rectify issues in your data set.
Note:
- This option will be enabled only to users who have been provided Write permission by the Administrator.
Options in the Find and Replace
- Bulk Update: Select this option if you want to replace all the values in the column with the value specified in the Replace With text box. On selecting this option the Find what text box will be disabled.
- Match entire cell contents: Select this option to limit your search results only to cells whose entire contents match with the Find What value that you have provided. This option is selected by default for number and currency type columns.
- Do not replace null values: Select this option when you do not want to replace existing null values in the column with the value specified in Replace With. This is applicable only when you use the Bulk Update option
Couple of Points to Note:
- Find & Replace operation is Case Sensitive i.e., upper and lower letters are not considered as equivalent.
- To find a cell with an empty/null value or to replace a cell value with an empty/null value you have leave the corresponding boxes empty.
- Currency (Ex:-$) and Percentage(%) symbols cannot be used in Find & Replace fields for currency and percentage data types.
- Find & Replace will be applied over Filtered data if you have already applied a Filter on the table
Show/Hide Columns
ManageEngine Analytics Plus lets you show or hide columns in a table view.
Freeze Column
The Freeze Column option allows you to keep specific columns always visible in the table even when you scroll horizontally across the screen. For example, you can freeze columns that identify the records (Ex:- Customer Name, Product ID) in a table so that you can keep track of a record that you are looking for, even when you scroll off to the right-most column in the table.
Reorder and Resize Columns
ManageEngine Analytics Plus allows you to rearrange the order of columns in a table using drag and drop.
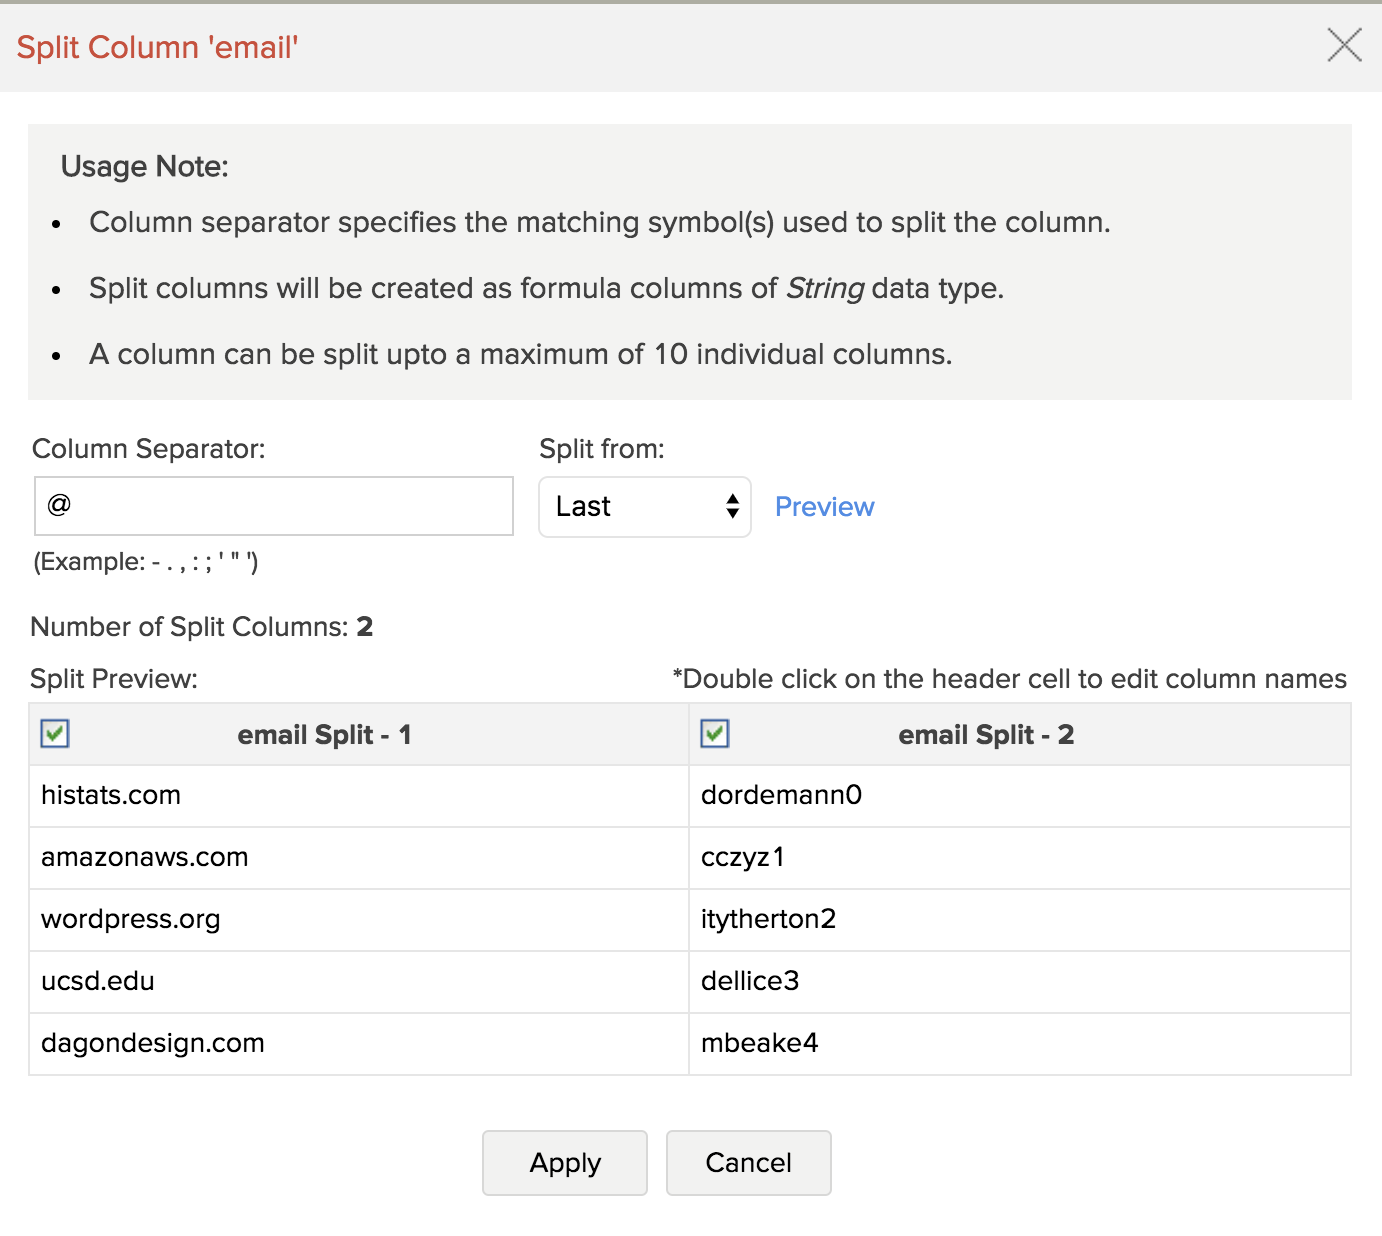
Split a Column
- Text
- Multiline
- URL
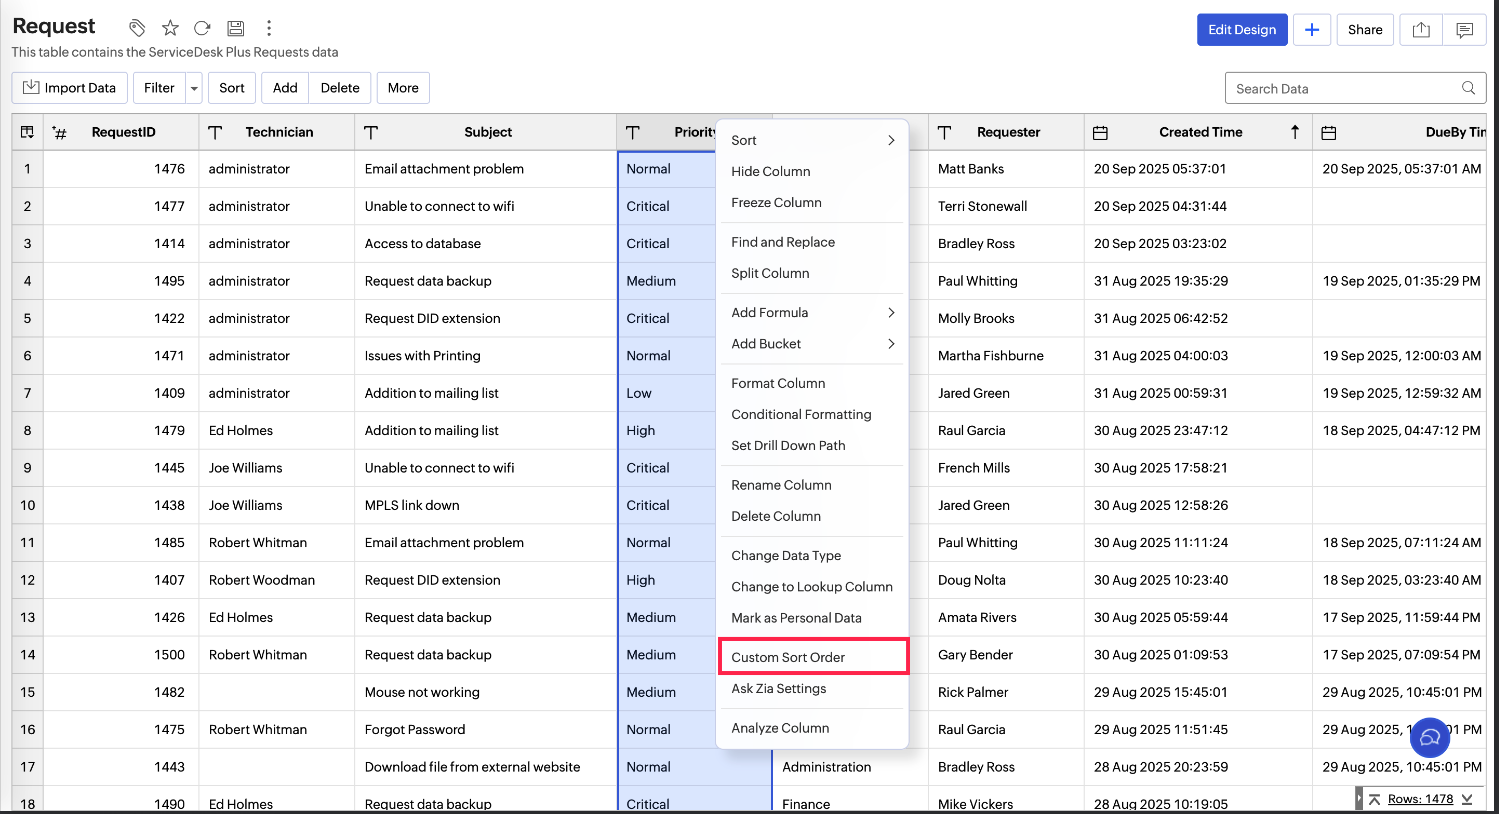
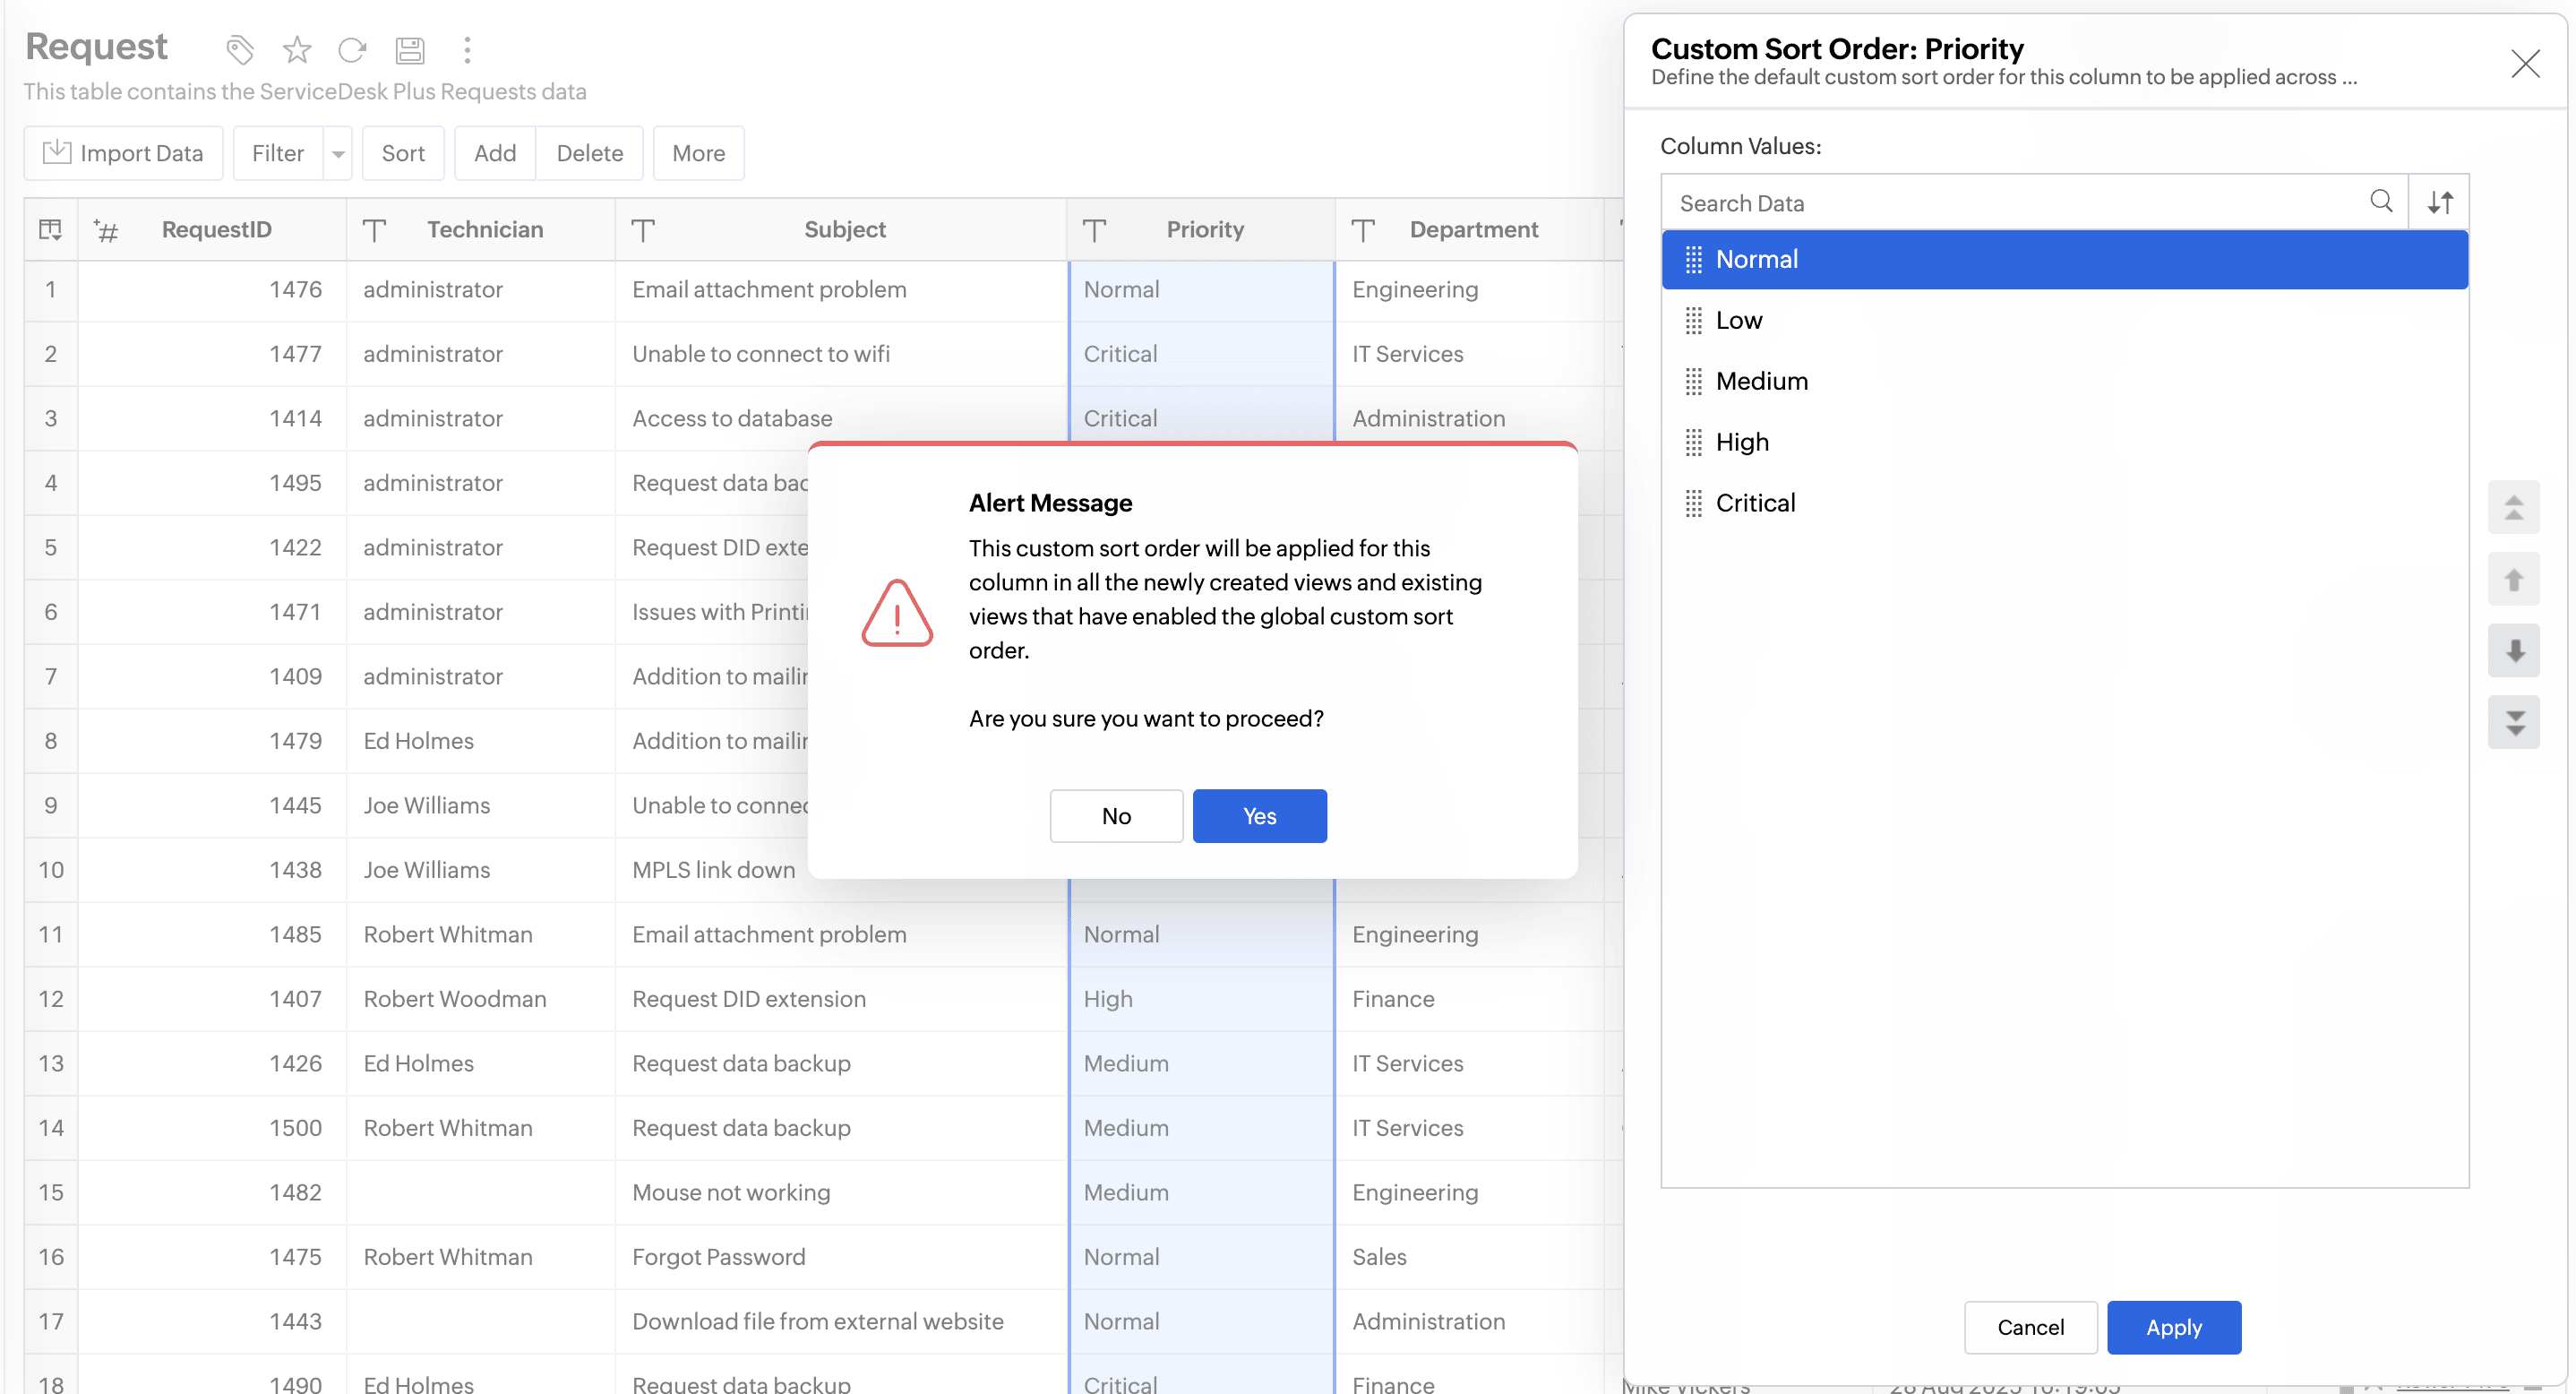
Custom Sort
The Custom Sort option for Text data types allows you to define the sorting order to be applied. This order is applied globally to all reports that are created using this column.
To apply custom sort,
1. Select the column and click More and choose Custom Sort from the drop-down menu.
2. To define the Sort order
Use the drag handle icon to move values up or down and arrange them in the required order.
Use the arrow icons to move values up or down one position at a time.
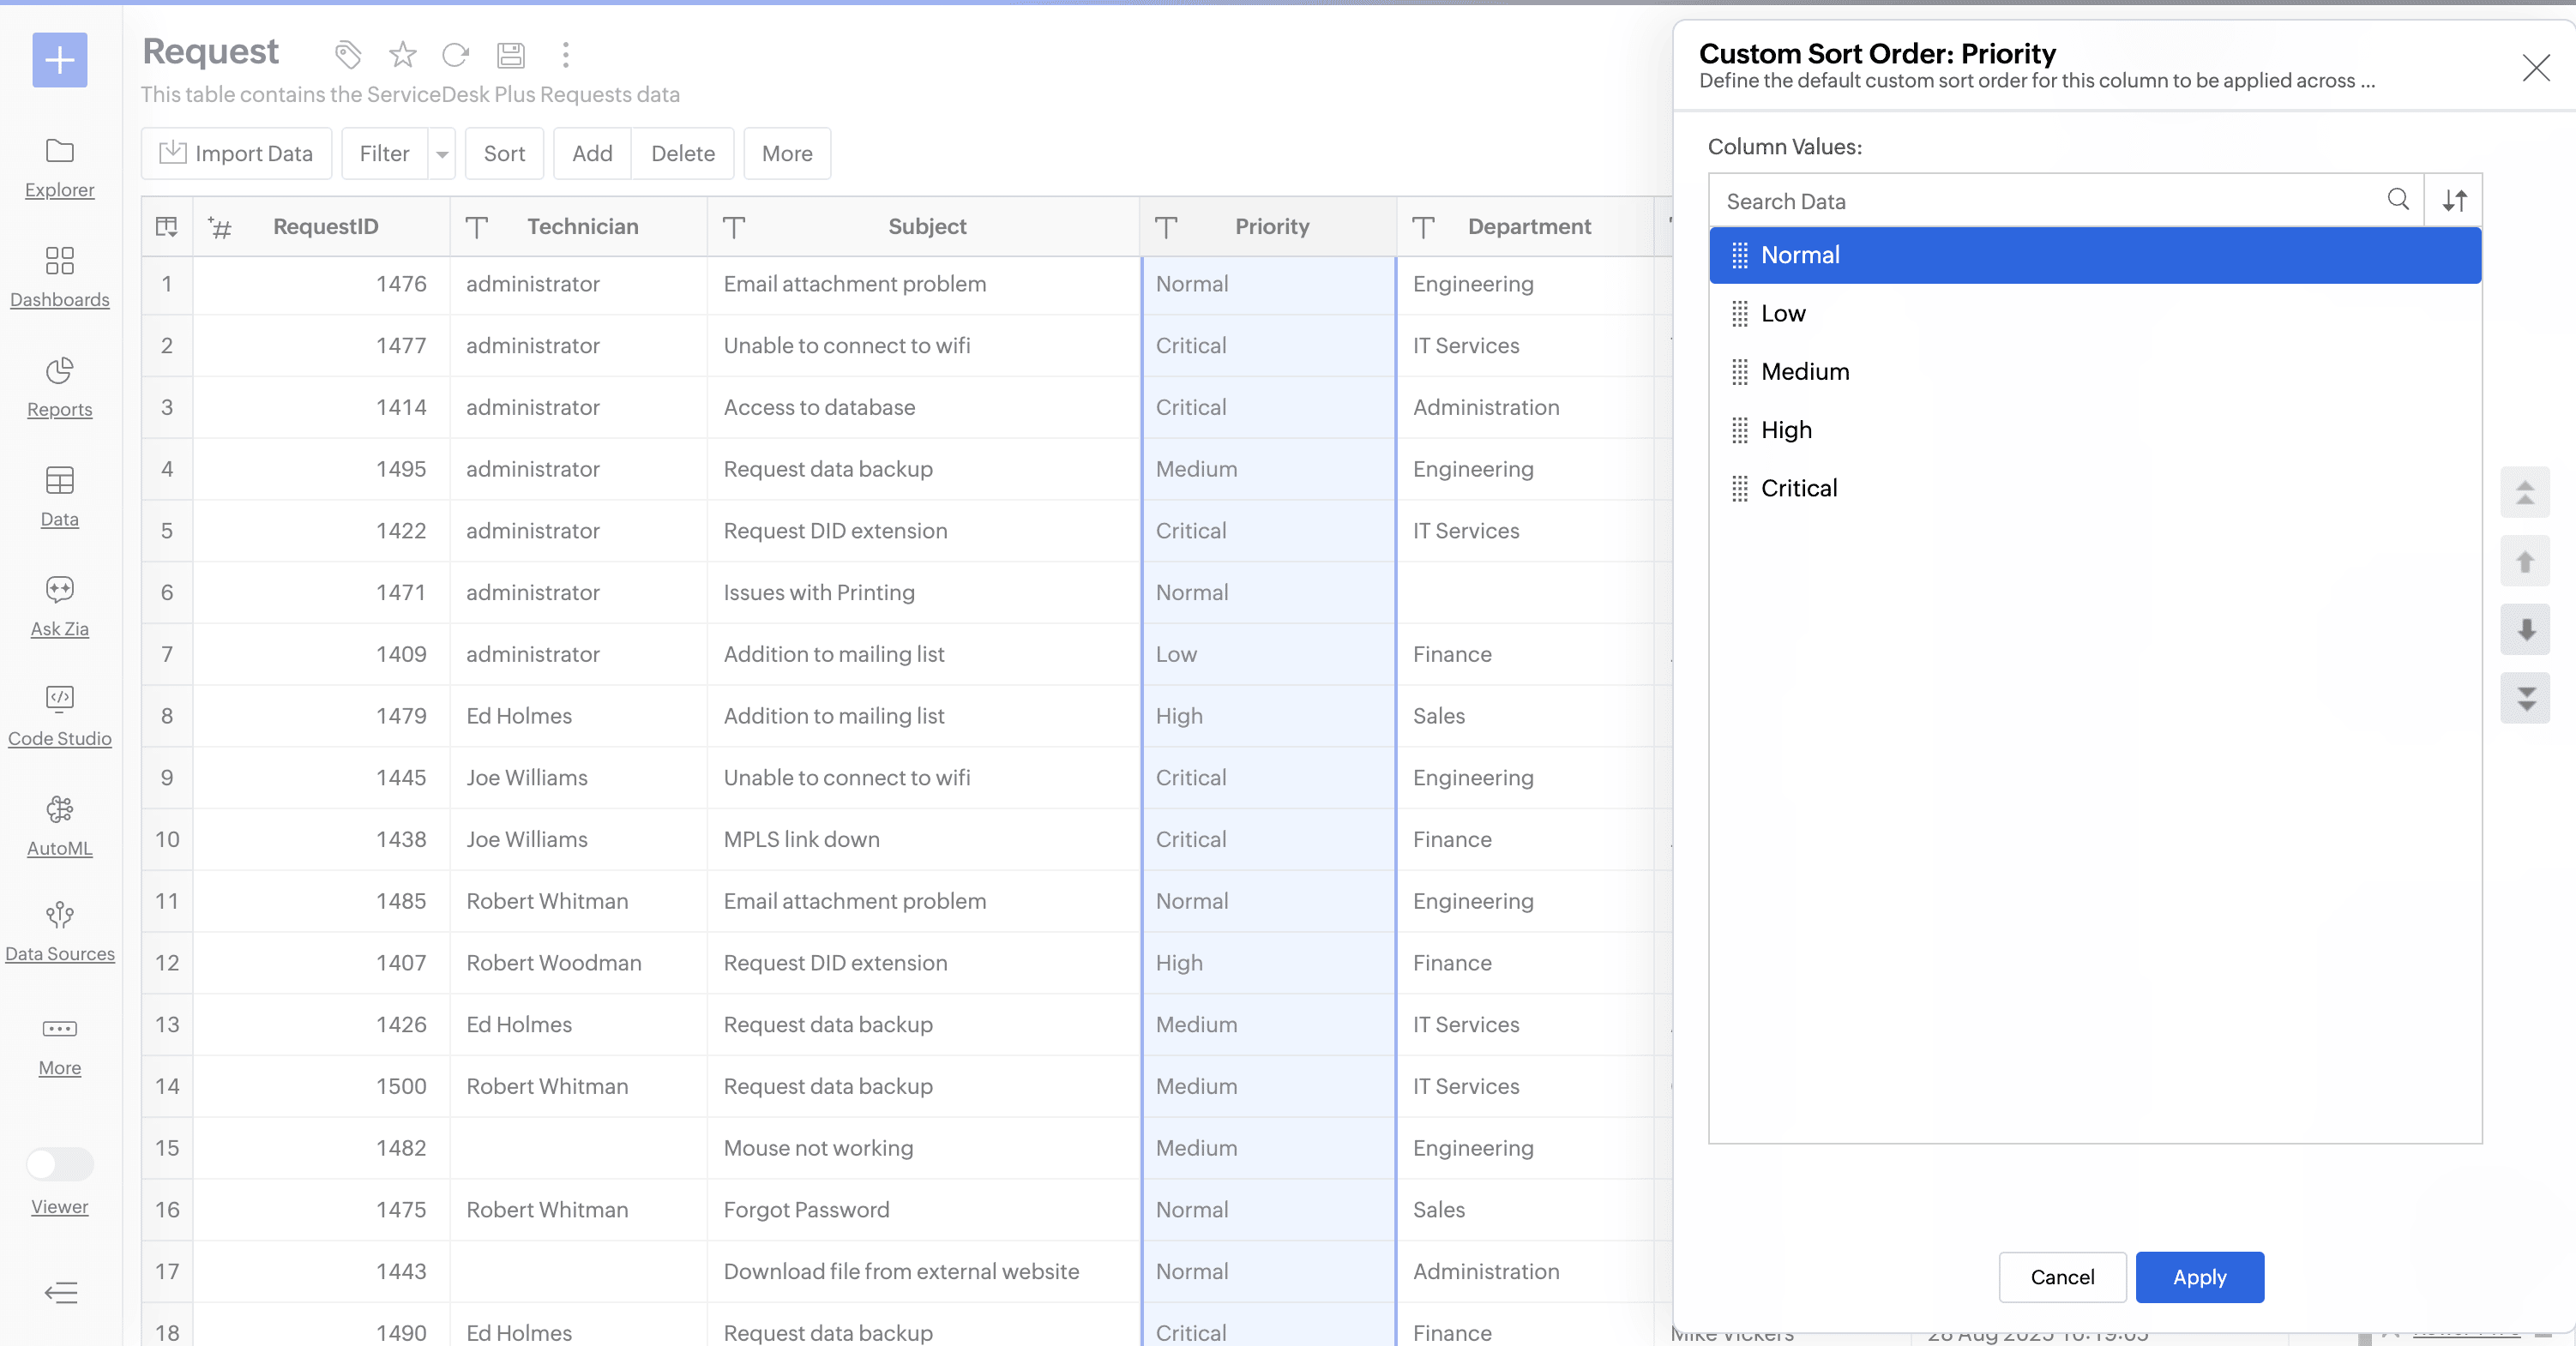
3. Click Apply.
4. A confirmation message to confirm the choice will be displayed. Click Yes.
Note :The custom sort order can also be defined while creating reports. Refer to Custom Sorting in reports section to learn more.
Changing the column properties
Analytics Plus lets you change the properties, such as format, name, data type, etc., of a column at any time. Refer to the following sections to learn about each option in detail. Please note that the changing column properties option is disabled for shared users.
Format a column
Formatting options
| Numeric Data Type | |
| Option | Description |
| Alignment | This option allows you to align the cell values horizontally in the Left, Right, and Center positions. |
| Units | This option enables you to format the unit values in any one of the following ways:
|
| Separator | This option allows you to select a separate for decimal and thousands.
|
| Currency Symbol | This option enables you to choose the type of currency symbol from the drop-down list. This option applies to currency type columns. |
| Negative Number Display | This option allows you to specify the format to display negative numbers. You can either choose Within Parenthesis [-25 as (25)] or With Negative Sign [-25 as -25]. |
| Decimal Places | This option sets the number of decimal places to be displayed for decimal, currency, and percentage columns. |
| Date Data Type | |
| Alignment | This option allows you to align the cell values horizontally in the Left, Right, and Center positions. |
| Choose Date Format | This option lets you select a format to display the date values from the list of available formats. You can also specify a custom date format if the required format is not available in the default list. |
| Duration Data Type | |
| Alignment | This option allows you to align the cell values horizontally in the Left, Right, and Center positions. |
| Choose Duration Format | This option lets you choose the duration format from the available formats. You can also specify a custom format. Click here to learn more about constructing a custom duration format. |
| String or Category Data Type | |
| Alignment | This option allows you to align the cell values horizontally in the Left, Right, and Center positions. |
| URL Data Type | |
| Alignment | This option allows you to align the cell values horizontally in the Left, Right, and Center positions. |
| Alternate Text | This option enables you to provide a substitute reader-friendly text to be shown instead of the actual URL. Click here to learn about the alternate text. |
| Image | This option lets you replace the URLs that point to images with the corresponding images. Click here to learn more. |
Alternate text in tables
The working of alternate text in tables varies for the following operations:
- Sorting: For a URL data type column, Analytics Plus performs sorting based on the actual URLs in the column.
- Copy and Paste: When you copy and paste the alternate text in a column, Analytics Plus pastes the actual URL corresponding to the column.
- Exporting: While exporting a view with an alternate text, Analytics Plus exports the actual URLs in the column.
Image URL in Tables
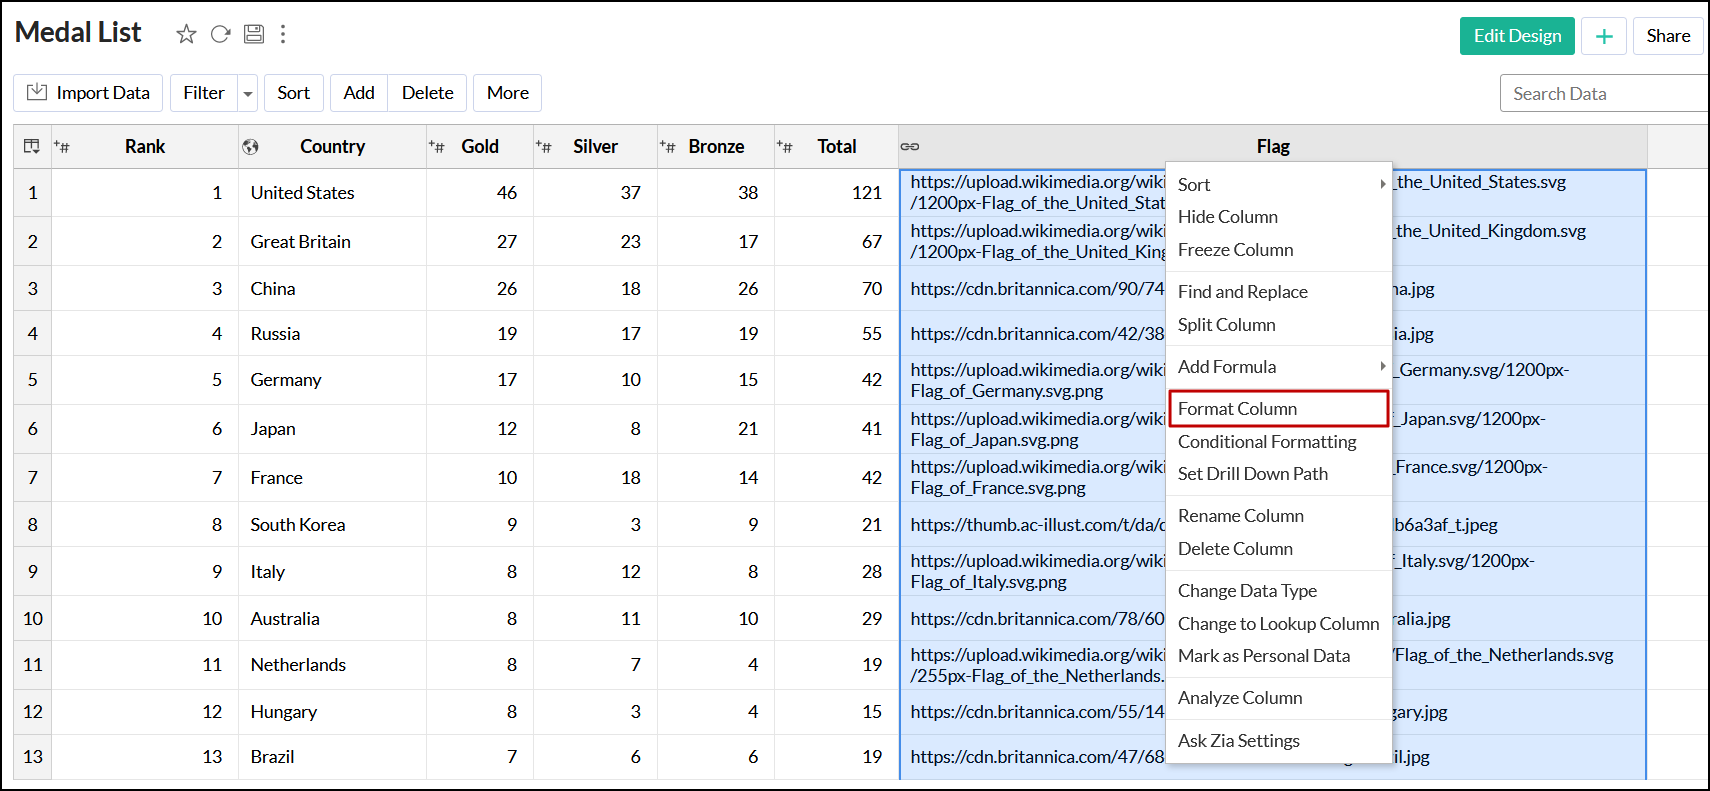
Analytics Plus allows you to convert the image URLs in your table into the corresponding images. Follow the steps below to do this:
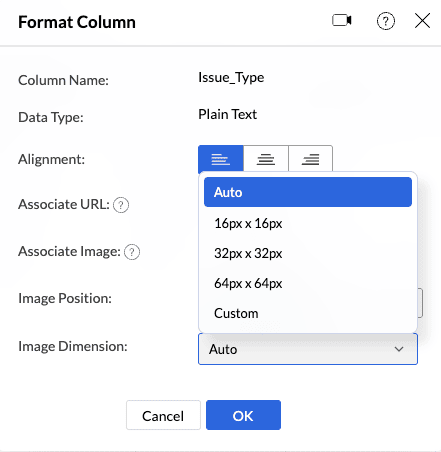
Open the required table, right-click the required image URL column, and select the Format Column option.
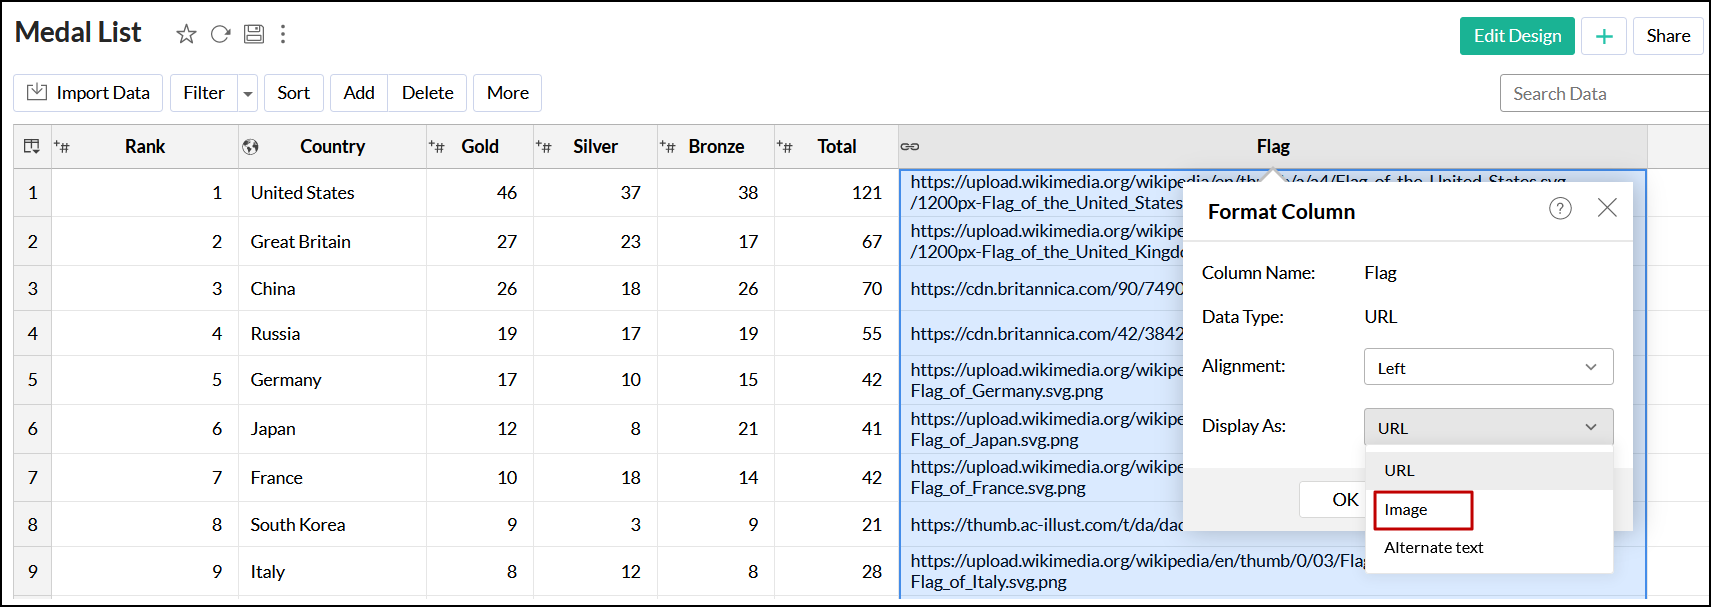
In the popup that appears, choose Image from the Display As drop-down. Please note that the size of the image should not exceed 200 KB.
Choose the required dimension from the Image Dimension drop-down.
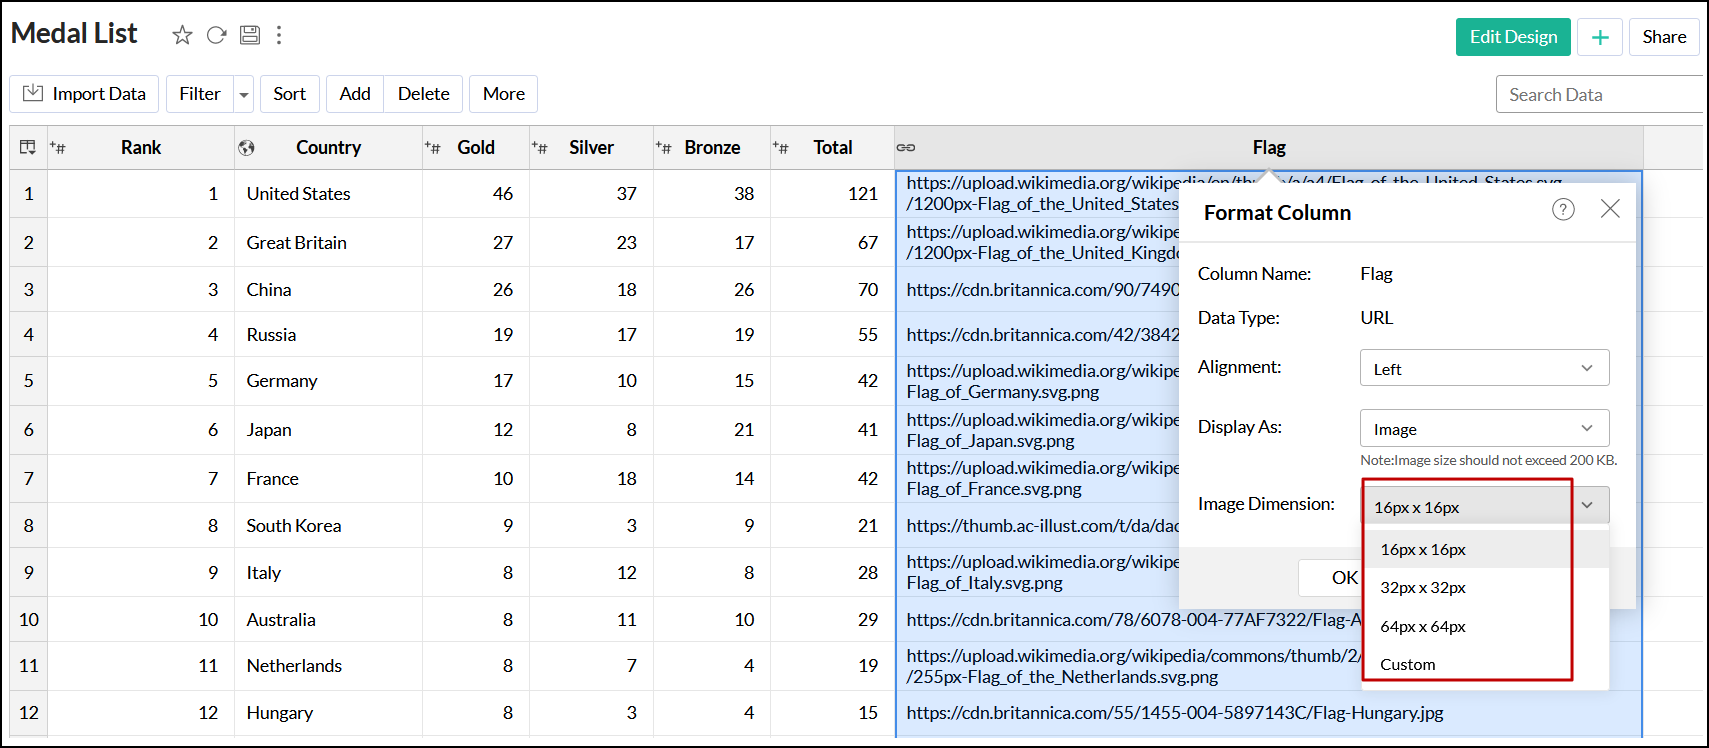
Choose Custom from the Image Dimension drop-down to provide a custom dimensions for the images.
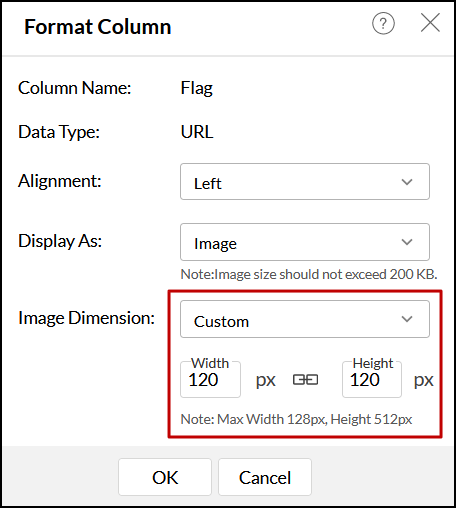
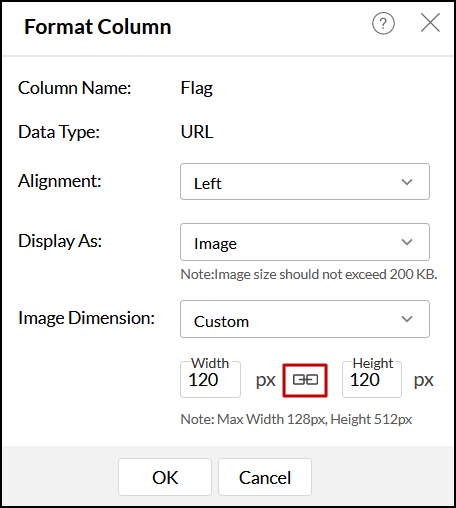
Click the Ratio icon to maintain an aspect ratio between the height and width.
- Click OK to replace the image URLs with the corresponding images in your table.
Note: Export the view in HTML file format to display the converted images while exporting.
Dynamic URL
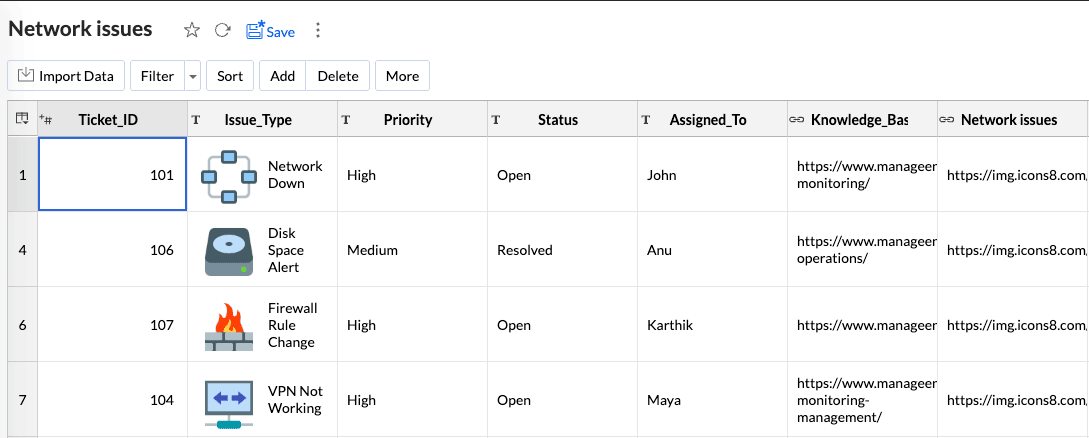
Analytics Plus lets you associate a Plain Text column with a URL column. This enables users to navigate directly to a specific page by clicking the plain text field in a dashboard or report. You can also link an image URL to the Plain Text column, allowing an icon to be displayed alongside the text. This enhances the visual appeal and usability of reports and dashboards.
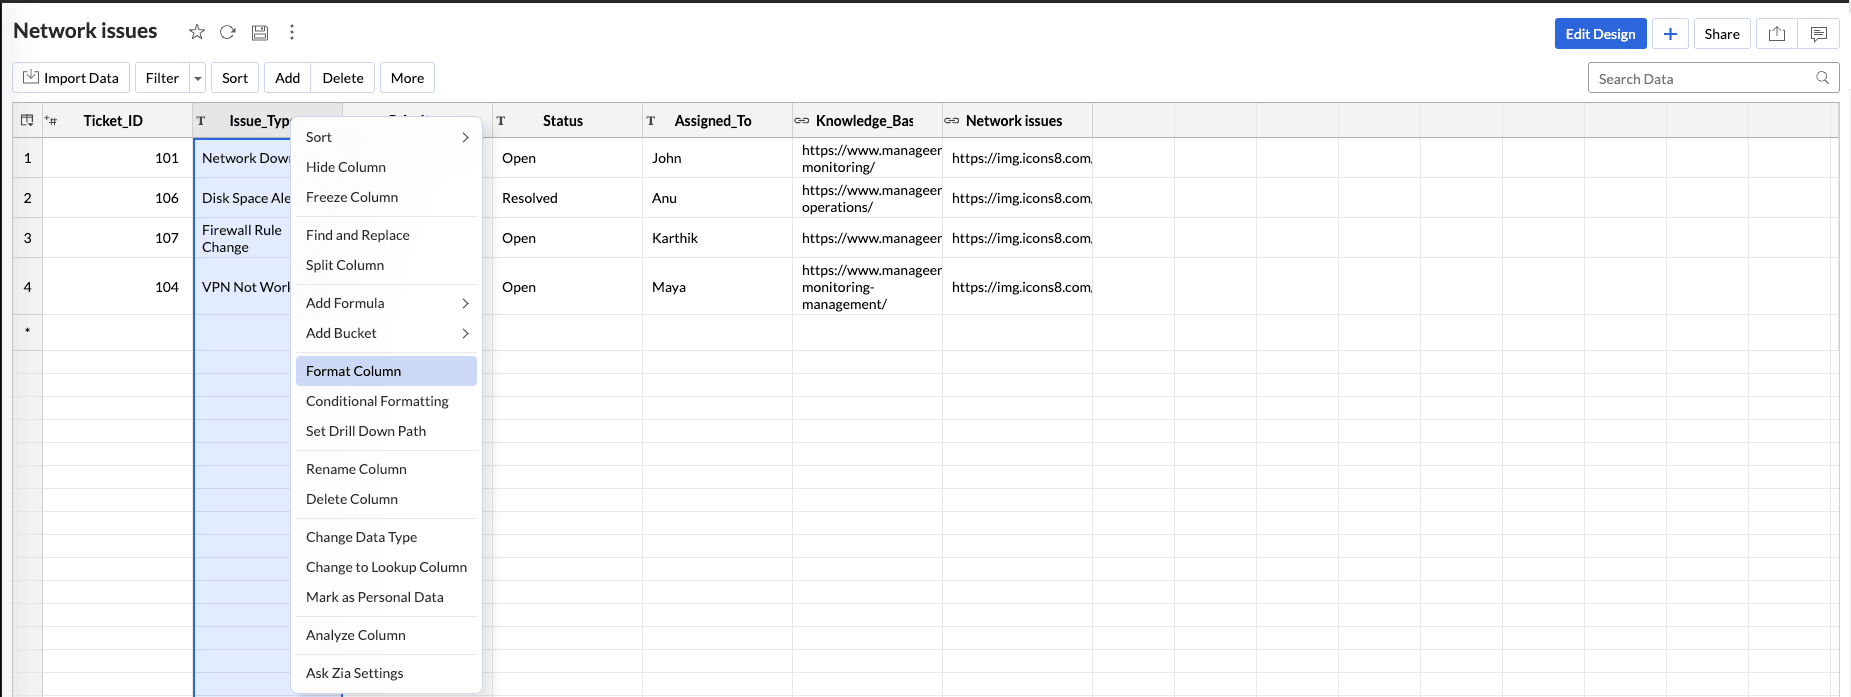
For example, in an organization, issues can be displayed along with relevant icons (e.g., a network symbol for “Network Down,” a disk icon for “Disk Space Alert,” or a firewall icon for “Firewall Rule Change”). These visual indicators help teams quickly identify the nature of a problem without relying solely on text. Follow the below steps to format the column,
Right-click the Plain text column (a column whose data type is plain text) and choose Format Column from the drop-down menu.
Select the Alignment of the text column. Available options are left, right, and center.
Choose the column to hyperlink from the Associate URL drop-down menu.
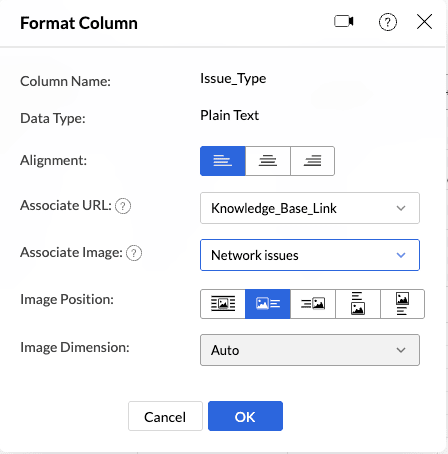
In some cases, you might want to display the image alongside the data and hyperlink it to specific records, such as displaying a product image with a link to access its details. Since image addresses are imported as a URL data type in Analytics Plus, select the same column (Product Image) from the Associate Image drop-down menu that you used for the Associate URL field.
Customize the Image Position as needed. Available options are left, right, center, bottom, and top. The Auto option is selected by default.
Choose the Image dimension or specify a custom Image Dimension.
Click Ok.
Note:
The Associate URL and Associate Image configurations cannot be changed in the report settings.
Association is not supported for Sankey, Sunburst, table and Web charts.
The associated details will be displayed on hover for charts.
Conditional formatting
Analytics Plus allows you to highlight cells in a column with different background and font colors based on a specified condition. When the data in a cell satisfies the condition, Analytics Plus applies the corresponding formatting style to the table cell. To apply conditional formatting, follow the steps below.
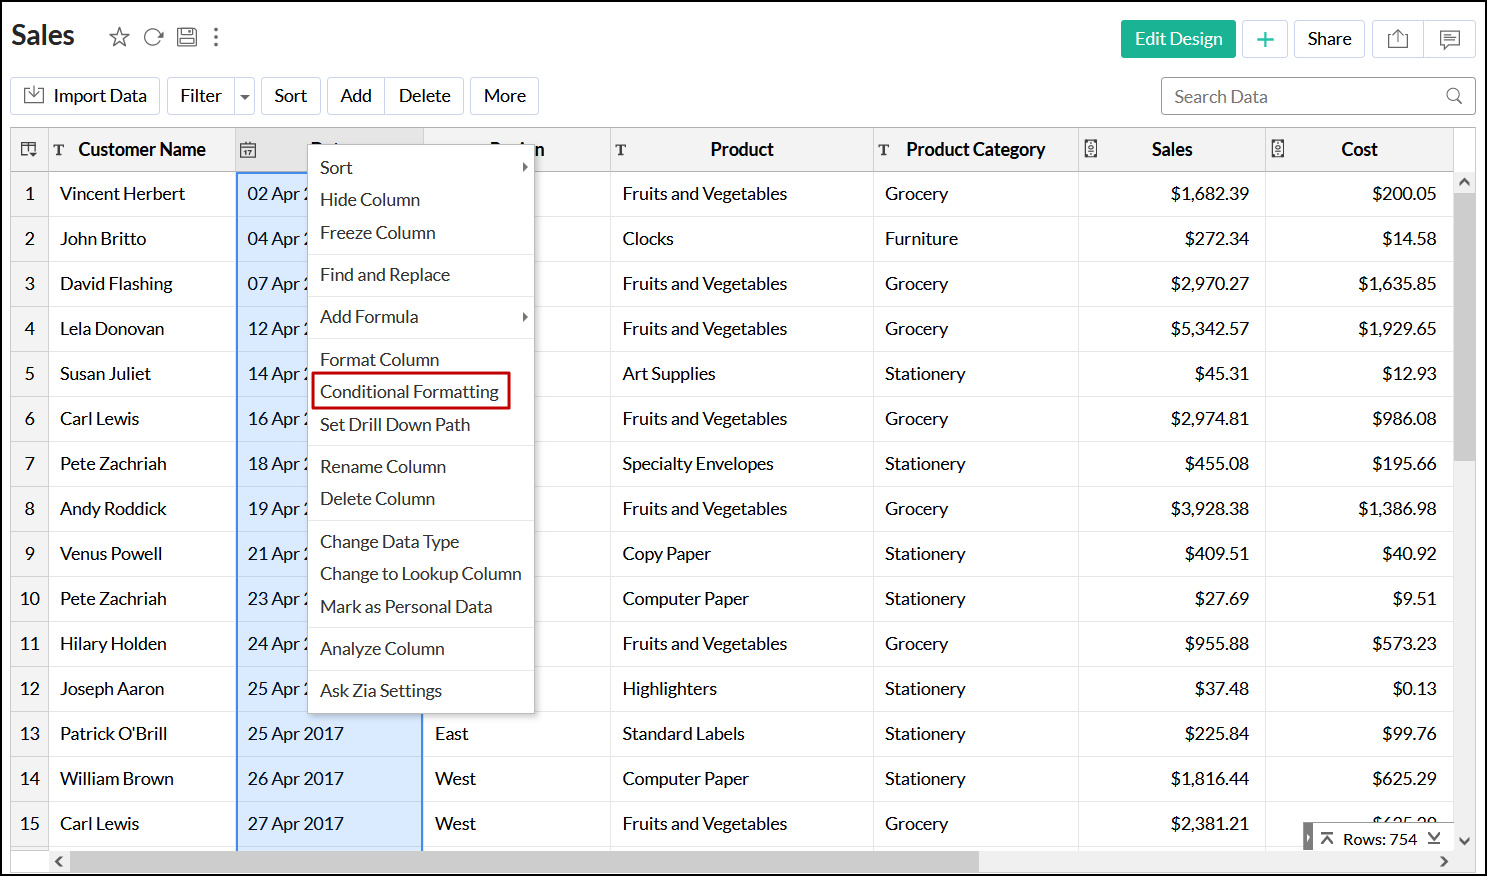
- Click the required column header to select a column.
Click More > Conditional Formatting from the toolbar or right-click and select Conditional Formatting.
- In the dialog that appears, configure the following options:
- Condition: Select the type of condition you want to apply from the drop-down.
- Value: Provide a matching value to use for the condition in the corresponding text box.
- Font Color: Click the font color box to select the required font color.
- Background Color: Select the required background color.
- Reset: Click the Reset link to reset the condition to default.
- + Add Another Rule: Click this link to add more conditions.
Click OK.
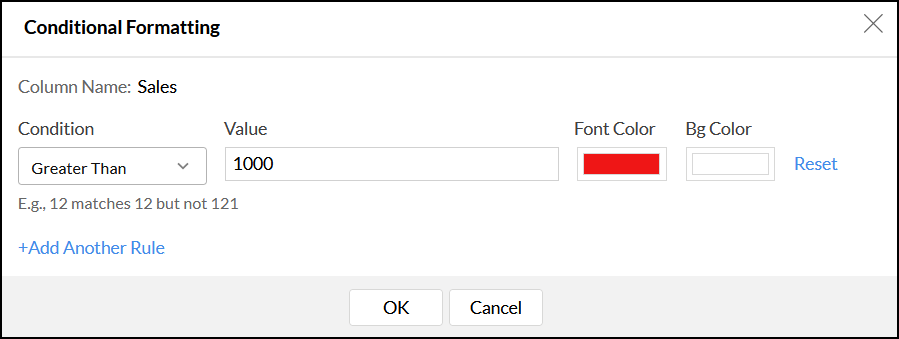
The table cells that satisfy the specified condition are formatted based on the configured options.
Set chart drill down path
Analytics Plus allows you to scrutinize the chart data for powerful exploratory analysis. You can just click any data point in the chart and visualize the underlying data as a new chart.
You can set the drill down path for any given column in the table or query table. For Date columns, Analytics Plus automatically sets a default path. However, you can also change this as needed. Follow the presentation below to learn about configuring and using chart drill down.
Rename column
Analytics Plus allows you to rename the column names in tables in the following two ways.
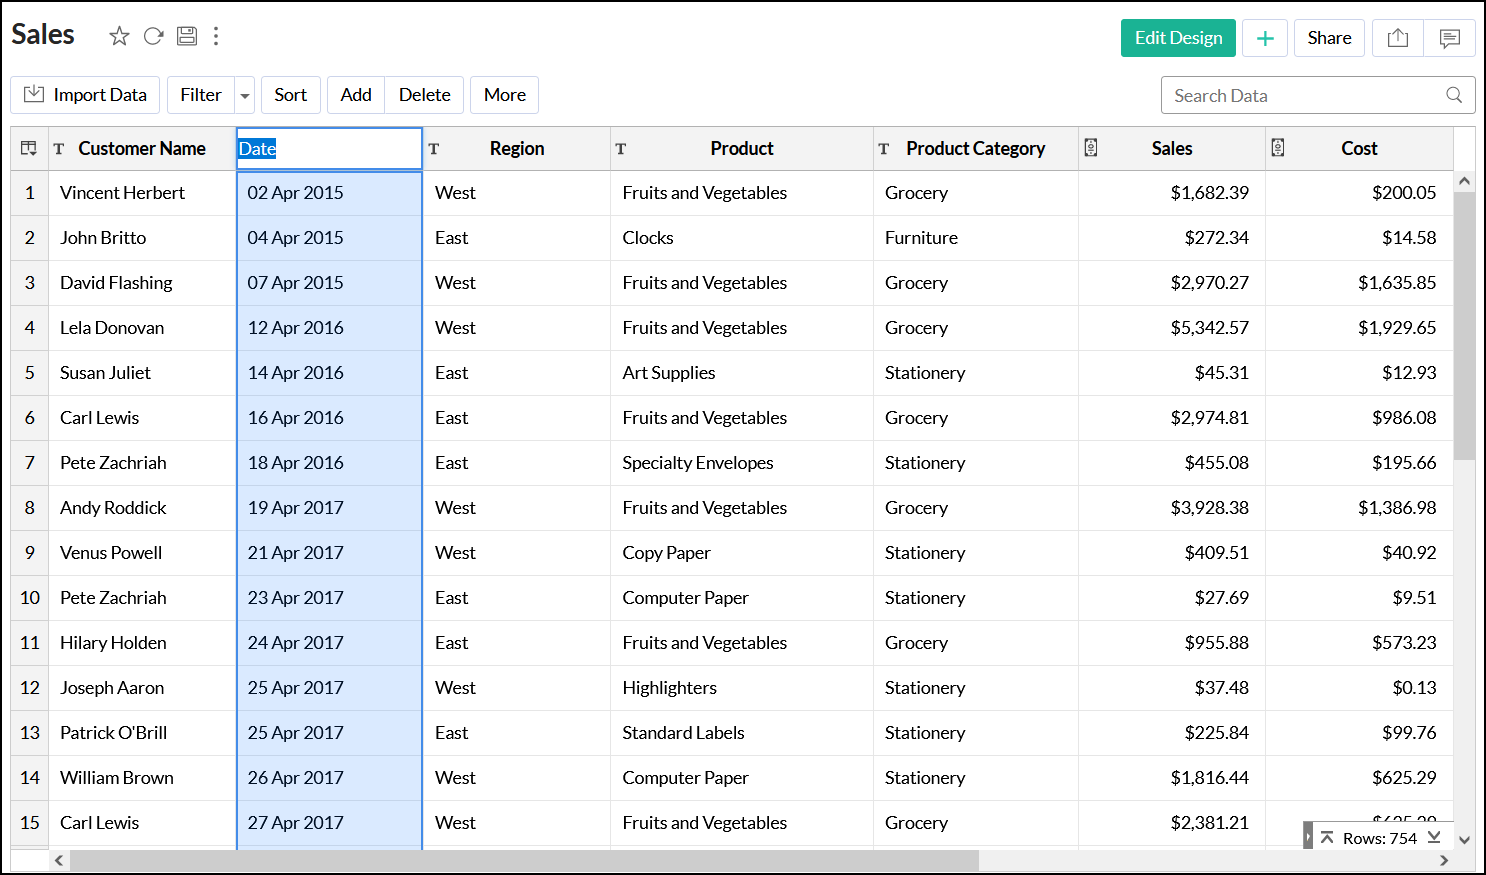
Option 1: Open the required table, double-click the column header and enter the new name for the column.
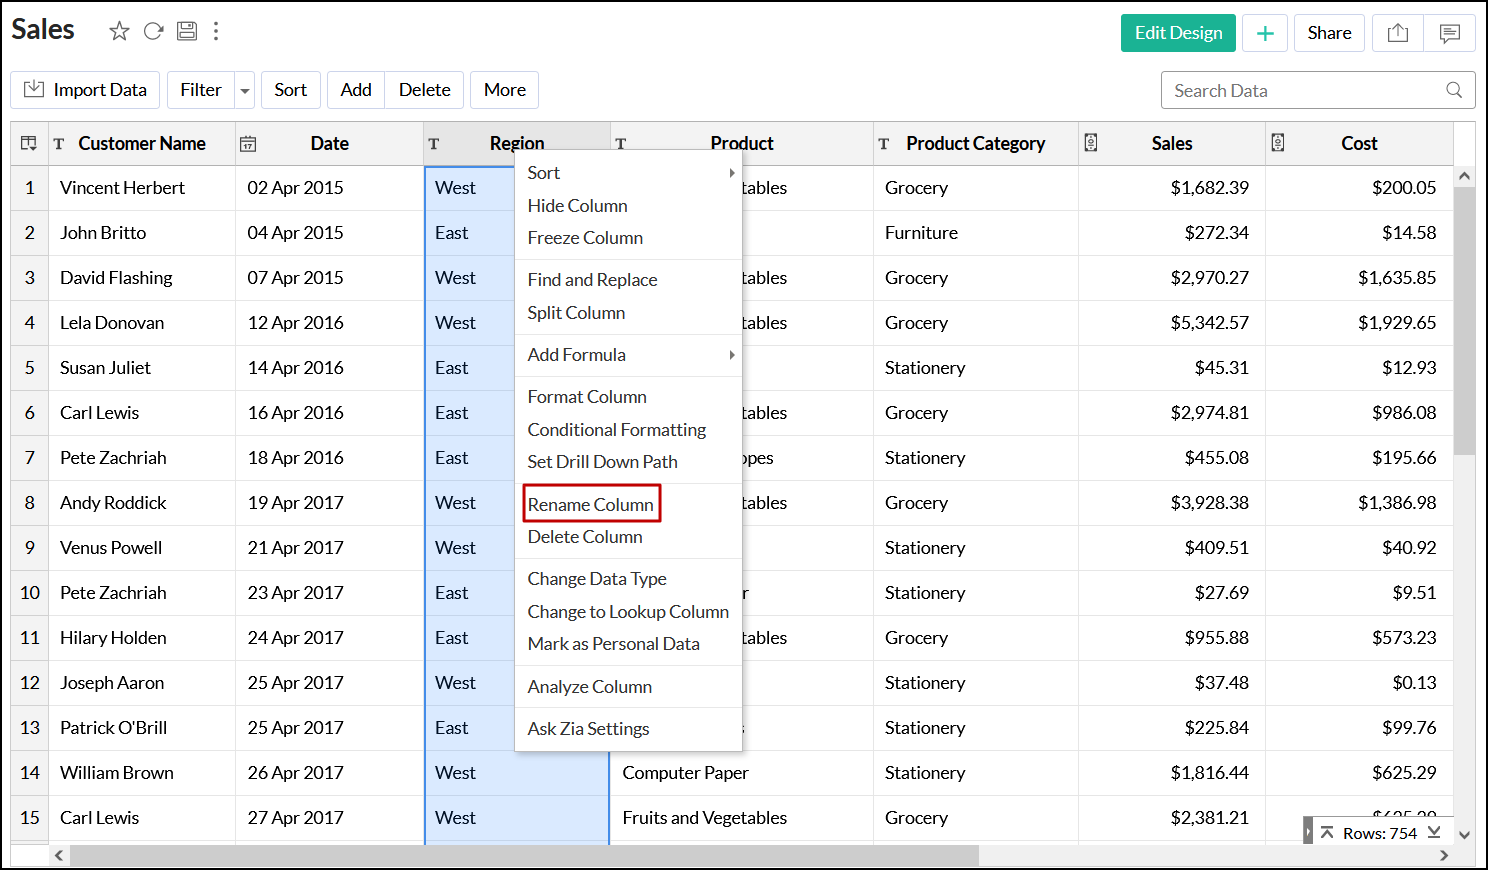
Option 2: You can also right-click the column and choose Rename Column.
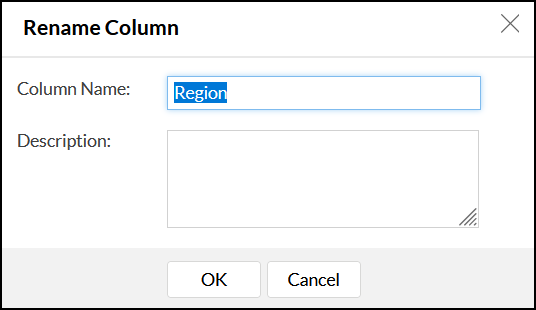
In the dialog that appears, enter the Column Name and Description. Click OK to rename the column name.
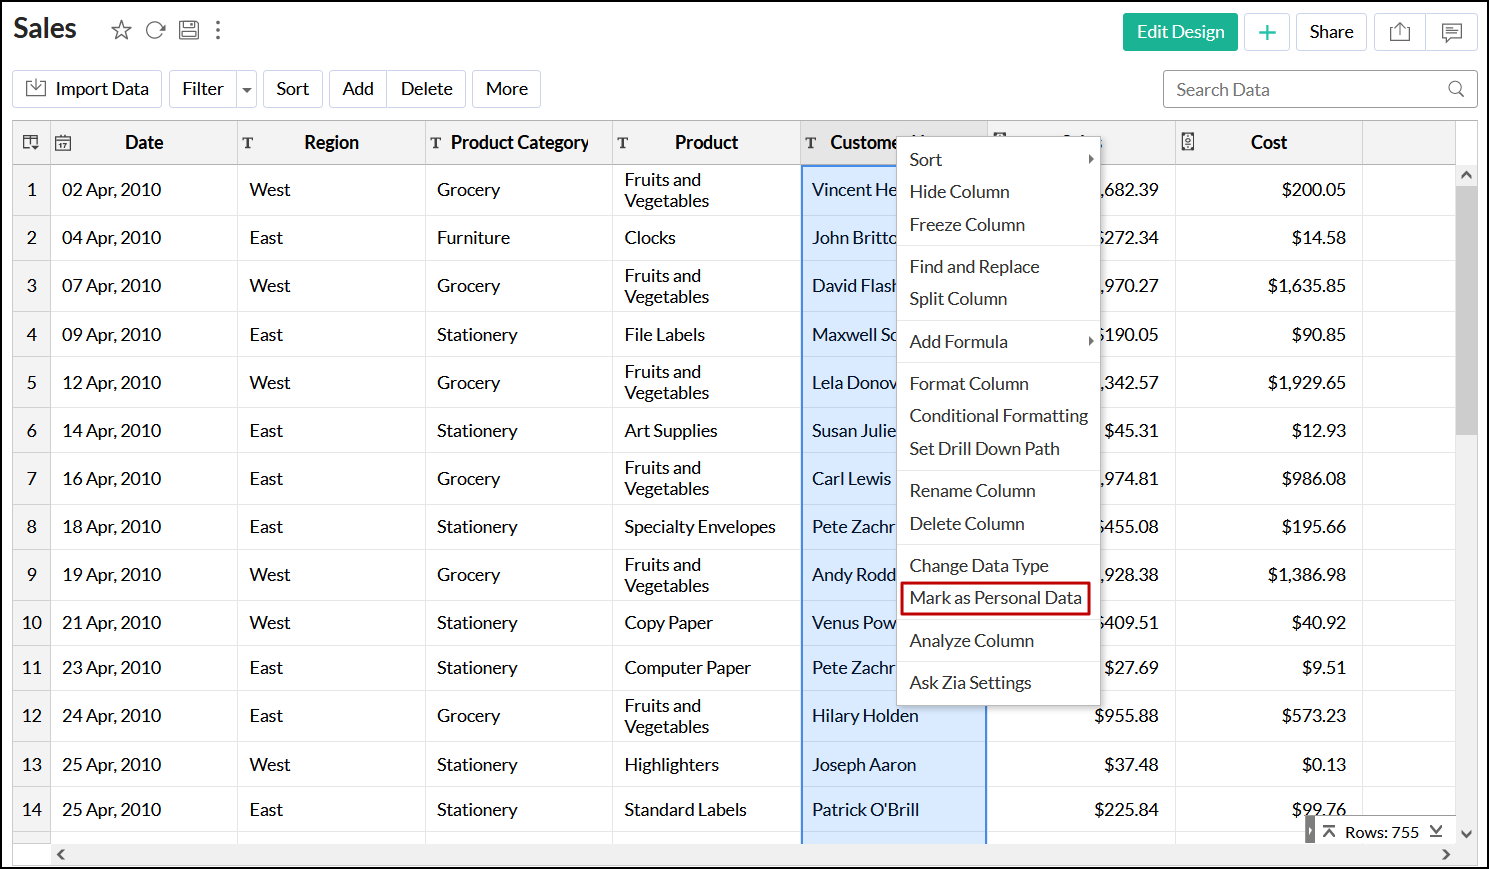
Marking columns as personally identifiable information
Analytics Plus allows you to securely handle the personal information in the table by marking them as Personally Identifiable Information (PII). It could be any information that potentially identifies an individual.
To mark a column as PII, right-click on the required column and choose Mark as Personal Data. In the pop-up that appears, click Yes.
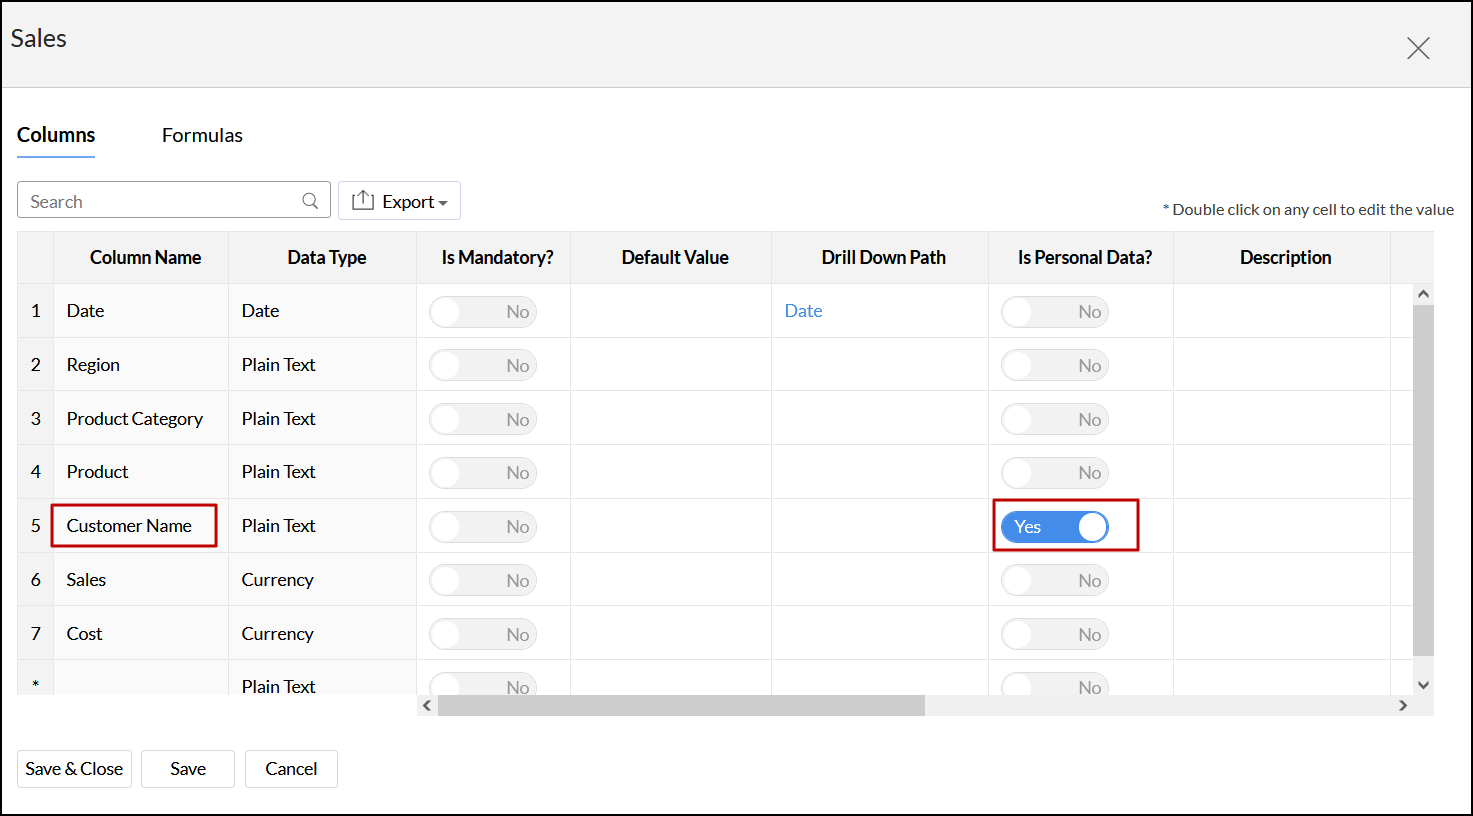
You can also navigate to the Edit Design mode and set the Is Personal Data value of the corresponding column to Yes.
Change the data type of a column
Changing a column to lookup
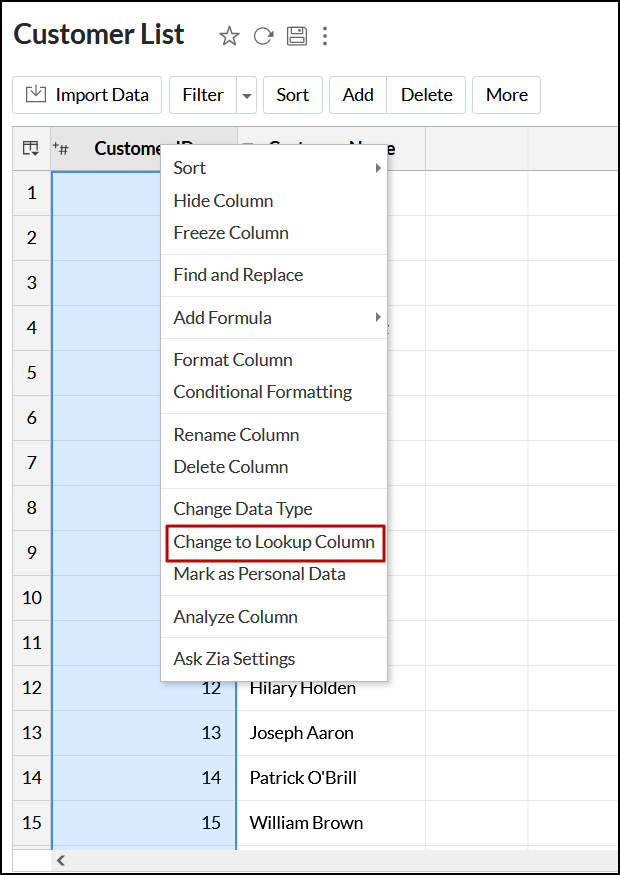
Analytics Plus allows you to change any table column to a lookup column. A lookup column is a type of column whose values are referenced from a column in another table in the same workspace. Click here to learn more about lookup columns. To change a column to a lookup column, follow the steps below:
- Open the required table and select the column to change to a lookup column.
Right-click and choose the Change to Lookup Column option.
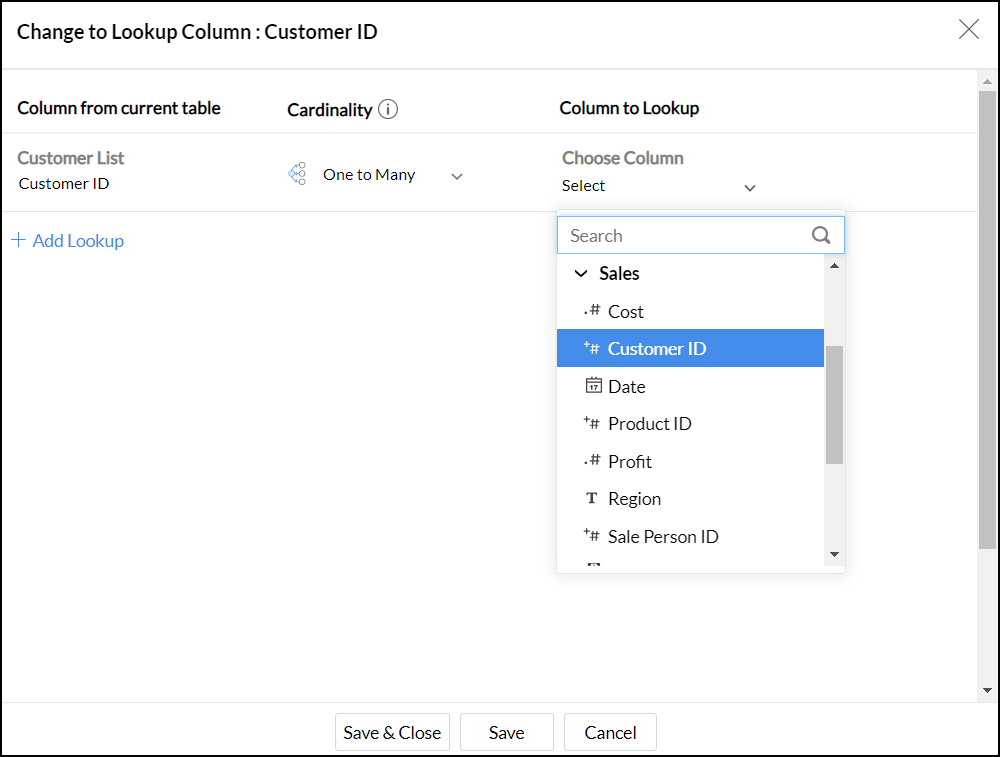
- In the dialog that appears, choose the column to lookup from the Column to Lookup drop-down, which lists all the tables and their columns in the workspace.
Click Save & Close.
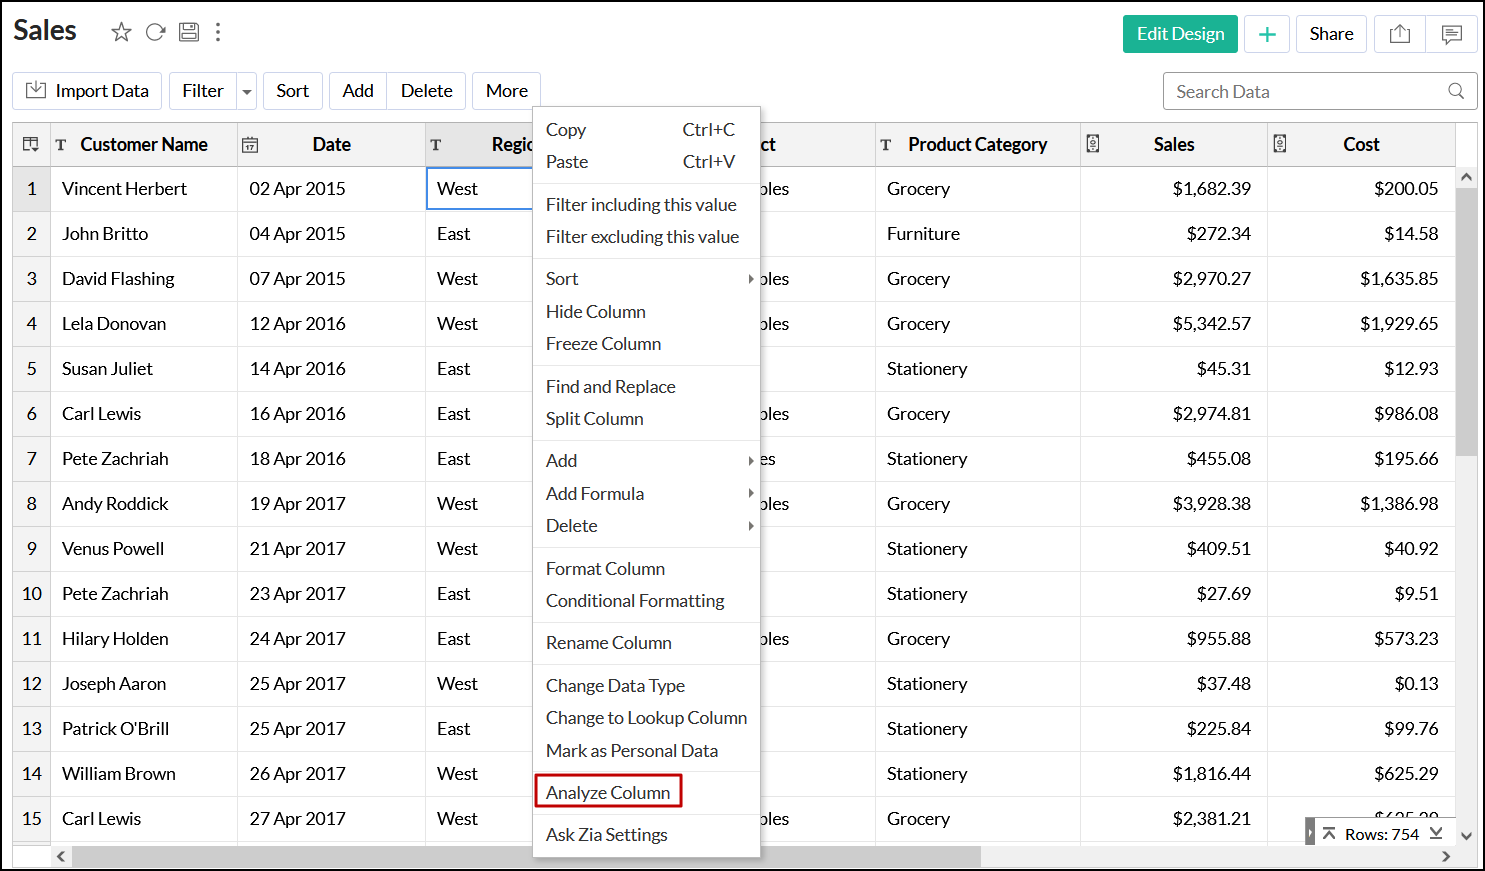
Analyze column
Analytics Plus can automatically analyze your column's data and create sample reports by picking meaningful metrics. You can get started with these reports or modify them or create your report.
To analyze a column and create reports, right-click on the required column and select Analyze Column. On successful completion of the analysis, Analytics Plus generate reports.
Copying a Table
ManageEngine Analytics Plus allows you to save a copy of a table in your workspace. On copying, all formatting, formulas, etc., will be retained in the new table too. Follow the steps given below to copy a table. Open the table you want to copy.
- Click the More Options icon near the table name, the Save As option will appear. Select this to open the Save As dialog.
- Specify a name to the new table in the Name field.
- Select the folder to save the new table in Save in folder drop-down.
- The With Data option allows you to choose whether to copy the table with or without data.
- Select this to back up the data. By default, this will be selected.
- Unselect this to copy the table design, where you can import similar data. e.g., you have a sales table for last year and want to create a new table for the current year. You can copy the table design and import the current year's data instead of creating it from scratch.

- The Retain Lookup option allows you to choose whether to retain the lookup columns defined in the original table.
- Click OK. The table will be copied as needed.
Exporting a Table
ManageEngine Analytics Plus allows you to export tables that you have into various file formats like CSV, PDF, XLS, or HTML files. To export a table:
- Open the table that you would like to export.
- Select Export in the toolbar.
- Select one of the five export format options: In the Export Settings window that opens, set the required options and then click the Export button at the bottom to export.
- CSV -Exports the table's data as a Comma Separated Value (CSV) file.
- PDF- Exports the table's data in Portable Document Format (PDF) file format.
- HTML - Exports the table's data in HTML file format.
- Excel (XLS)- Exports table as an Excel file.

Sharing a Table
In ManageEngine Analytics Plus you can easily share your table for other users' access. You can also set specific permissions on the shared tables so that the users would be allowed to do only permitted actions when they access the table. The various share options are provided under the Share menu in the toolbar. Refer to the topic Sharing and Collaboration to know how to share a table.
Note:
- Share option will be enabled only to users who have been provided that permission during sharing by the Administrator.
Publishing a Table
ManageEngine Analytics Plus allows you to publish/embed tables into your websites/web pages or as easy-to-access URLs. ManageEngine Analytics Plus also allows you to control the access privileges and permissions provided to the users who access the table. Refer to the topic PublishingOptions to know how to Publish a table.
Note:
- This option will be enabled only to the Administrator and Owners of the workspace.
Related topics: Add Rows and Columns | Adding Formulas (Calculations) | Relational Data Modeling | Joining Tables