What-If Analysis
Analytics Plus enables you to perform powerful scenario analysis over your data using the What-if analysis feature. This allows you to visualize the business impact ahead of time, when one or more of the involved variables change.
Setting up What-if analysis
Follow the steps below to configure scenario analysis, the follow
- Creating variables
- Adding variables to an aggregate formula
- Adding aggregate formula to a report
- Adding the variable as a user filter
- Customizing the variable for shared Users
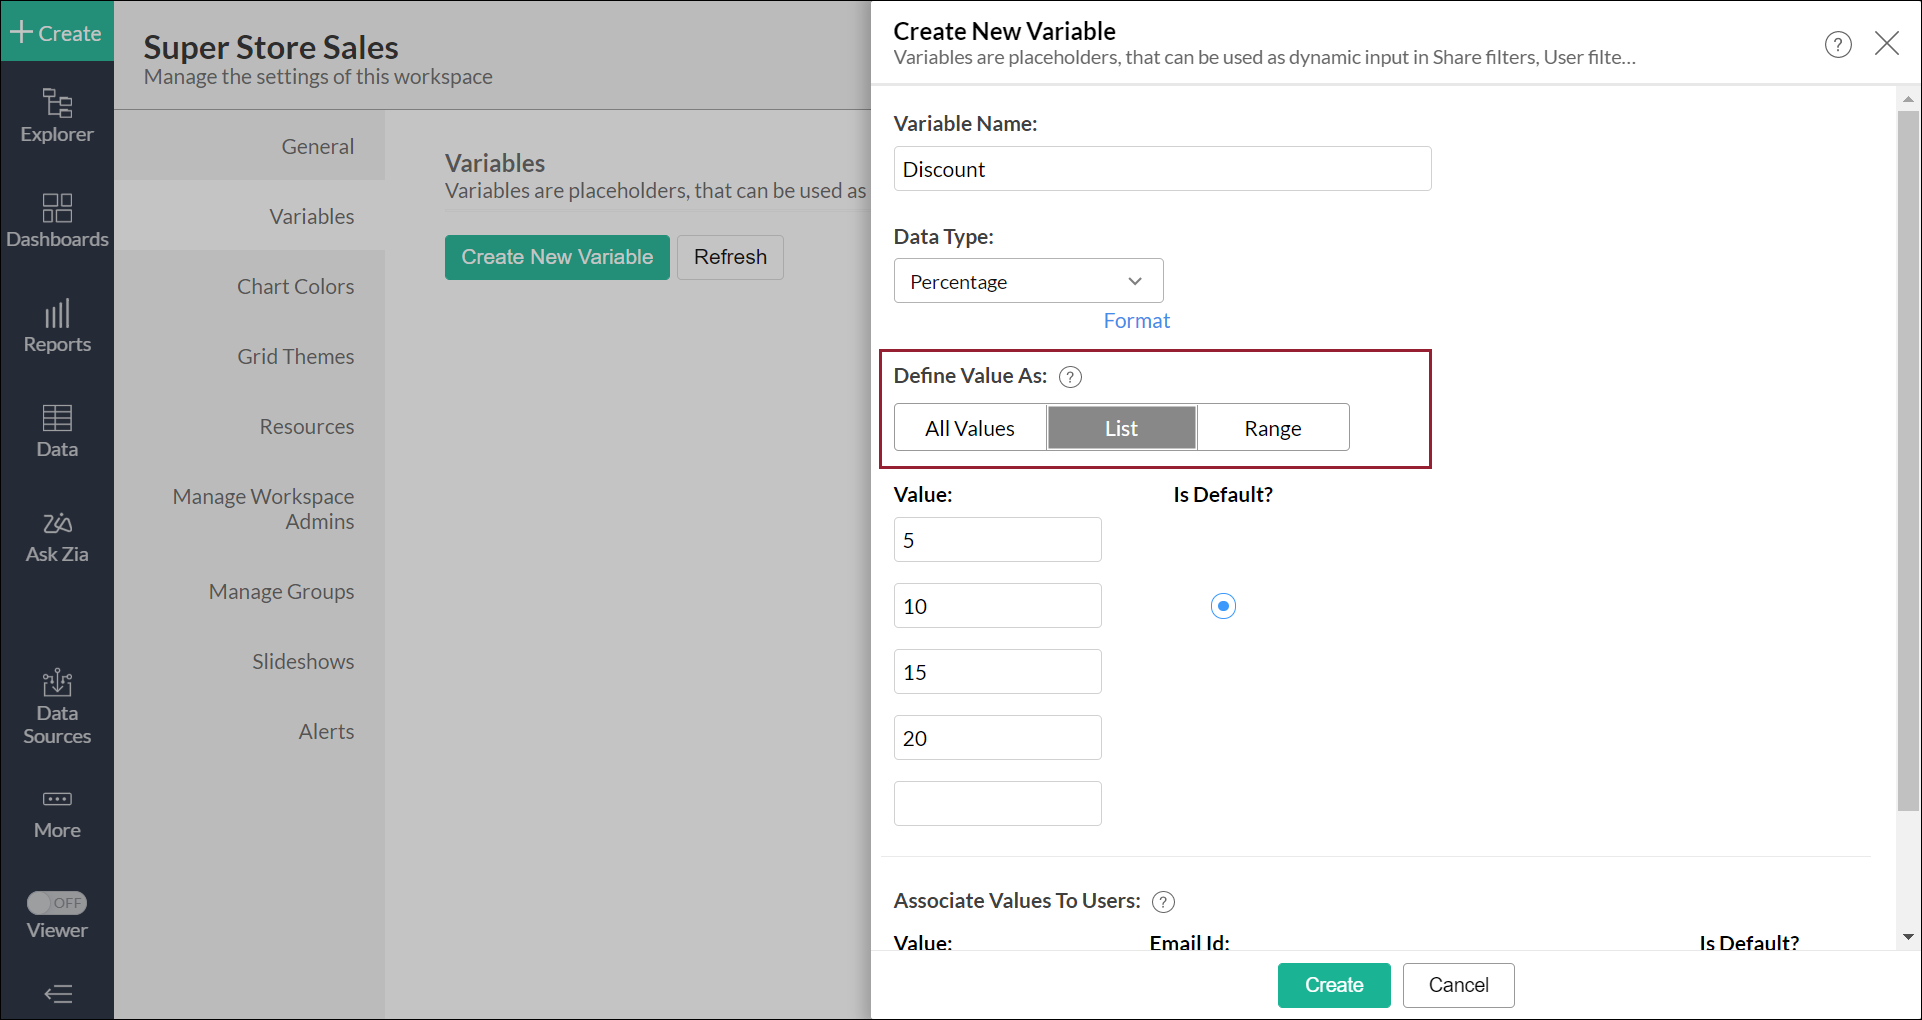
Step 1: Creating variables
To provide a dynamic input for what-if analysis, a variable should be created. To create a new variable, click the Settings icon on the side panel, and navigate to the Variables section. Click the Create New Variable button, and create the required variable. Note: Ensure that the default value is specified as a list or as a range. To learn more about creating variables in Analytics Plus, click here.
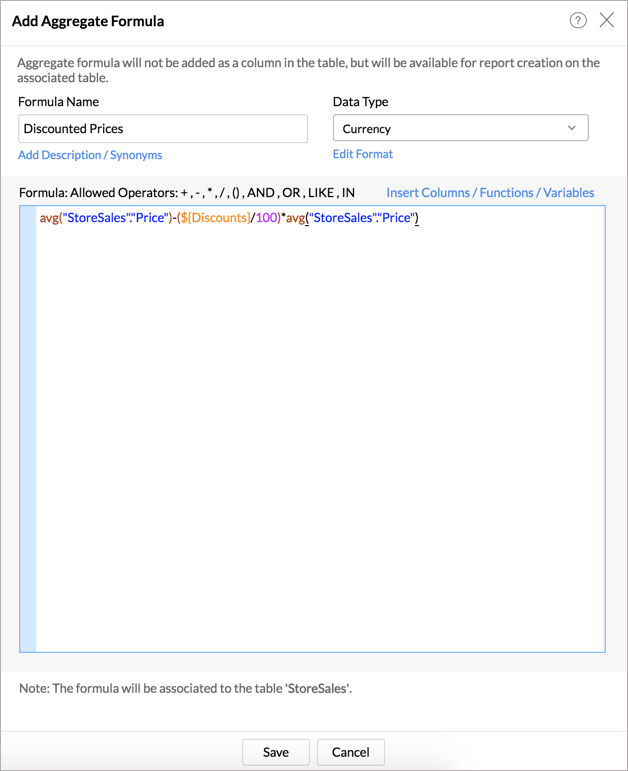
Step 2: Adding variable to an aggregate formula
On creating a custom variable, you need to create an aggregate formula using the created variables. Navigate to the table on which the required report has been built, and add a new aggregate formula containing the variable. For example, you can add a formula that calculates the discounted price, using the Discount variable. To learn more about creating aggregate formulas in Analytics Plus, click here.
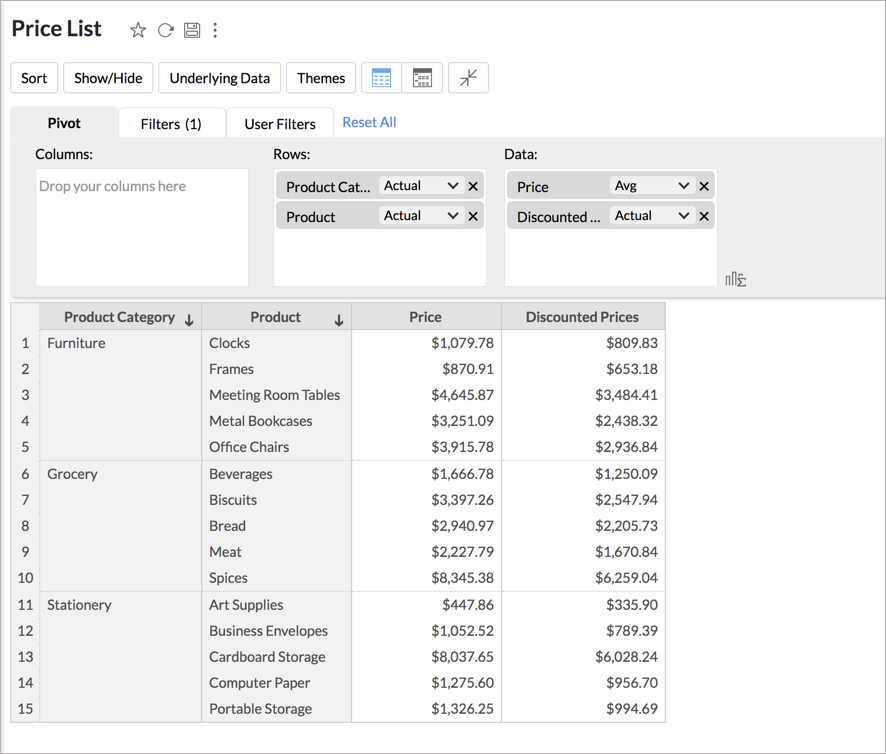
Step 3: Adding aggregate formula to a report
Create a report using the new aggregate formula. To do this, open the required table, click the Create New button, and choose the required chart type to create a new report using the aggregate formula column and other table columns.
Let's create a pivot report with the discounted prices aggregate formula column. The discount price column values are calculated based on the default value (10%) defined in the variable.
Step 4: Adding the variable as a user filter
Navigate to the report you wish to analyze, and add the required variable as a user filter to the report. This allows you to modify the values as required, and visualize the corresponding impact to the overall report. To learn more about adding user filters in Analytics Plus, click here.
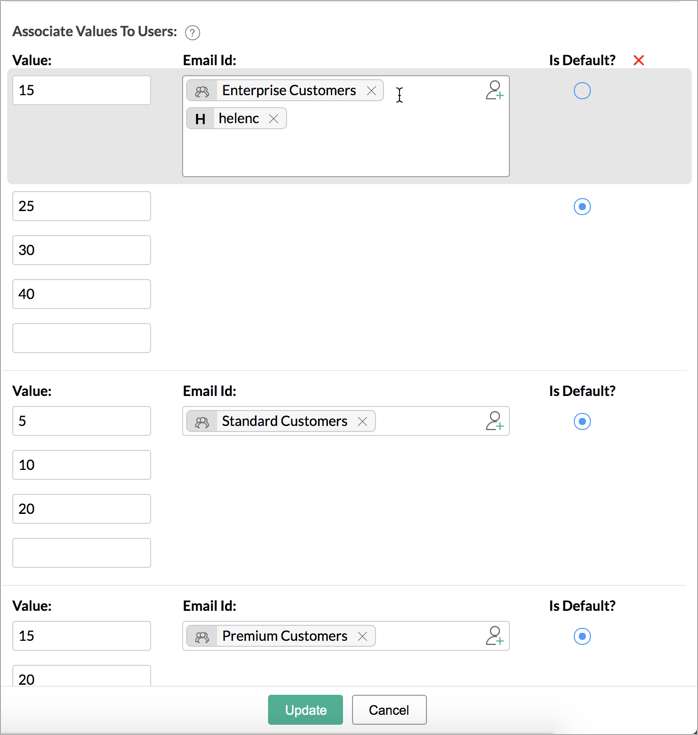
Note: When creating a variable, you can associate the values in the variable to specific users or groups. On accessing shared reports, in cases where multiple values are associated to them, shared users can employ what-if analysis to visualize changes to the report corresponding to the values associated to them.
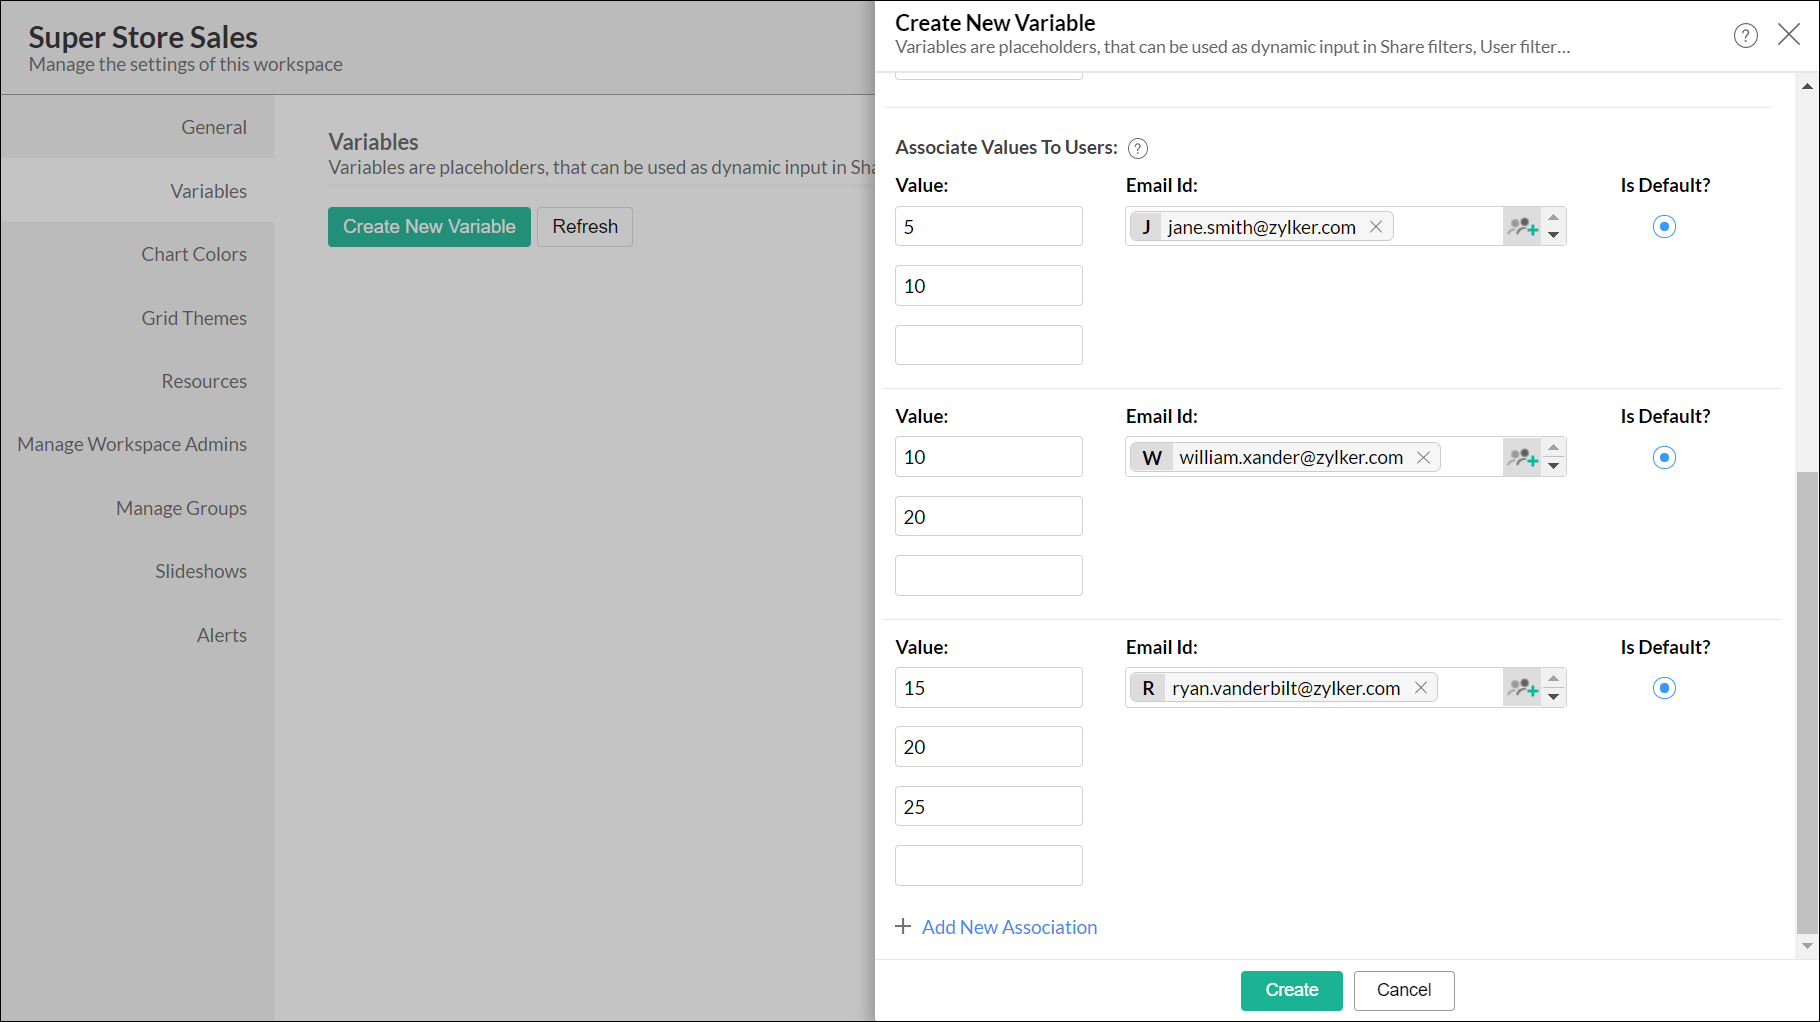
Step 5: Customizing the variable for shared users
Analytics Plus allows you to define different set of values for individual shared users. For example, you can define different set of discount ranges for various user groups or individual users.