DEX Live Telemetry
DEX Live Telemetry is an AI-powered capability that retrieves live data from managed devices based on user queries. It supports more than 50 telemetry variables across areas such as battery, performance, and system information. Zia interprets the query, identifies the relevant telemetry data, and retrieves the latest information directly from the device on demand. This helps IT professionals understand the current state of endpoints and make faster, data-driven troubleshooting and diagnostic decisions.
Why Use DEX Live Telemetry
Transient device issues, such as sudden performance spikes, unexpected process behavior, or battery anomalies, are difficult to diagnose without knowing the exact state of the device when they occur. Administrators cannot see what is actively happening on a device without initiating a remote session or waiting for scheduled data collection.
DEX Live Telemetry lets administrators query a managed device in real time and retrieve current values on demand, without opening a remote session or running scripts manually. This makes it possible to investigate live device behavior and act on issues as they happen.
Use Cases
- Sluggish device during a live call: Query CPU usage, memory pressure, and top-consuming processes to identify what is driving the slowdown without interrupting the user with a remote session.
- Unexpected battery drain: Query battery health, cycle count, and top battery-consuming applications to determine whether the cause is hardware degradation or a runaway background process.
- Slow file transfers or high latency: Query live receive and transmit rates, Wi-Fi signal strength, channel, and output queue length to identify whether the bottleneck is signal quality, bandwidth saturation, or a network adapter issue.
- Longer startup time: Retrieve the current boot duration, logon time, and stop error history to confirm whether the delay is recurring and which boot phase is responsible.
- Repeated application crashes: Check live memory availability, memory pressure, and application crash count to determine whether the crashes are resource-driven before escalating to the application team.
- Storage-related replacement assessment: Query disk queue length, average disk time, and free space to confirm whether the drive is under stress before raising a replacement request.
How It Works
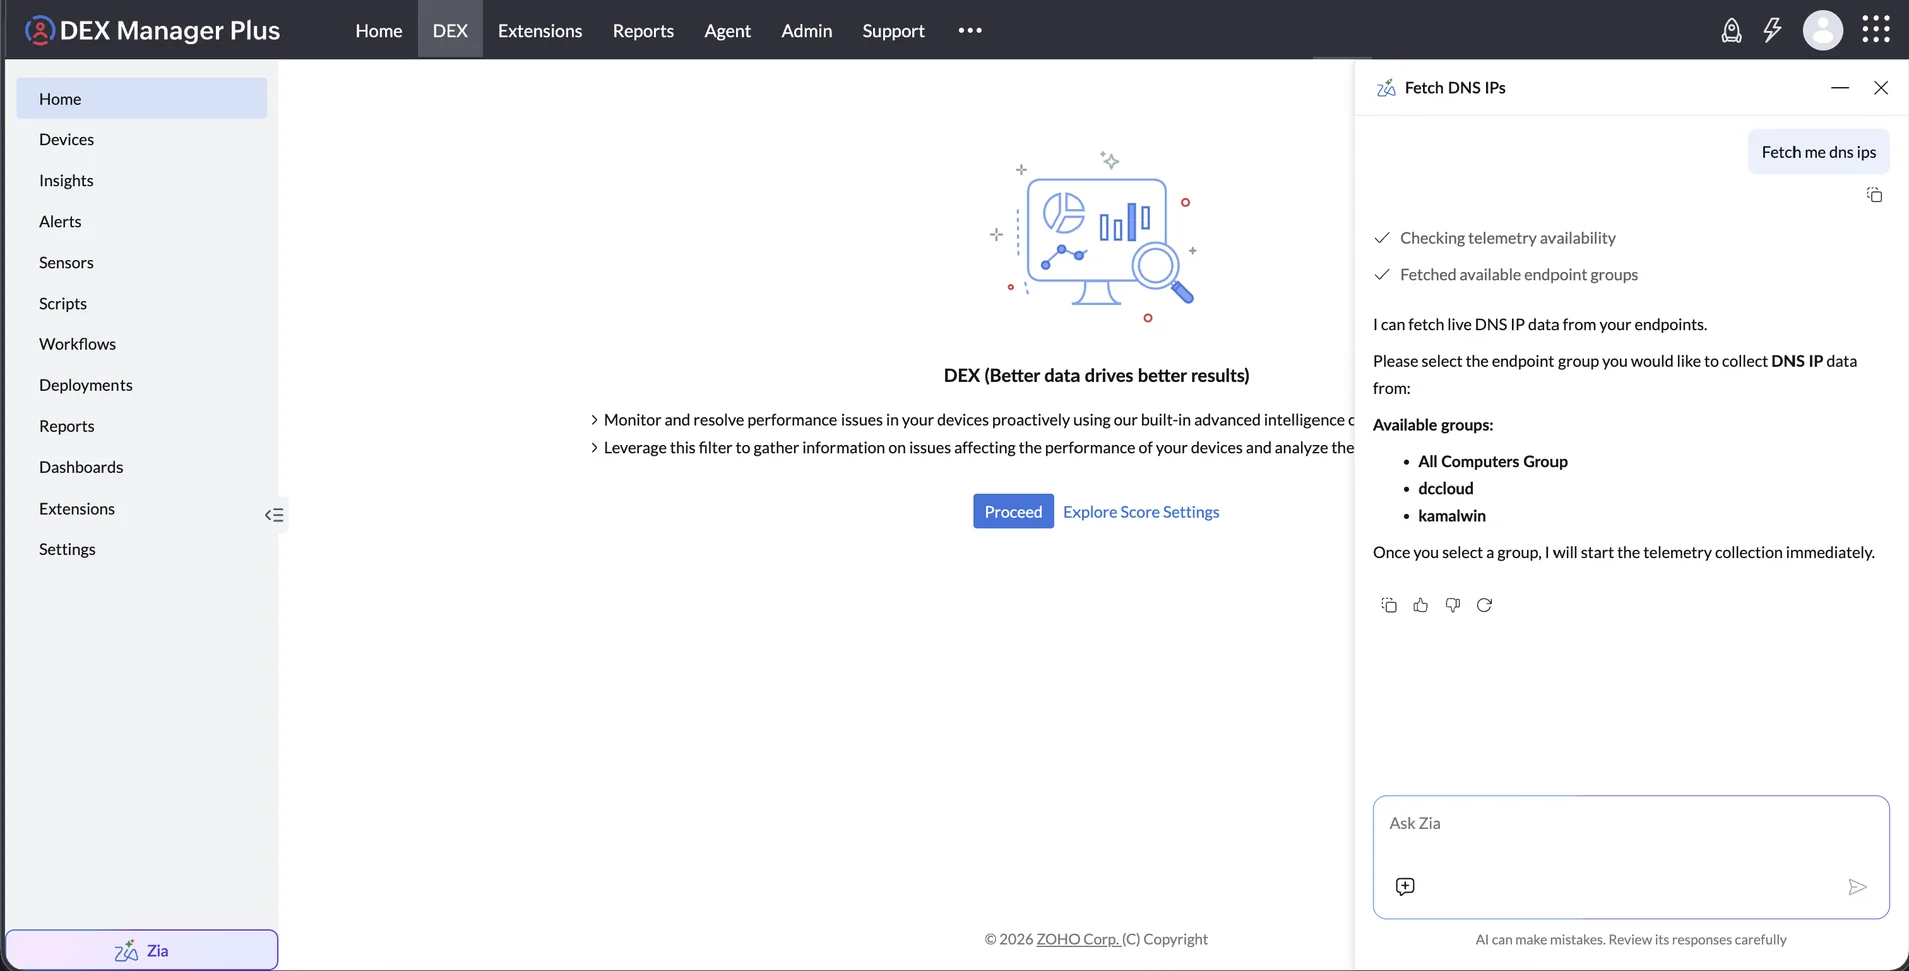
- Enter a plain-language query in DEX Zia, such as asking for the current battery health or CPU usage of a specific device.
- Zia interprets the query, identifies the relevant telemetry variables, and sends a live data request to the agent on the target device.
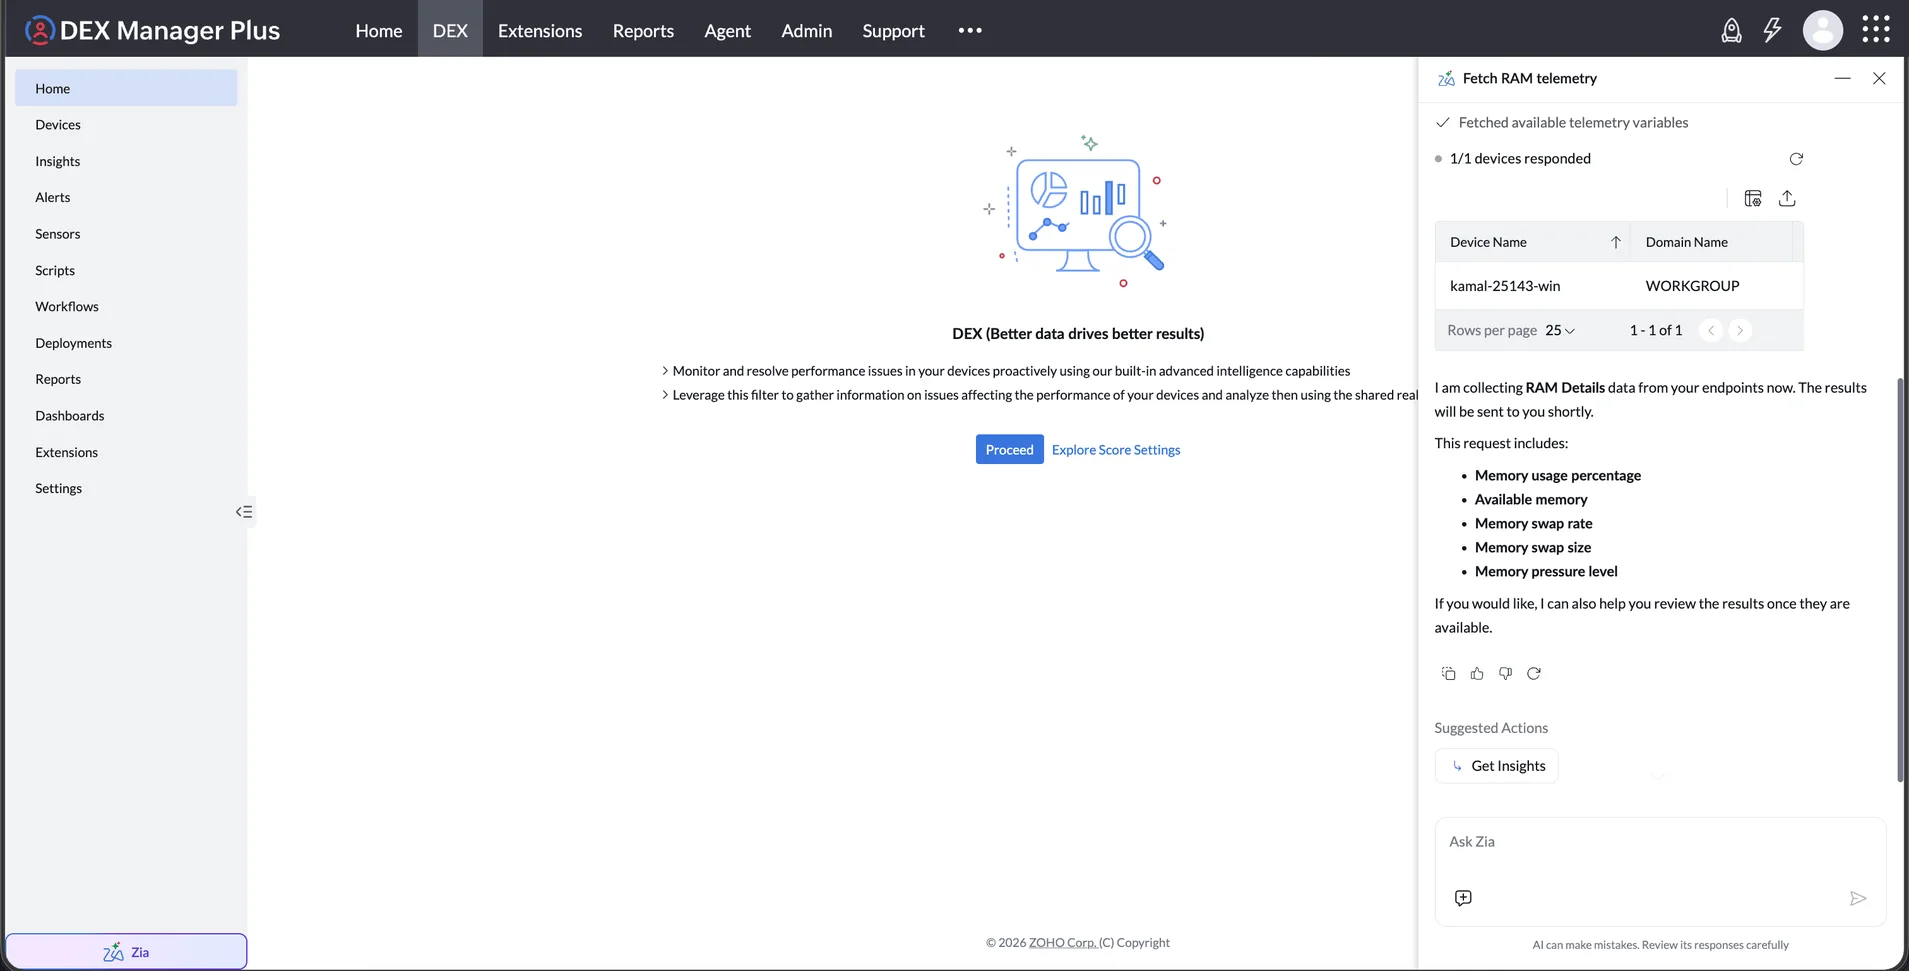
- The agent retrieves the current values directly from the device and returns them to the server.
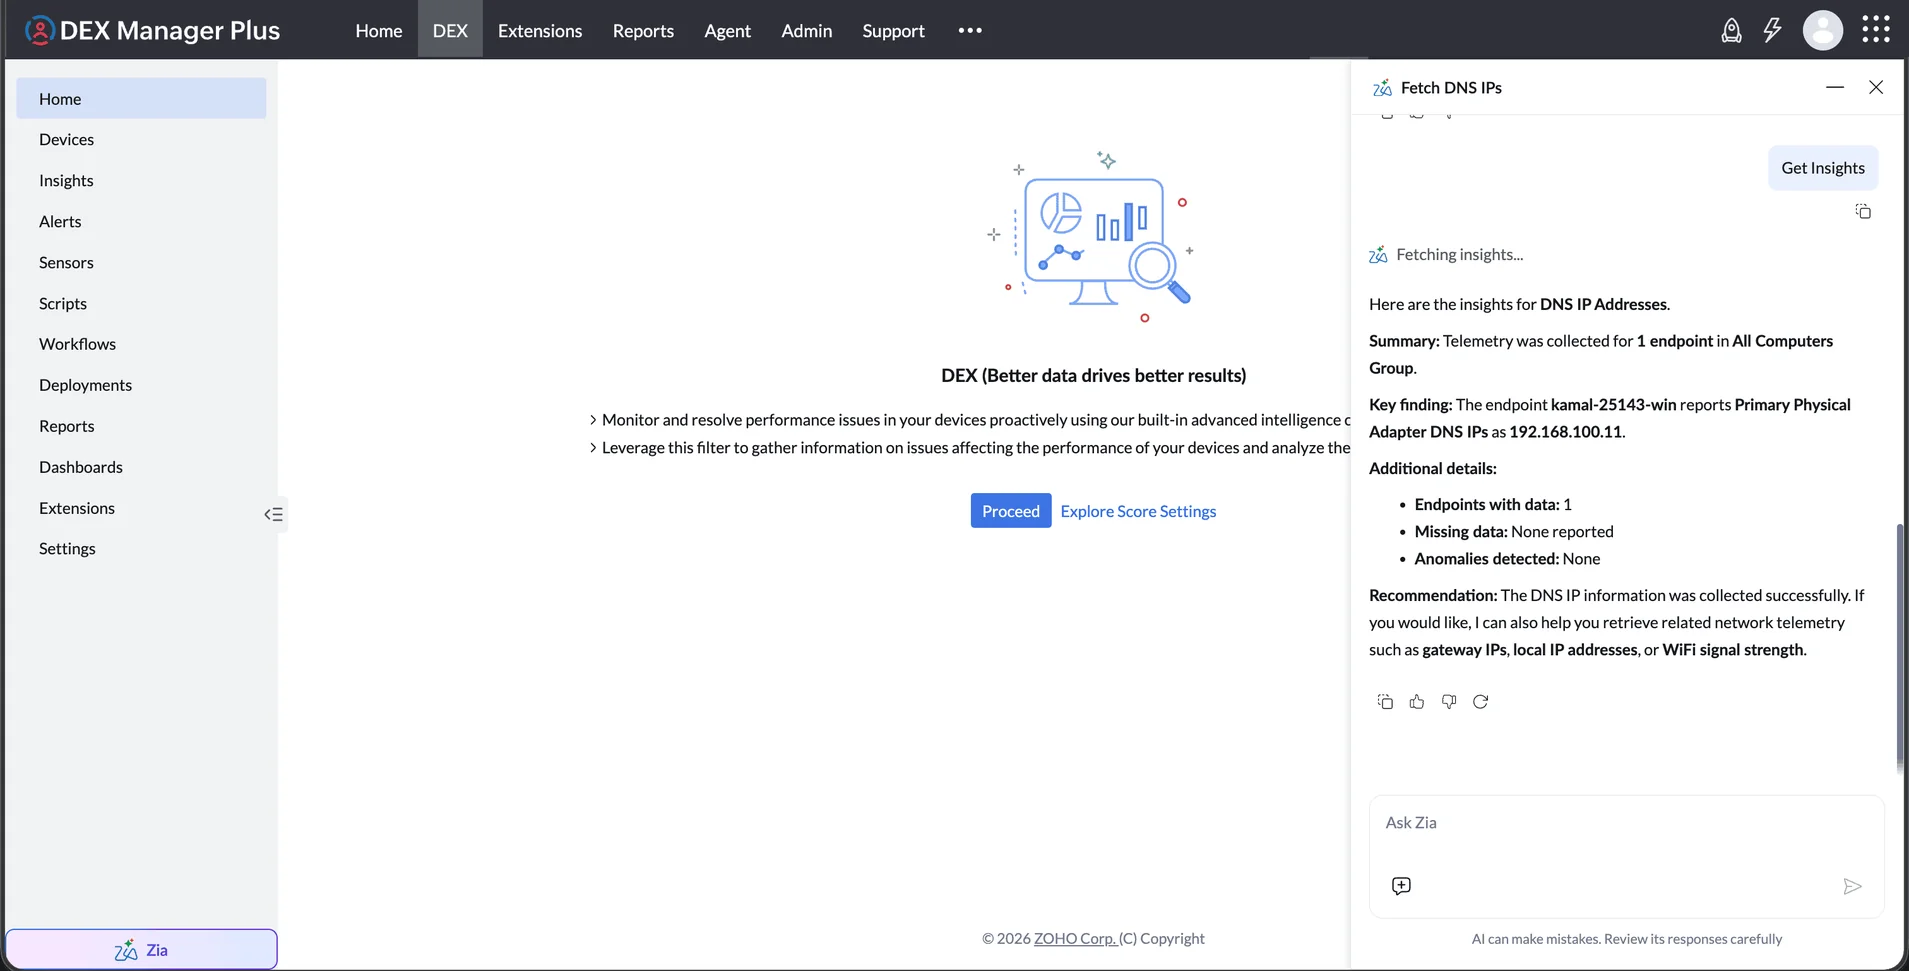
- Zia presents the results in the console, reflecting the device's state at the time of the query.
Live Telemetry Workflow
Use the previous and next controls to view each stage. Select an image to enlarge it.
Limitations and Considerations
- The target device must be online and in Managed status. Queries against offline devices do not return data.
- DEX Live Telemetry currently supports Windows endpoints only. macOS and Linux devices are not supported.
- Retrieved data is scoped to the current session. Record or export results before closing the Zia chat if they are needed for further action.
- Variable availability depends on the device's hardware configuration and active connections. Virtual machines do not return battery variables, Ethernet-connected devices do not return Wi-Fi metrics, and devices without a dedicated GPU do not return GPU usage data.
Sample Prompts
Use these example queries with Zia to retrieve current telemetry from managed Windows devices. Select Copy to copy a prompt.
Network
Show me the current Wi-Fi connection status, signal strength, SSID, band, channel, and link speed of my devices.Show me the current and average Wi-Fi receive and transmit rates for my devices.Show me the Ethernet connection status and link speed of my devices.Show me the primary network adapter type, local IP, and DNS IPs of my devices.Storage
Show me the total and available space on the OS and non-OS drives of my devices.Show me the current disk queue length and disk time of my devices.Battery
Show me the battery health, designed capacity, full charge capacity, and cycle count of my devices.Show me the current battery charge percentage, charging or discharging status, backup time, and critical state of my devices.Show me the battery manufacturer, name, chemistry, serial number, and power plan of my devices.Show me the top battery-consuming apps and battery charge times of my devices.Boot & Logon
Show me the latest boot start time, end time, boot duration, and full boot time of my devices.Show me the latest logon duration of my devices.Fetch me the average boot time, full boot time, and logon duration over the last 15 minutes.Show me the latest long power press timestamp and its average over the last 15 minutes.Performance
Show me the current CPU usage percentage and interrupt rate of my devices.Show me the current memory usage, available memory, swap rate, and swap size of my devices.Show me the current GPU usage of my devices.Give me an overview of the current CPU, memory, GPU, disk, and network performance of my devices.