The NTP stats dashboard in DDI Central
DDI Central includes a dedicated dashboard to visualize essential metrics related to the onboarded NTP servers, helping network administrators monitor, analyze, and optimize time synchronization accuracy and reliability across their network infrastructure. Admins can consistently monitor deviations in these NTP metrics, signaling potential hardware, software, or network issues that require prompt evaluation to maintain precise and reliable time synchronization across the network.
How to access the NTP stats dashboard

- Log into DDI Central as an admin. Only admins have access to configuring or monitoring NTP Servers in DDI Central.
- Go to Setting > Servers. The Servers tab will be chosen by default.
- Locate the desired NTP server from the list of servers displayed.
- Click on the Actions dropdown (green button) for the chosen server.
- Select View NTP Stats from the dropdown menu.
- You’ll now see the dedicated NTP Stats Dashboard, providing real-time visualization of key synchronization metrics.
Key metrics in NTP servers dashboard
To start monitoring your NTP stats, first customize your time window using the date-picker shown at the top-right corner of the dashboard.
DDI Central captures and consistently tracks key metrics specifically for the time frame you select, enabling precise historical analysis and informed troubleshooting.

1. NTP Peer Stats (Offset)

- The NTP Peer Stats (Offset) section shows the time difference (offset) between your server and its configured NTP peer servers.
- A consistent low offset value here for the chosen time window indicates reliable synchronization. Frequent or large fluctuations could signal network issues or NTP configuration problems.
- Consistent positive values here indicates that the chosen NTP server's clock is consistently ahead (running fast) compared to its peer server. This may result in log discrepancies, authentication issues, or data inconsistencies.
- Consistent negative values here indicates that the chosen NTP server's clock is consistently behind (running slow) relative to the peer server. This may affect synchronization-dependent tasks like transaction logging or security validations.
- It enables admins to quickly detect and troubleshoot synchronization issues with peer servers, ensuring accurate system clocks across the network site or cluster.
2. NTP Peer Stats (Jitter)

- The NTP Peer Stats (Jitter) section illustrates variations (jitter) in latency when communicating with peer servers.
- Higher jitter values here for the chosen time window indicate unstable or fluctuating latency, potentially degrading synchronization quality.
- Consistent high positive or negative values here suggest frequent and erratic fluctuations in network latency between your server and its peers. This causes unstable synchronization, affecting sensitive systems dependent on precise timing.
- This enables admins to pinpoint unstable network connections and proactively rectify latency-related synchronization issues.
3. NTP Loop Stats (Offset)
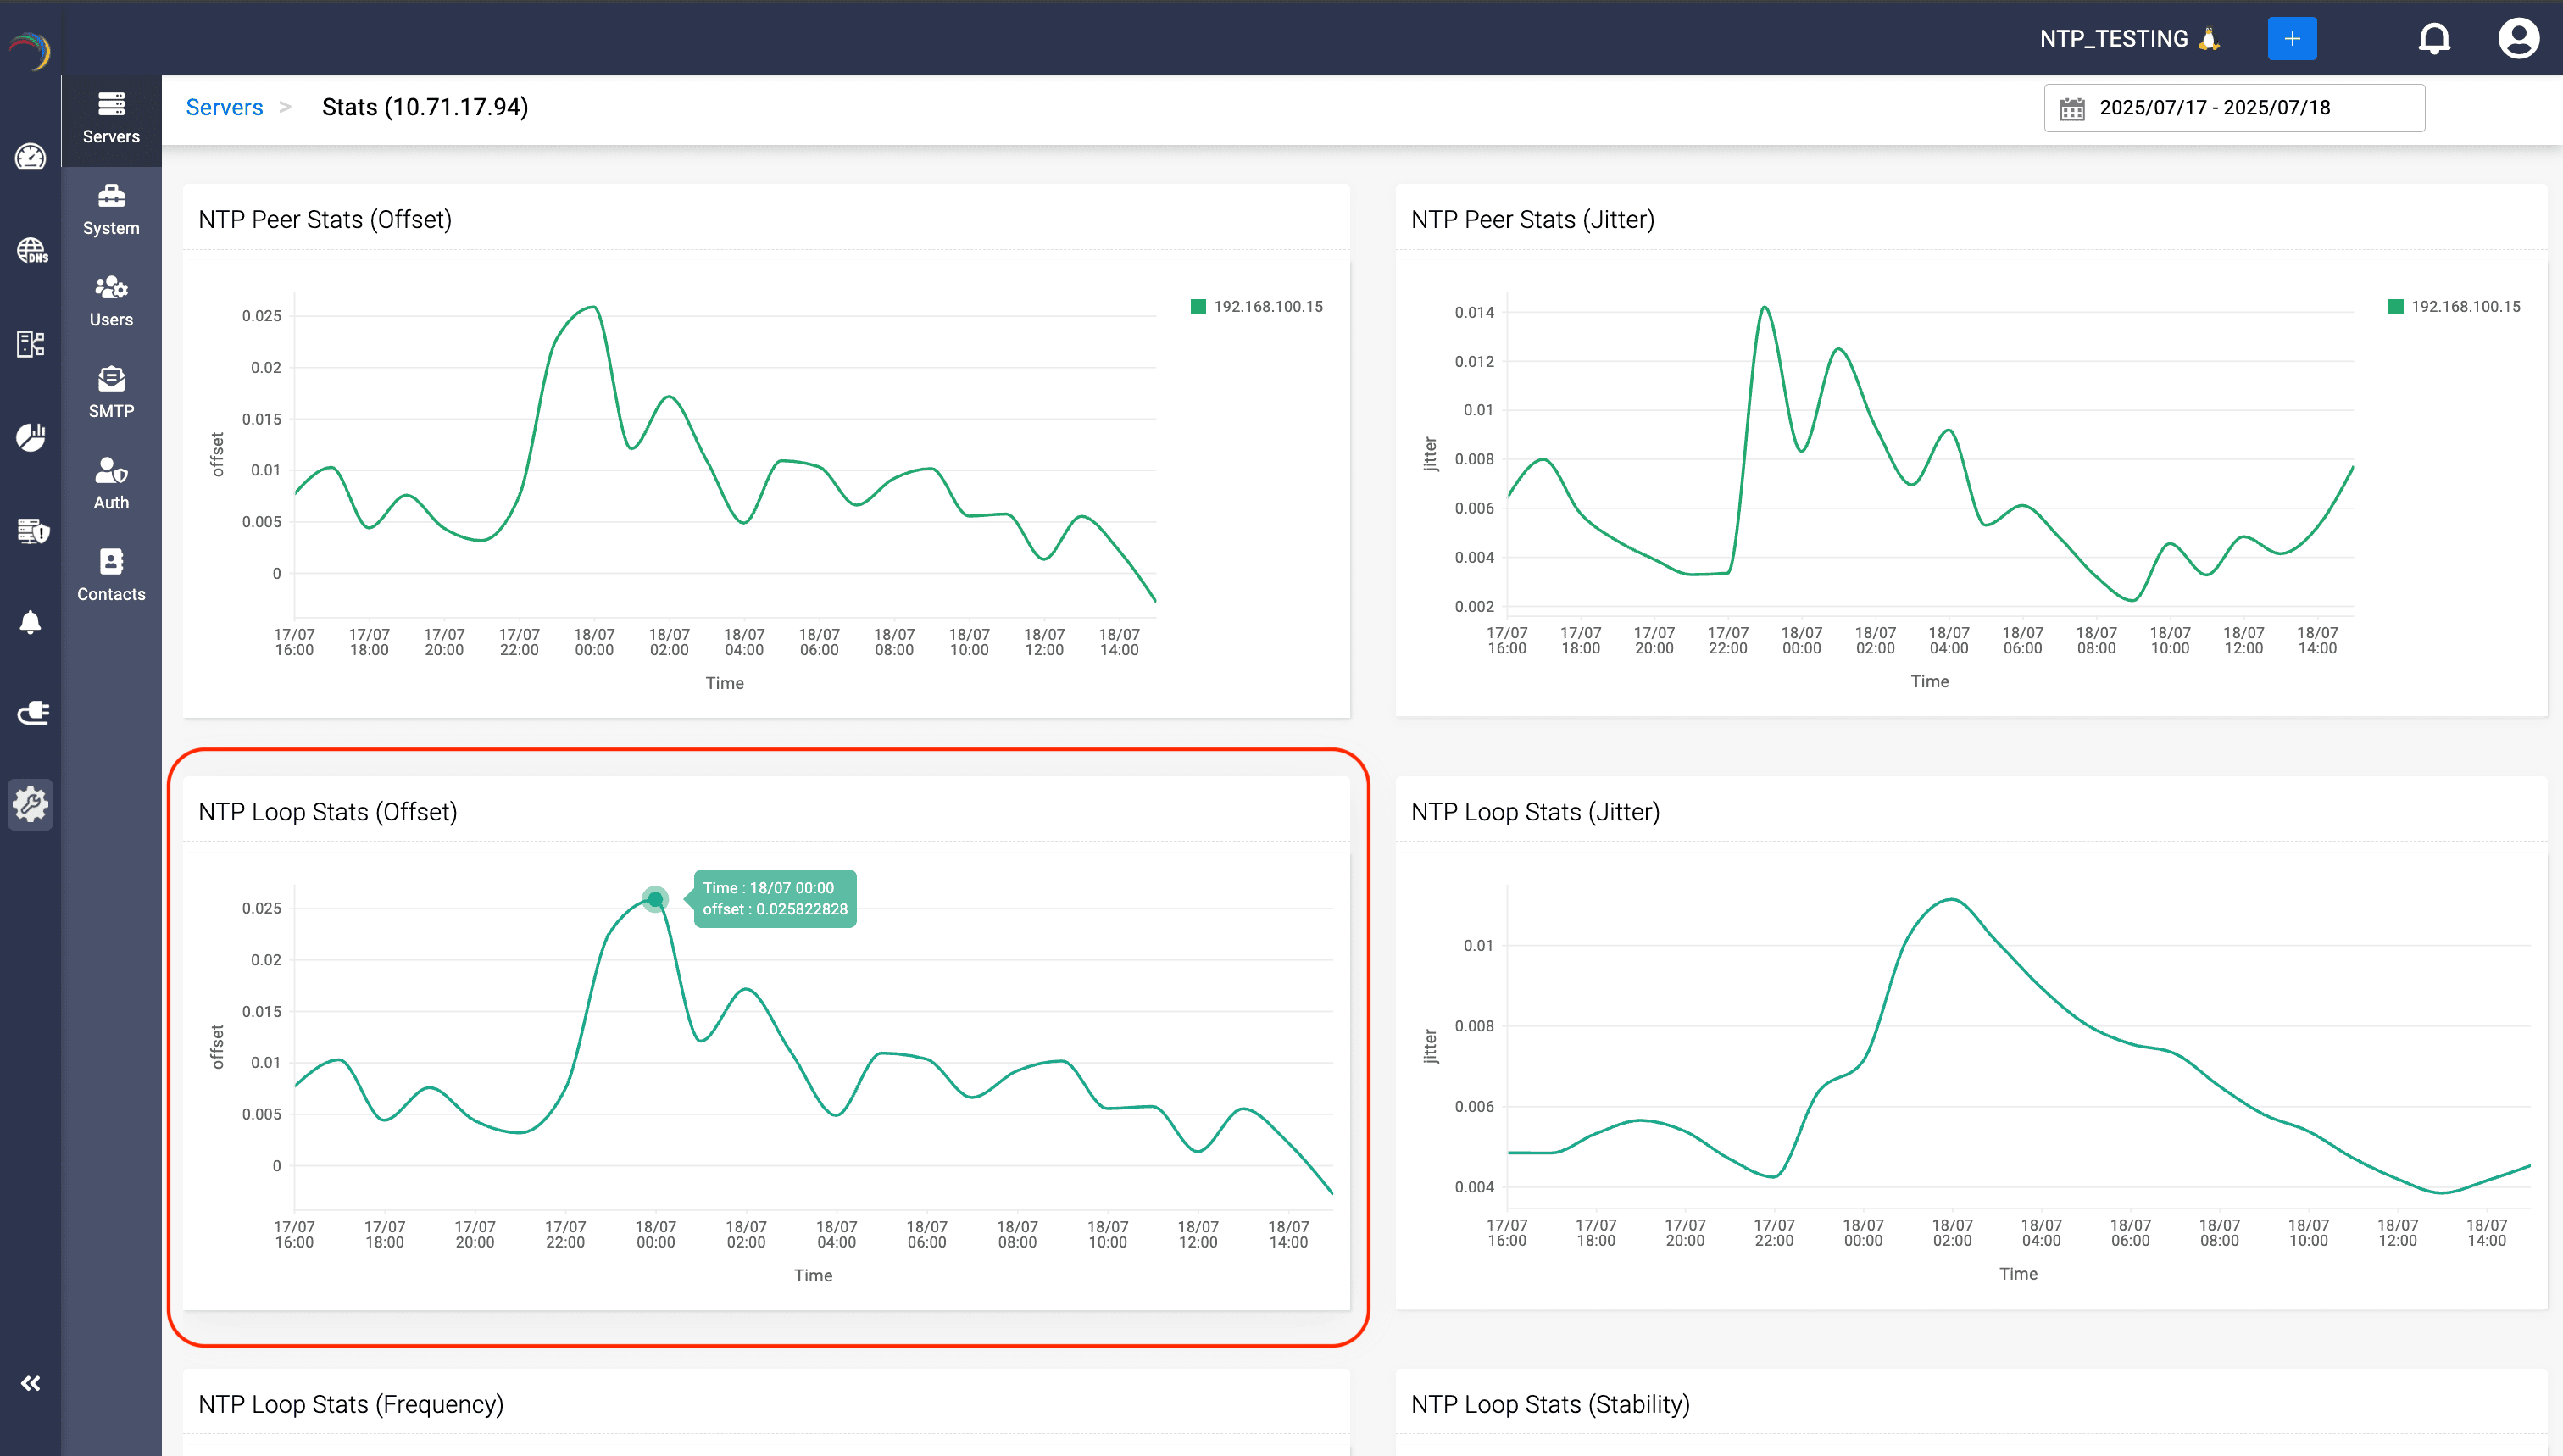
- The NTP Loop Stats (Offset) section represents the time offset of your NTP server’s own internal clock relative to reference servers.
- Regular, minimal loop offset here indicates a stable, accurate internal clock.
- Consistent positive values here indicate that the chosen NTP server’s internal clock consistently runs faster than its synchronized reference, indicating frequent adjustments are needed to slow down the clock. This might indicate hardware or configuration issues requiring system intervention.
- Consistent negative values here indicate that the chosen NTP server's internal clock consistently runs slower, prompting regular speed-ups by adjustments. This suggests potential internal hardware problems or software misconfiguration.
- This helps administrators ensure the internal accuracy and stability of their NTP server, crucial for maintaining synchronization integrity across the enterprise.
4. NTP Loop Stats (Jitter)

- The NTP Loop Stats (Jitter) section reflects the stability of internal latency variations of the NTP server clock adjustments.
- High internal jitter can suggest issues with the local clock or internal system performance problems.
- Consistent high positive or negative values here indicate internal adjustments of the server’s own clock are frequently varying in magnitude. This reflects potential instability in your server’s internal hardware or software settings, possibly requiring maintenance.
- Enables admins to identify internal server issues affecting time accuracy, enhancing overall reliability.
5. NTP Loop Stats (Frequency)

- The NTP Loop Stats (Frequency) measures the frequency adjustments applied to the NTP server clock to keep it synchronized with its reference source.
- Large or frequent frequency adjustments indicate that the server is having difficulty maintaining synchronization.
- Consistent positive values here show the chosen server frequently needs upward frequency corrections (running slower than standard). This suggests that internal timing hardware is consistently slower and might need inspection or recalibration.
- Consistent negative values here indicate frequent downward frequency corrections (running faster than normal). This may reveal persistent internal timing hardware speed issues or calibration needs.
- Empowers network admins to detect and address systemic or hardware-related problems that affect server synchronization.
6. NTP Loop Stats (Stability)

- The NTP Loop Stats (Stability) section shows how stable the server’s internal clock adjustments are over time.
- Greater stability means fewer adjustments, translating into more reliable synchronization.
- Consistent high positive values here signifies that the frequency adjustments are consistently large, indicating unstable internal clock performance. This reduces reliability for precise timestamping in critical network operations.
- Consistent low positive values (close to zero) here indicates highly stable internal clock adjustments, resulting in robust and reliable time synchronization. This is the ideal scenario signifying optimal health for NTP synchronization.
- Helps admins evaluate the quality of the NTP hardware and configurations, ensuring reliable synchronization throughout the network.
Practical tips for admins
- Regularly check the dashboard to proactively identify and resolve synchronization issues.
- Utilize data shown (offset, jitter, frequency) to fine-tune NTP configurations.
By leveraging DDI Central’s NTP Stats Dashboard, network administrators gain critical insights into synchronization accuracy, stability, and performance—essential for robust and dependable network operations.