Apache Geronimo Monitoring
Apache Geronimo server is an open source application server that enables developers and system administrators to create enterprise applications that are portable, scalable and can be integrated with legacy technologies. With Applications Manager, your Geronimo server monitoring becomes easier as it enables maximum performance efficiency of your servers while keeping a check on downtimes.
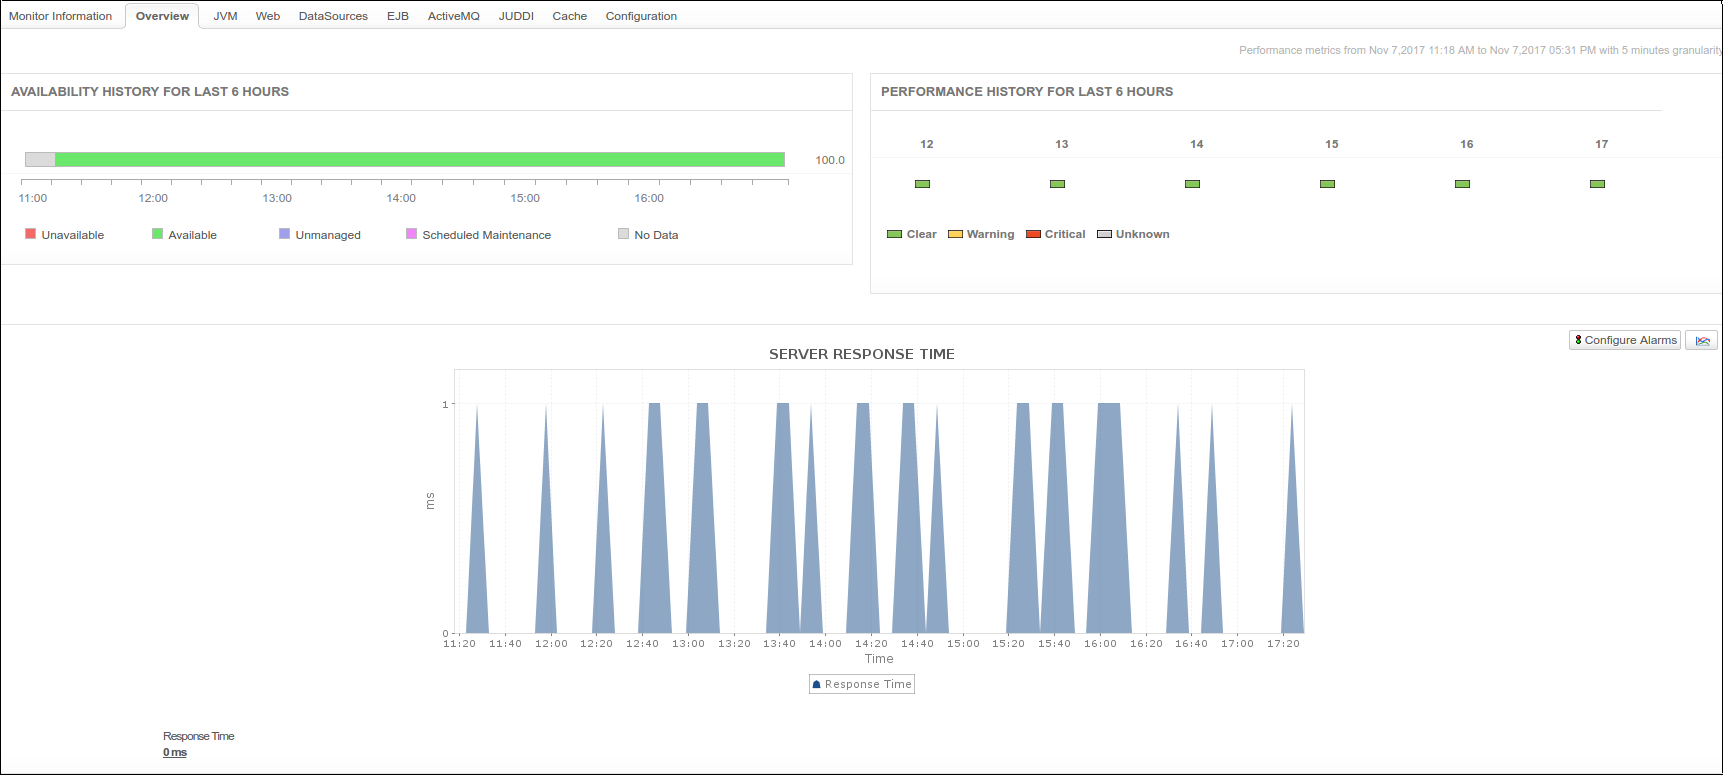
Track response times and memory usage
A low response time of your server enables it to perform optimally. While Applications Manager tracks your server response times, it also keeps a tight check on the heap and non-heap memory utilized by your server. Applications Manager instantly alerts you when it detects any abnormal behavior of the Geronimo server, thus enabling you to eliminate bottlenecks before it affects end users.
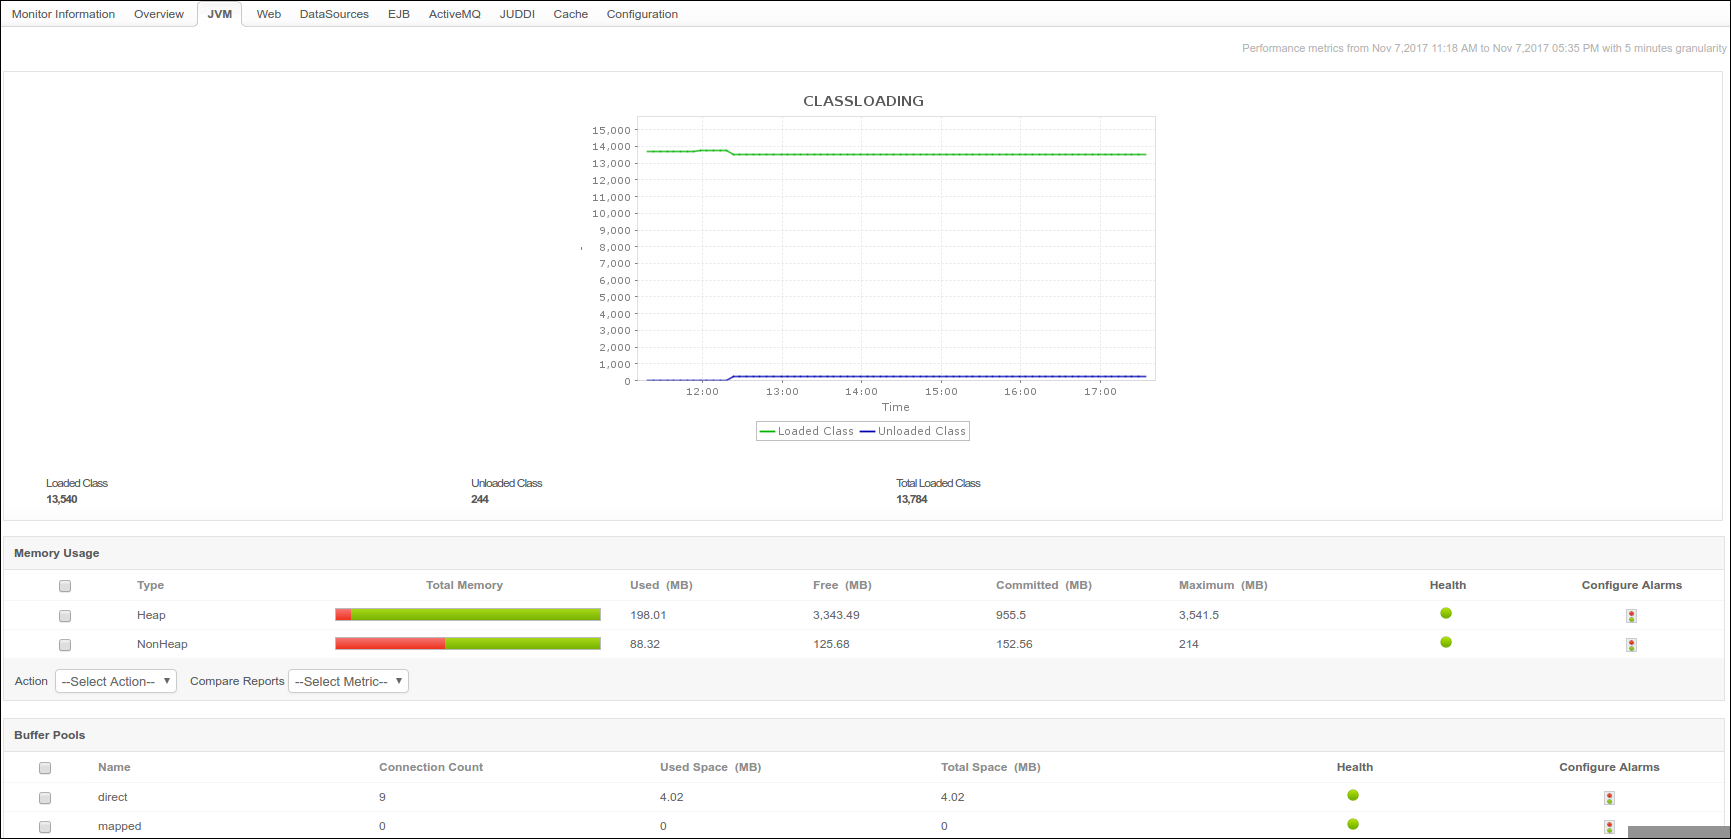
Track Geronimo Servlet JVM portlet
The health of an application server is a cumulative representation of how every element of the server performs. The performance of Java runtime is key to ensure optimal performance of the server. With Applications Manager, you can watch every attribute that denotes performance of Geronimo's Java runtime - such as buffer pools, garbage collection, and more.

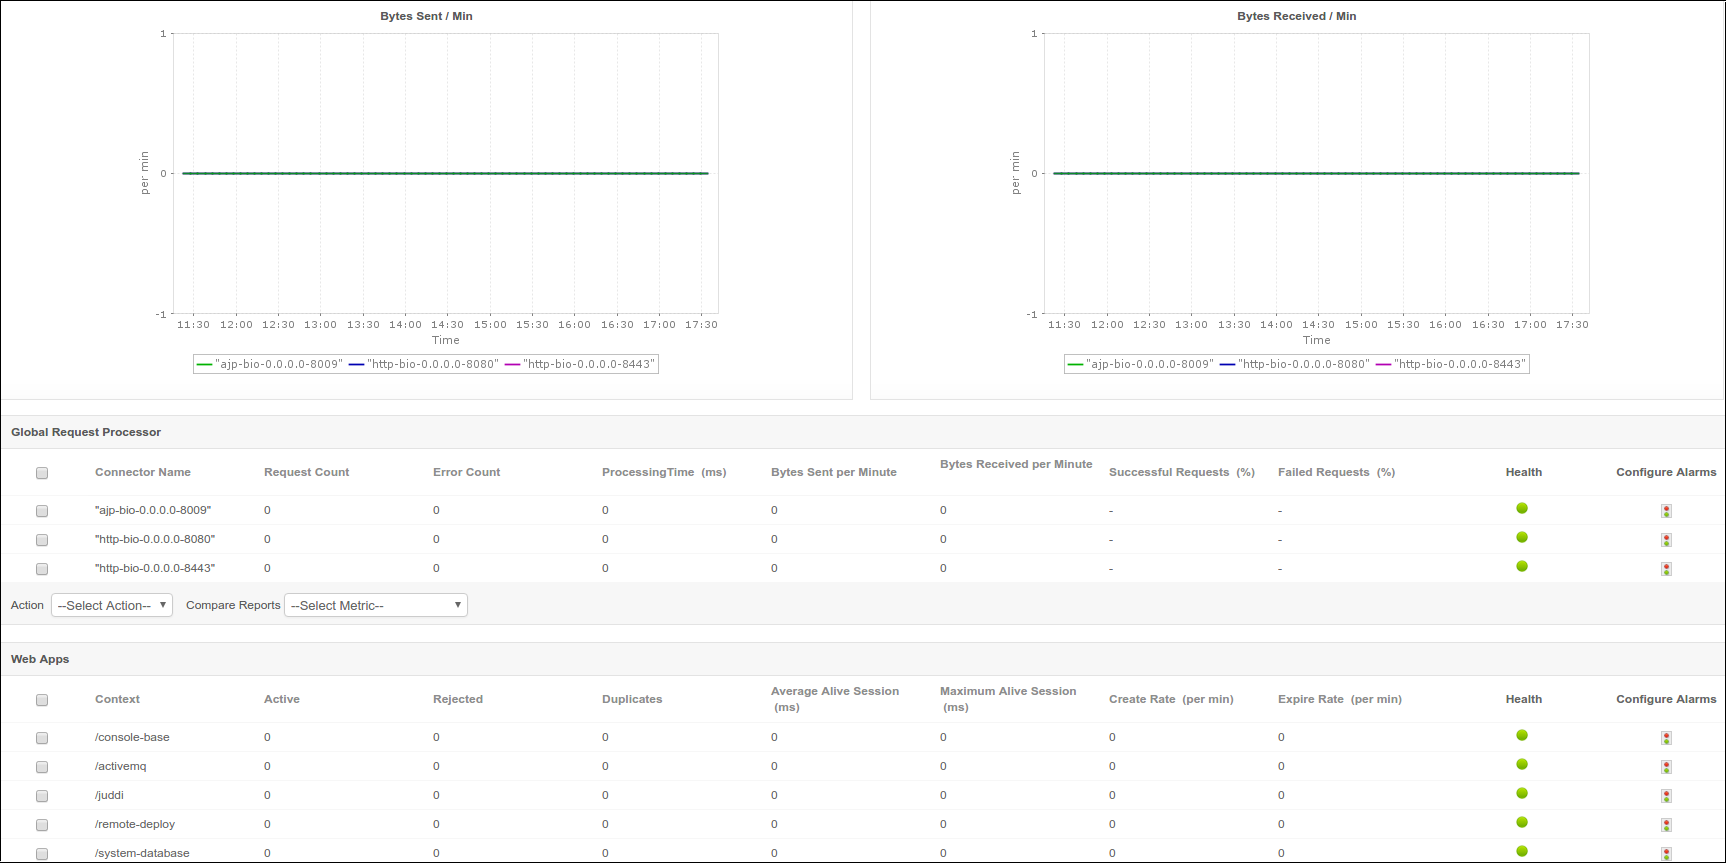
Monitor the status of your web apps
View metrics like bytes sent and received and the number of requests executed successfully. With information about your deployed web apps shown alongside application server stats, you can keep track of their health and the status of sessions.
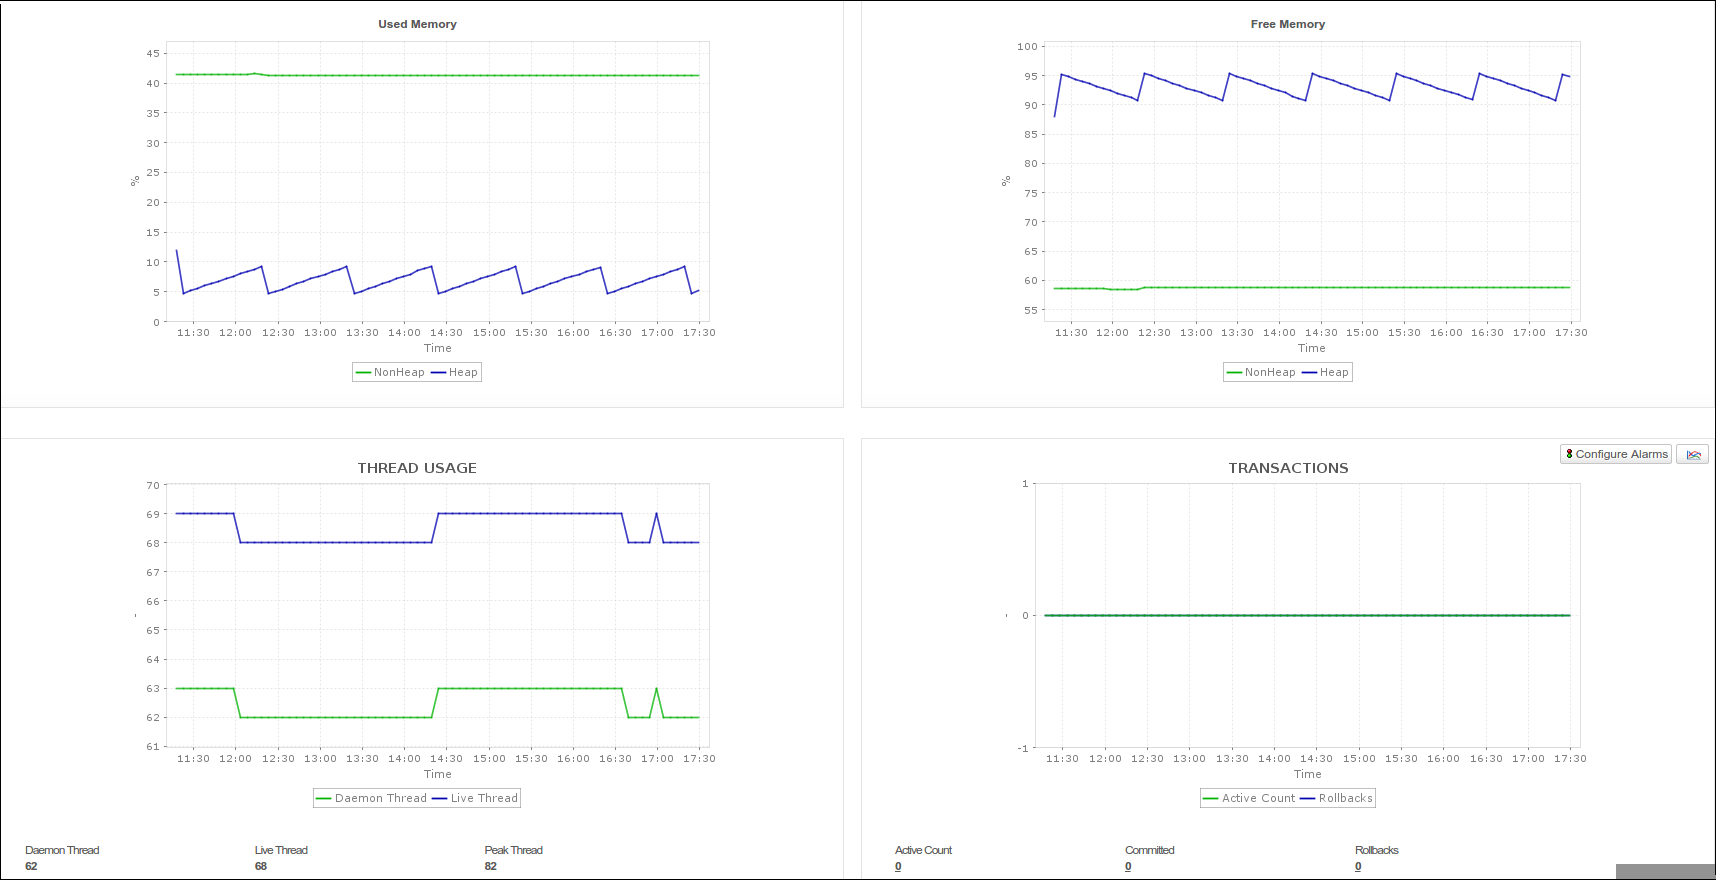
Keep tabs on thread usage and transaction status
Understanding thread activity can give clear insight into the current operational status of your Geronimo server. The number of live, peak, and daemon threads indicate how much load your server is processing. Keep an eye for the thread stats and identify and troubleshoot bottlenecks quickly. Also, the 'active' or 'rollback' numbers are a good indicator of the status of transactions in your Geronimo server.

View comprehensive reports for analytical decision making
We provide numerous reports that help to analyse your Geronimo server's performance trends, enabling you to make informed decisions with respect to your server infrastructure. Also, you can create you own custom reports to better understand the impact of your server's performance on your business.

