Effective NGINX monitoring is critical for identifying configuration issues, optimizing worker processes, and ensuring high availability across your application delivery controller architecture. Applications Manager's NGINX monitoring tool offers complete visibility into performance, traffic behavior, and request processing. It enables DevOps teams to monitor NGINX metrics such as active connections, upstream response time, and SSL health to ensure optimal server stability.
Why you need a complete NGINX monitoring solution
NGINX monitoring tools like Applications Manager enables you to track the performance of your NGINX web servers with the help of following capabilities:
Monitor key NGINX performance metrics in real time
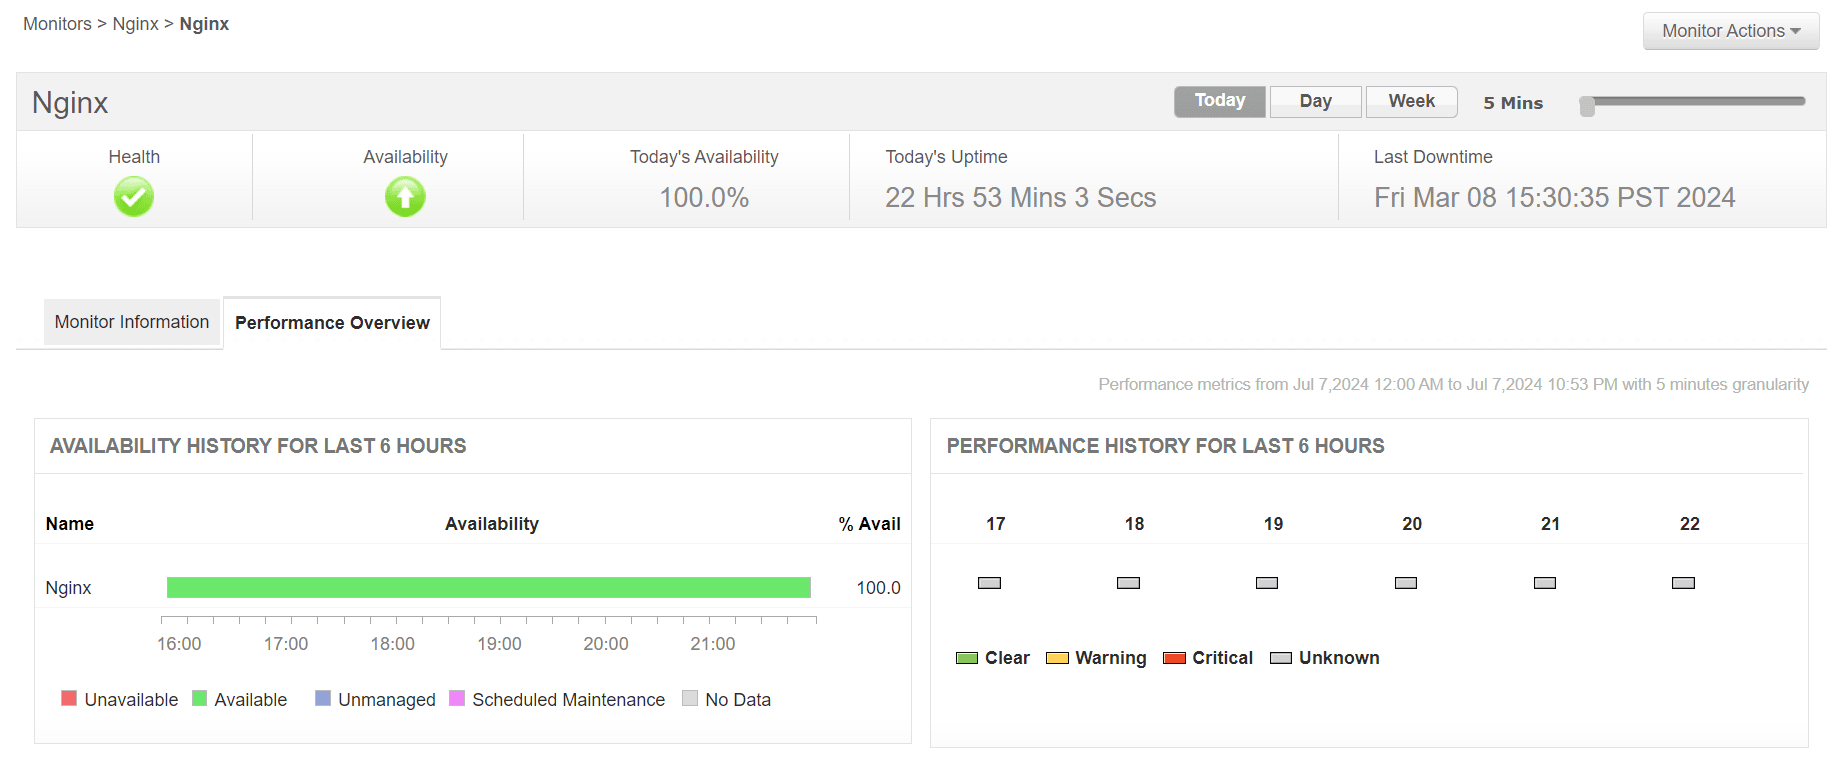
Obtain a comprehensive overview on the performance of your servers in real time using NGINX monitoring dashboards. Keep constant track of the availability and health of your NGINX web servers to ensure your web servers are up and running without any interruptions. Find out how long your NGINX web servers take to respond to requests to estimate the processing capacity of your web servers and to take corrective actions before end users are impacted. Tracking these vital NGINX metrics helps IT teams prevent latency degradation and 504 Gateway Timeout errors.

Analyze NGINX requests and traffic patterns
- Obtain in-depth visibility into the request statistics of your NGINX servers to find out how much load your NGINX server is actually handling.
- By analyzing HTTP requests, throughput, and dropped connections, you can fine-tune reverse proxy configurations.
- Keep a close watch on the number of requests received per second by monitoring your NGINX servers.
- Gain detailed statistics on the number of requests received by your NGINX servers based on their states such as reading, writing, or waiting.
Monitor NGINX connections, active sessions, and client behavior
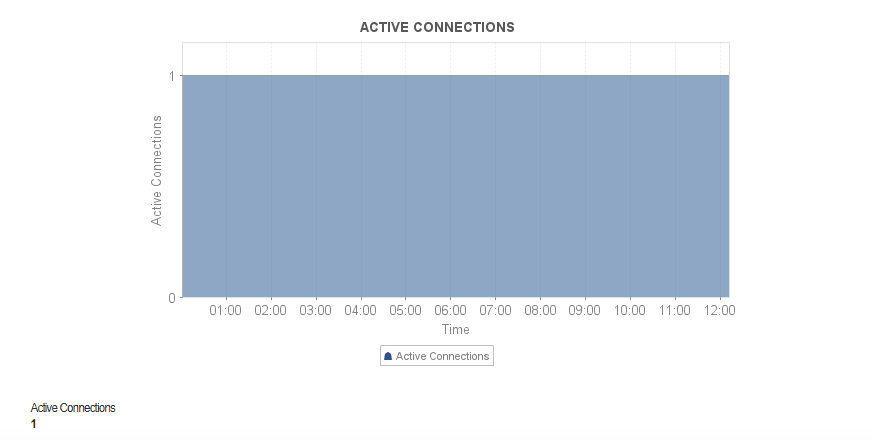
NGINX manages thousands of simultaneous client connections, so unusual spikes or slow-closing sessions can quickly affect performance. Monitoring NGINX's active connections, reading/writing/waiting states, and keepalive usage helps identify traffic surges, slow clients, misconfigured timeouts, or bottlenecks in your backend services.
With Applications Manager's NGINX monitoring, you can track the real-time connection count of each NGINX instance, monitor how clients are distributed across connection states, and get alerted when concurrency approaches critical thresholds. This visibility helps you detect connection buildup early, prevent resource saturation, and scale capacity proactively during high-traffic periods.

Monitor NGINX Plus performance metrics
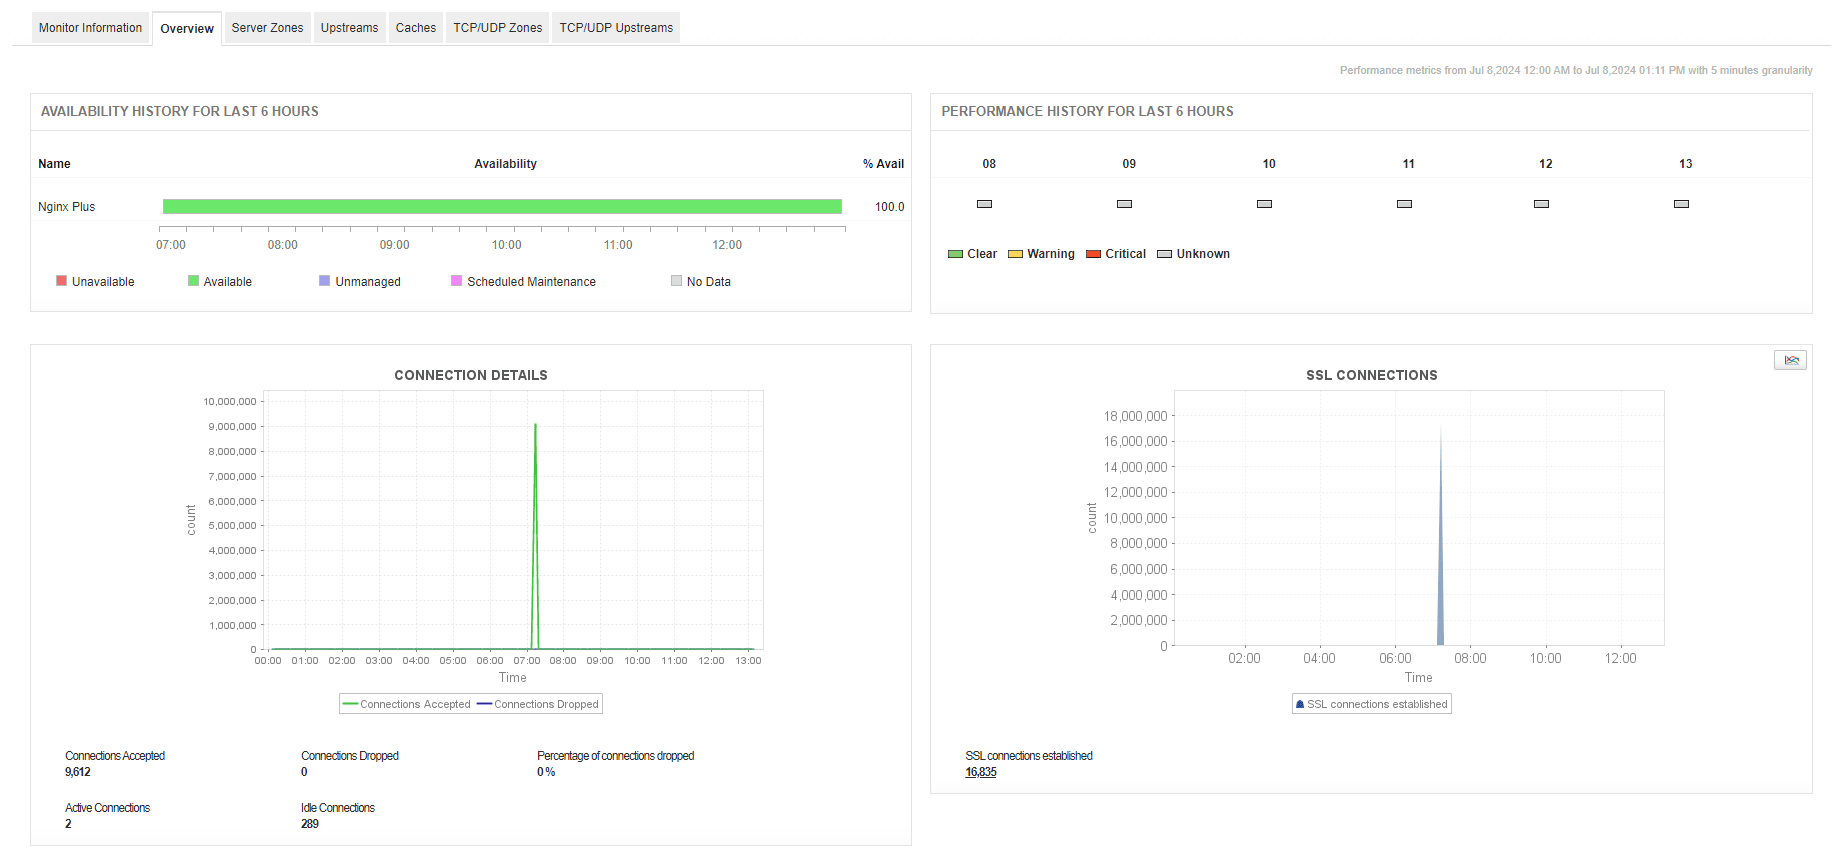
If you use NGINX Plus, the commercial version of NGINX instead of the open source NGINX web server, you can make use of Applications Manager's NGINX Plus monitoring capabilities to obtain deep visibility into the health of your NGINX Plus servers. You can also get deep insights into additional enterprise-graded features, such as SSL, TCP connection statistics, server zones and their corresponding upstream servers, content caching, and more.

Enable proactive alerting and troubleshooting
To ensure maximum uptime, modern IT teams need more than just raw data—they need actionable intelligence. Applications Manager acts as a comprehensive NGINX performance monitor by offering automated fault management. Set dynamic baseline thresholds for critical KPIs like CPU utilization, memory consumption, and dropped connections. When an anomaly is detected, the NGINX monitoring tool can automatically trigger corrective actions, such as executing localized scripts to restart the NGINX service or sending immediate notifications via email, SMS, or third-party ITSM tools like ServiceNow and Slack.
Using Prometheus? Integrate with Applications Manager for NGINX monitoring
If you already use Prometheus and scrape metrics from NGINX, you can simply integrate Applications Manager with Prometheus and visualize the NGINX metrics in Applications Manager.


