SAP HANA MDC Monitoring
SAP HANA MDC (Multitenant Database Containers) enables a single HANA system to host multiple isolated tenant databases, each with its own users, roles, and data sets. This architecture simplifies database management, improves resource utilization, and supports scalable, flexible application deployment.
At the core of SAP HANA MDC is the System Database (SystemDB), which governs the entire system landscape. It handles essential functions such as configuration management, licensing, monitoring, and tenant operations. Unlike tenant databases that store application-specific data, SystemDB manages system-level control and metadata. Monitoring the SystemDB is critical to ensure high availability, maintain service health, and coordinate lifecycle events across all tenants.
Applications Manager’s SAP HANA MDC monitoring tool offers deep visibility into both the SystemDB and tenant databases. It helps you track resource usage, service performance, backup history, transaction loads, and replication status in real-time. With instant alerts, detailed diagnostics, and insightful reporting, you can detect performance bottlenecks, avoid downtime, and ensure the stability of your multitenant SAP HANA deployment.
Monitor memory and CPU usage in real-time
Stay on top of resource consumption by monitoring key metrics such as memory utilization, CPU usage, and the number of CPUs in use across the entire HANA system. Track total and used physical memory, along with swap memory allocations, to better understand how system resources are being consumed. These insights help identify potential bottlenecks and support smarter decisions around capacity planning and system tuning.

Analyze connection activity and schema utilization
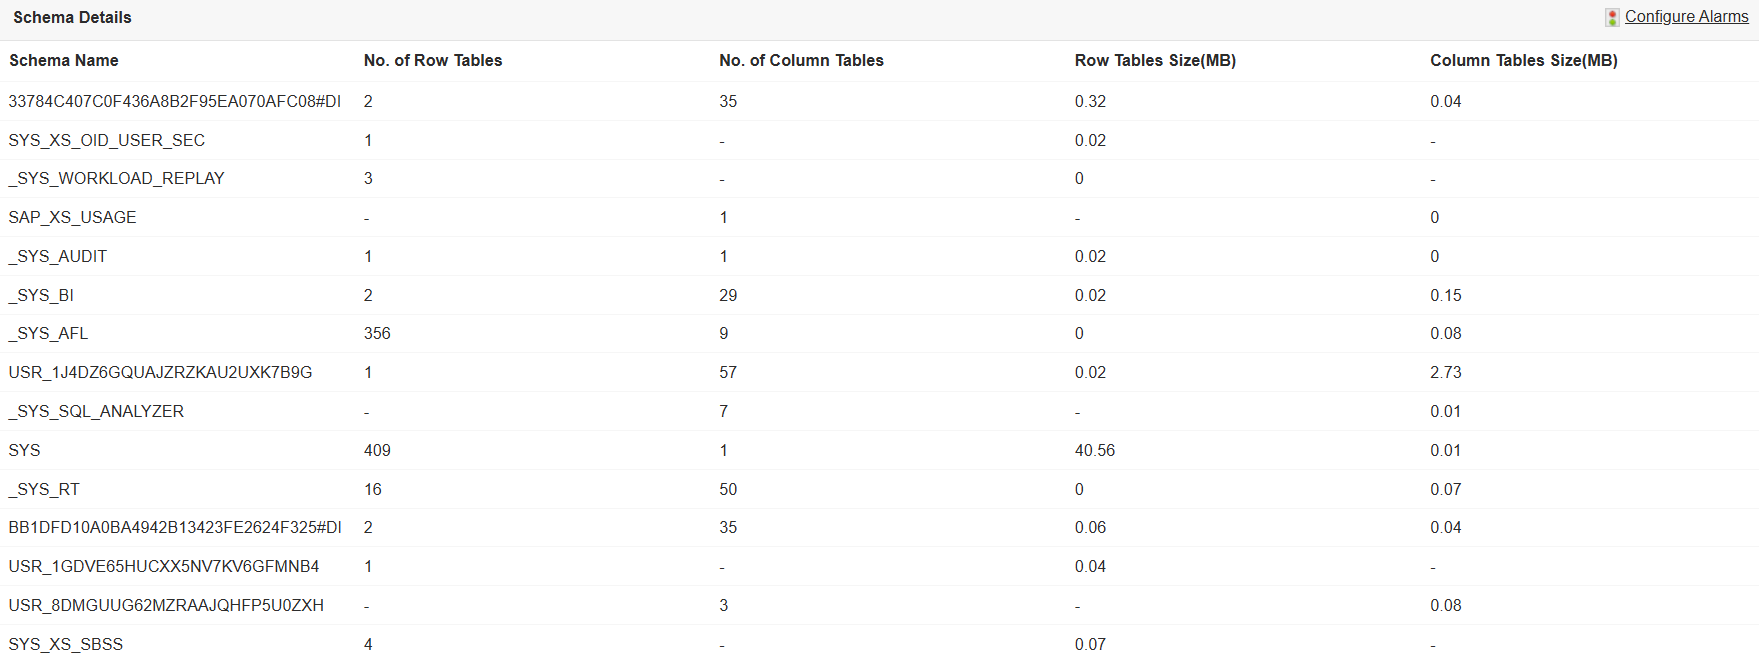
Gain visibility into database activity by tracking the number of active and inactive connections across your SAP HANA system. This helps identify usage patterns, peak access times, or unusual spikes in traffic. Additionally, monitor schema-level metrics like the number and size of column and row tables to understand schema growth and optimize resource allocation.

Analyze SAP HANA MDC memory usage and cache performance
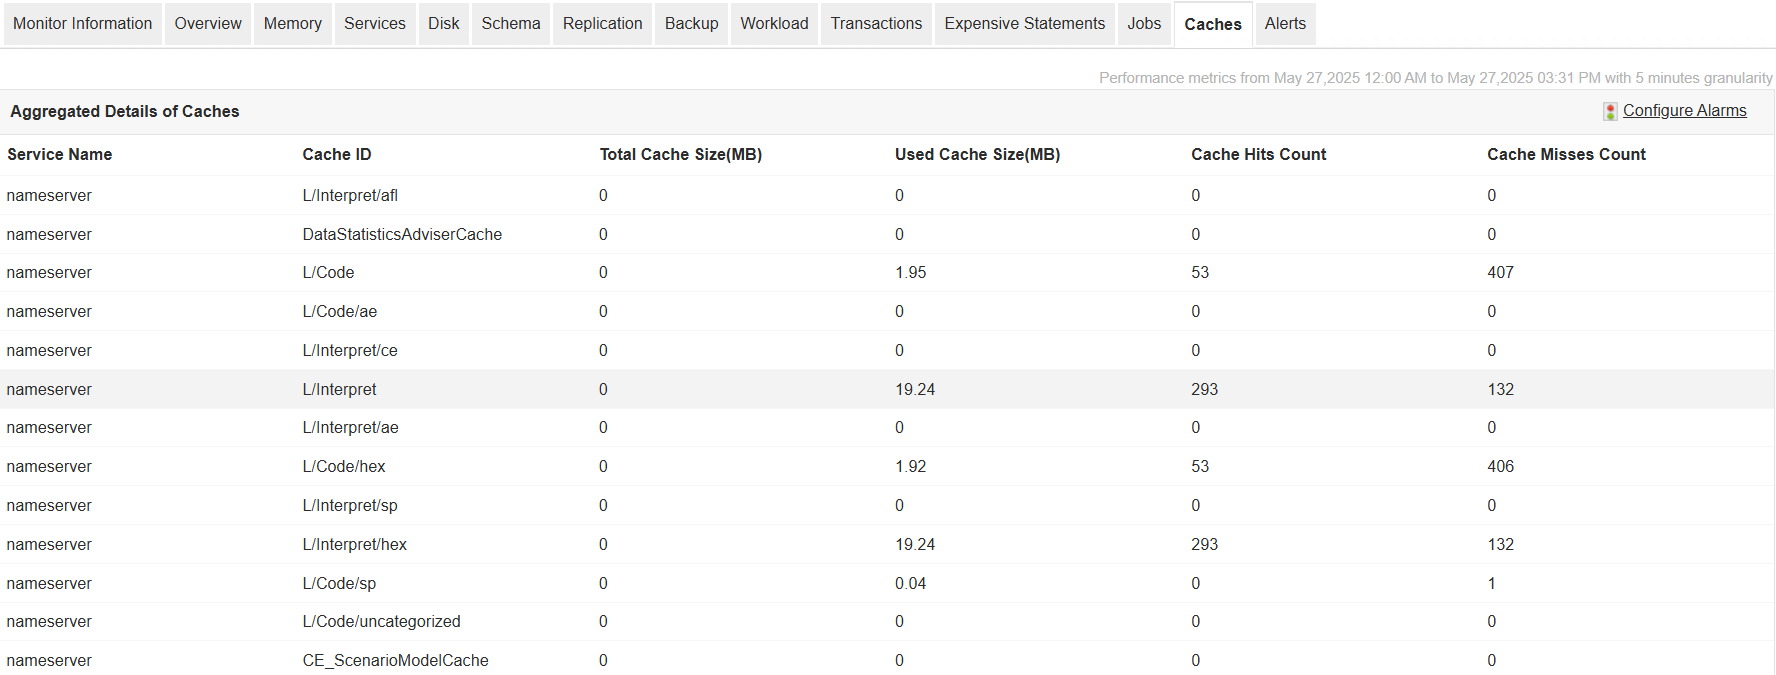
Go beyond basic memory stats with granular insights on how memory is allocated and used within HANA. Monitor memory used by column and row tables, code and stack, and total resident memory per host. Keep tabs on memory allocation limits to ensure that each host is operating within defined thresholds. Evaluate cache performance by analyzing cache size, usage, hit counts, and miss rates—helping you fine-tune caching strategies for better system efficiency.

Track disk usage and storage trends
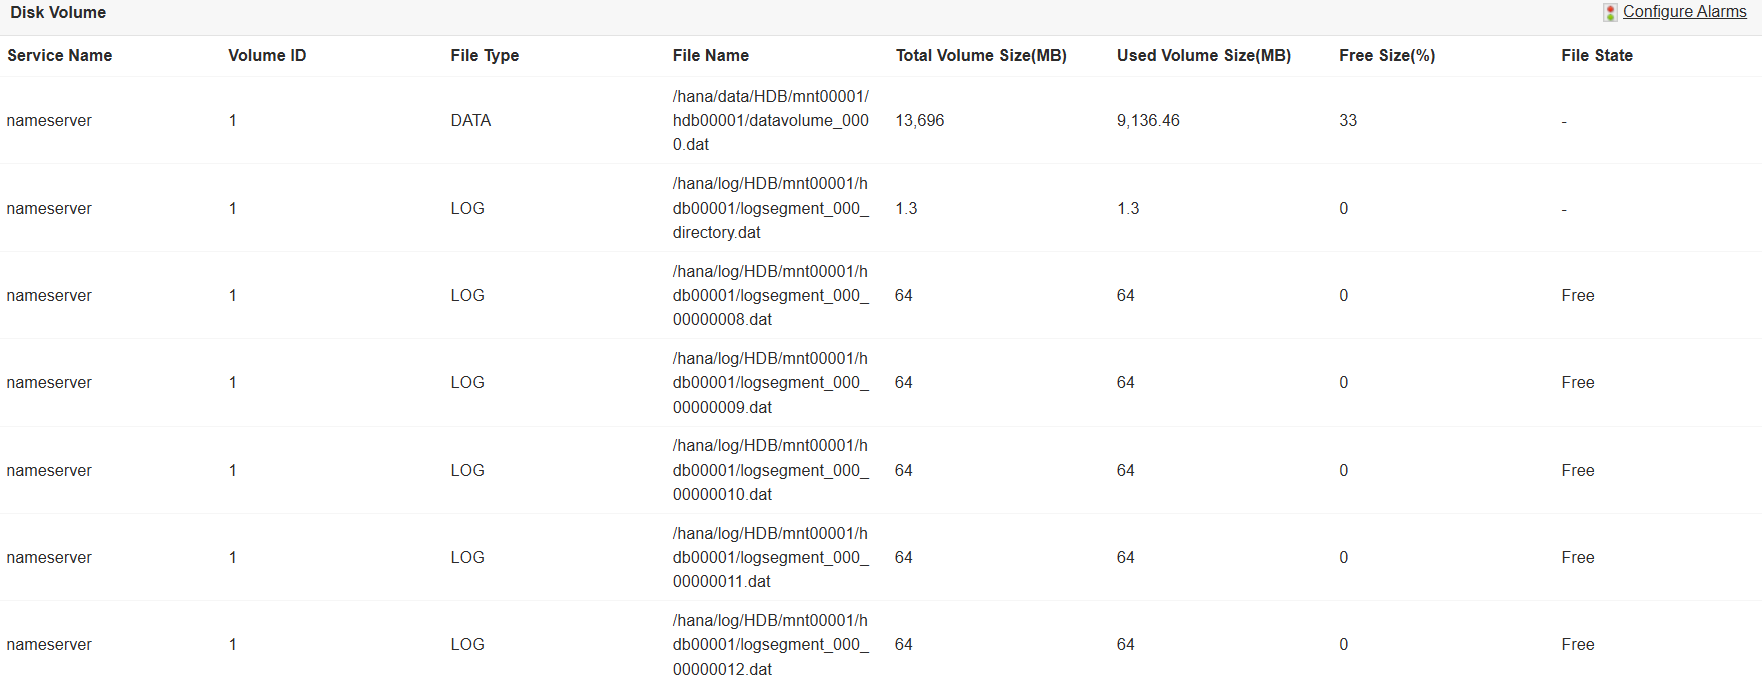
Monitor storage usage across all configured disk volumes. Track total and used disk space, disk free percentages, and volume sizes, along with the associated disk paths and usage types. These metrics help prevent storage overflows, ensure optimal allocation, and allow for better planning of storage resources in growing environments.

Monitor service-level metrics and system workload
Keep a close eye on individual HANA services by tracking CPU and memory usage, request rates, response times, active and pending requests, thread count, open file count, and service status. In addition, gain a comprehensive view of overall workload through metrics such as execution, compilation, transaction, commit, and rollback rates. Assess system performance under varying loads and fine-tune resource distribution accordingly.

Ensure high availability with replication and backup insights
Monitor your system’s high availability setup by tracking system replication details such as logical site names, secondary hosts, replication modes, and status. This enables you to detect failover readiness and troubleshoot replication delays proactively. Stay updated on backup operations by reviewing the most recent backups along with metrics like size, type, duration, and status, ensuring that data protection measures are consistently effective.

Identify long-running jobs and blocked transactions
Quickly detect and investigate long-running or stalled operations with detailed job metrics including connection ID, schema, object name, start time, and progress. Track transaction statistics to monitor active, precommitted, or aborting transactions. Analyze blocking scenarios by identifying locked objects, waiting and owning transaction IDs, and the SQL statements involved—helping you resolve concurrency issues efficiently.

Monitor expensive SAP HANA queries with real-time alerts
Pinpoint performance-intensive SQL statements by analyzing their duration, memory size, CPU time, and type of operation. Identify top consumers of system resources and take optimization measures before they affect user experience. Keep your environment secure and healthy with real-time alerts—view the latest 100 alerts generated between collection cycles, including severity, timestamp, and detailed descriptions for quick resolution.
Get started with SAP HANA MDC monitoring in minutes!
With Applications Manager, you can monitor your SAP HANA MDC environment end-to-end—from system resource usage to tenant activity and replication status. Get real-time insights, resolve issues faster, and ensure consistent performance across your HANA deployment. Download a 30-day free trial today and explore everything our SAP monitoring suite has to offer.

