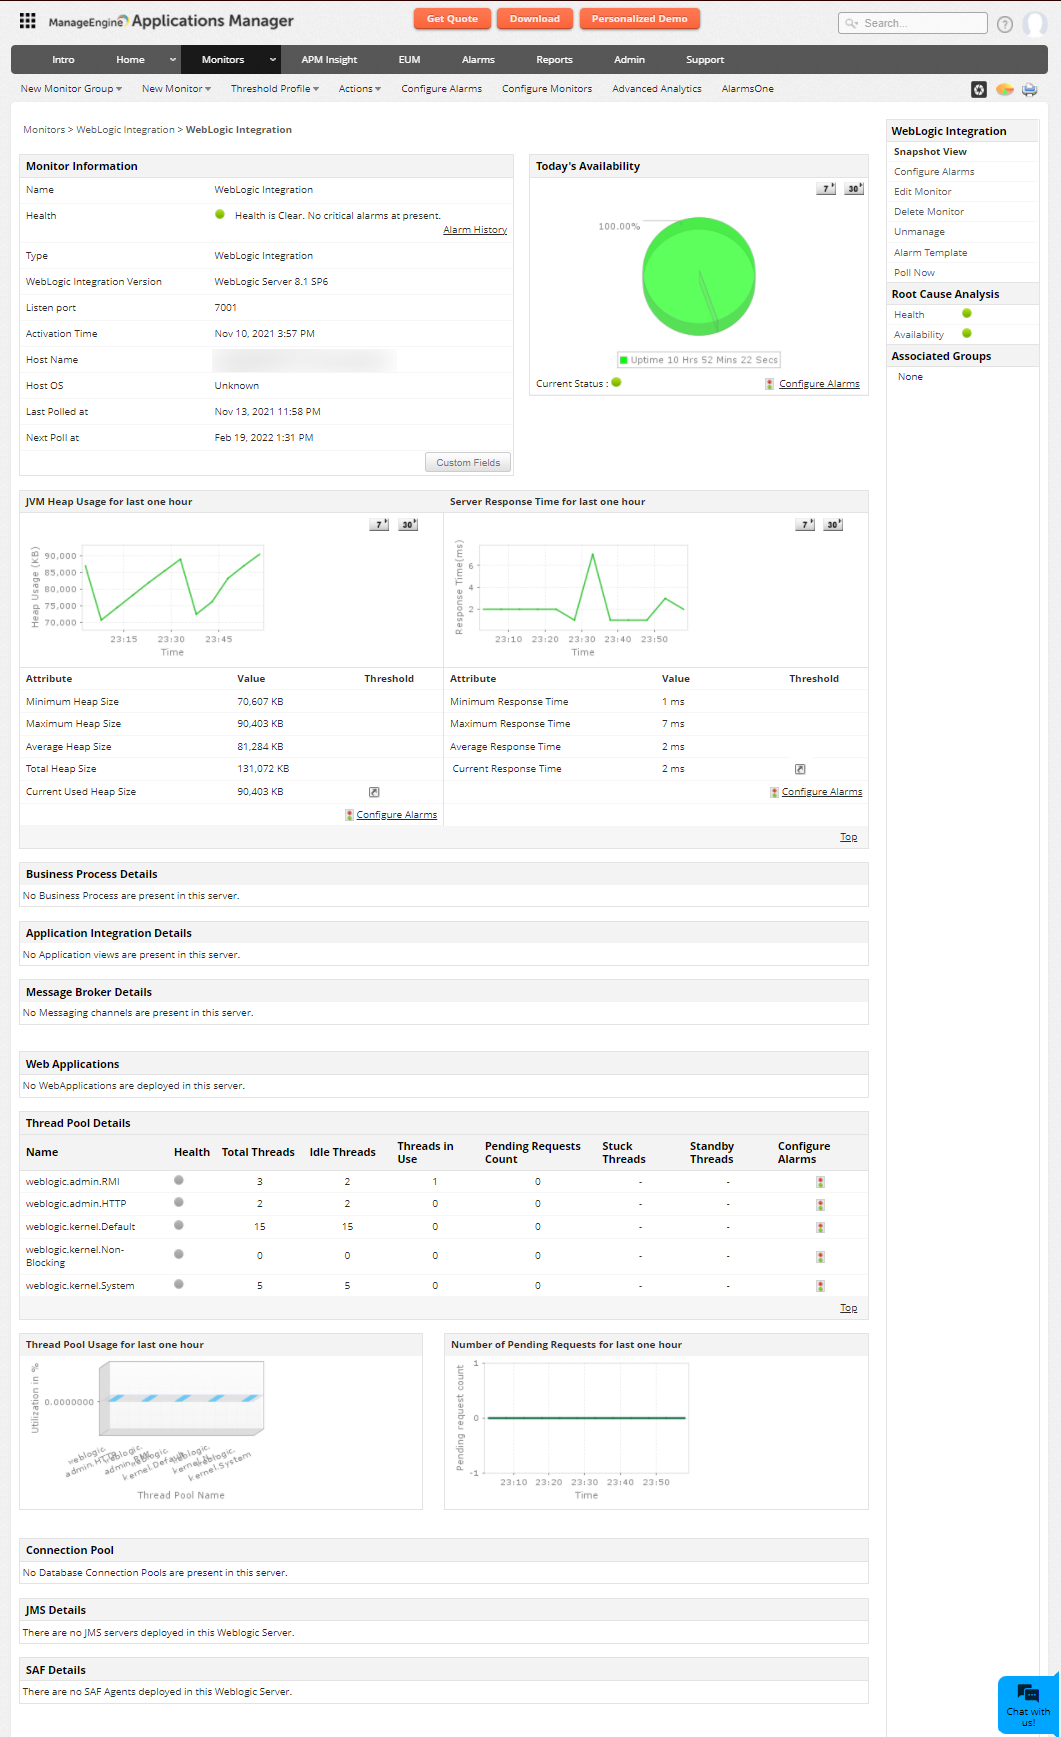
WebLogic Integration Server Monitoring
- Do you want to ensure that your WebLogic Integration Server is always up?
- Do you want to track the performance of your Business Processes through WebLogic Integration Server?
- Do you want to track the performance of your WebLogic Integration Servers during different periods?
Applications Manager monitors the performance and availability of BEA WebLogic Integration Servers.
Applications Manager automatically diagnoses, notifies, and corrects performance and availability problems not only with WebLogic Integration Servers, but also with the servers and applications in the entire IT infrastructure.

WebLogic Integration Monitoring includes the following version of WebLogic Integration Server.
- WebLogic Integration Server 8.x
"We, at Hughes Network Systems are very pleased with the AppManager product. We looked at a number of other Application Management products, and they were all very expensive. Your product, allowed us to manage our WebLogic layer of our PeopleSoft application, at a reasonable cost. Support has been very responsive, and you have added a number of features that we have requested (Polls to retry can be configured individually for any attribute of a Monitor and Multiple varbind support in alarm messages)"
Anthony MyersSenior Systems Analyst
Hughes Network Systems, LLC
WebLogic Integration Server monitoring includes delivering comprehensive fault management and proactive alarm notifications, checking for impending problems, triggering appropriate actions and gathering performance data for planning, analysis, and reporting.
Some of the components that can be monitored in WebLogic Integration Servers are:
- Business Process Details (Completed Instances, SLA Exceeded Instances, Running Instances, etc.,
- Application Integration Details (Service Count, Service Error Count, Event Count, etc.,)
- Message Broker Details (Message Count, Subcriber Count, Dead letter count, etc.,)
- Other parameters as in WebLogic, like JVM Heap Usage, Server Response Time, More
WebLogic Integration Server Management Capabilities
- Out-of-the-box management of performance and availability of the WebLogic Integration server
- Monitors WebLogic Integration performance statistics such as Business Process Details, Application Integration details & Message Broker details, database connection pools, servlets, JVM memory usage, user sessions, etc. alarms can be configured for these parameters.
- Based on the thresholds configured, notifications and alarms are generated. Actions are executed automatically based on configurations.
- Performance graphs and reports are available instantly. Grouping of reports, customized reports, and graphs based on date is available.
Start monitoring your WebLogic integrations servers now!
Applications Manager offers a 30-day free trial where you can monitor WebLogic integrations servers and understand how it may be the ideal product for your organization's WebLogic monitoring needs. It is easy to setup and configure. Download now!

