Help
NetFow Analyzer's Traffic Pattern Analysis enables you to analyze the behavioral changes of the network interface to detect any abnormal traffic behavior to present as anomalies. Network traffic patterns are analyzed, monitored and if any anomalies are detected, they are generated as Alerts. It helps to predict any bandwidth bottlenecks that is drastically affecting the network health of an organization. With pattern analysis, you can see what's happening with your network traffic and be proactive with the anomaly detection and traffic data's real-time behavior.
NetFlow Analyzer enables you to observe the current network traffic on any network interface. To identify modifications in network behavior, the traditional approach involves generating reports. Now, with the integration of machine learning (ML) and artificial intelligence (AI) in Network Traffic Pattern Analysis, you can now automatically predict network patterns within an interface to identify any abnormal occurrences.
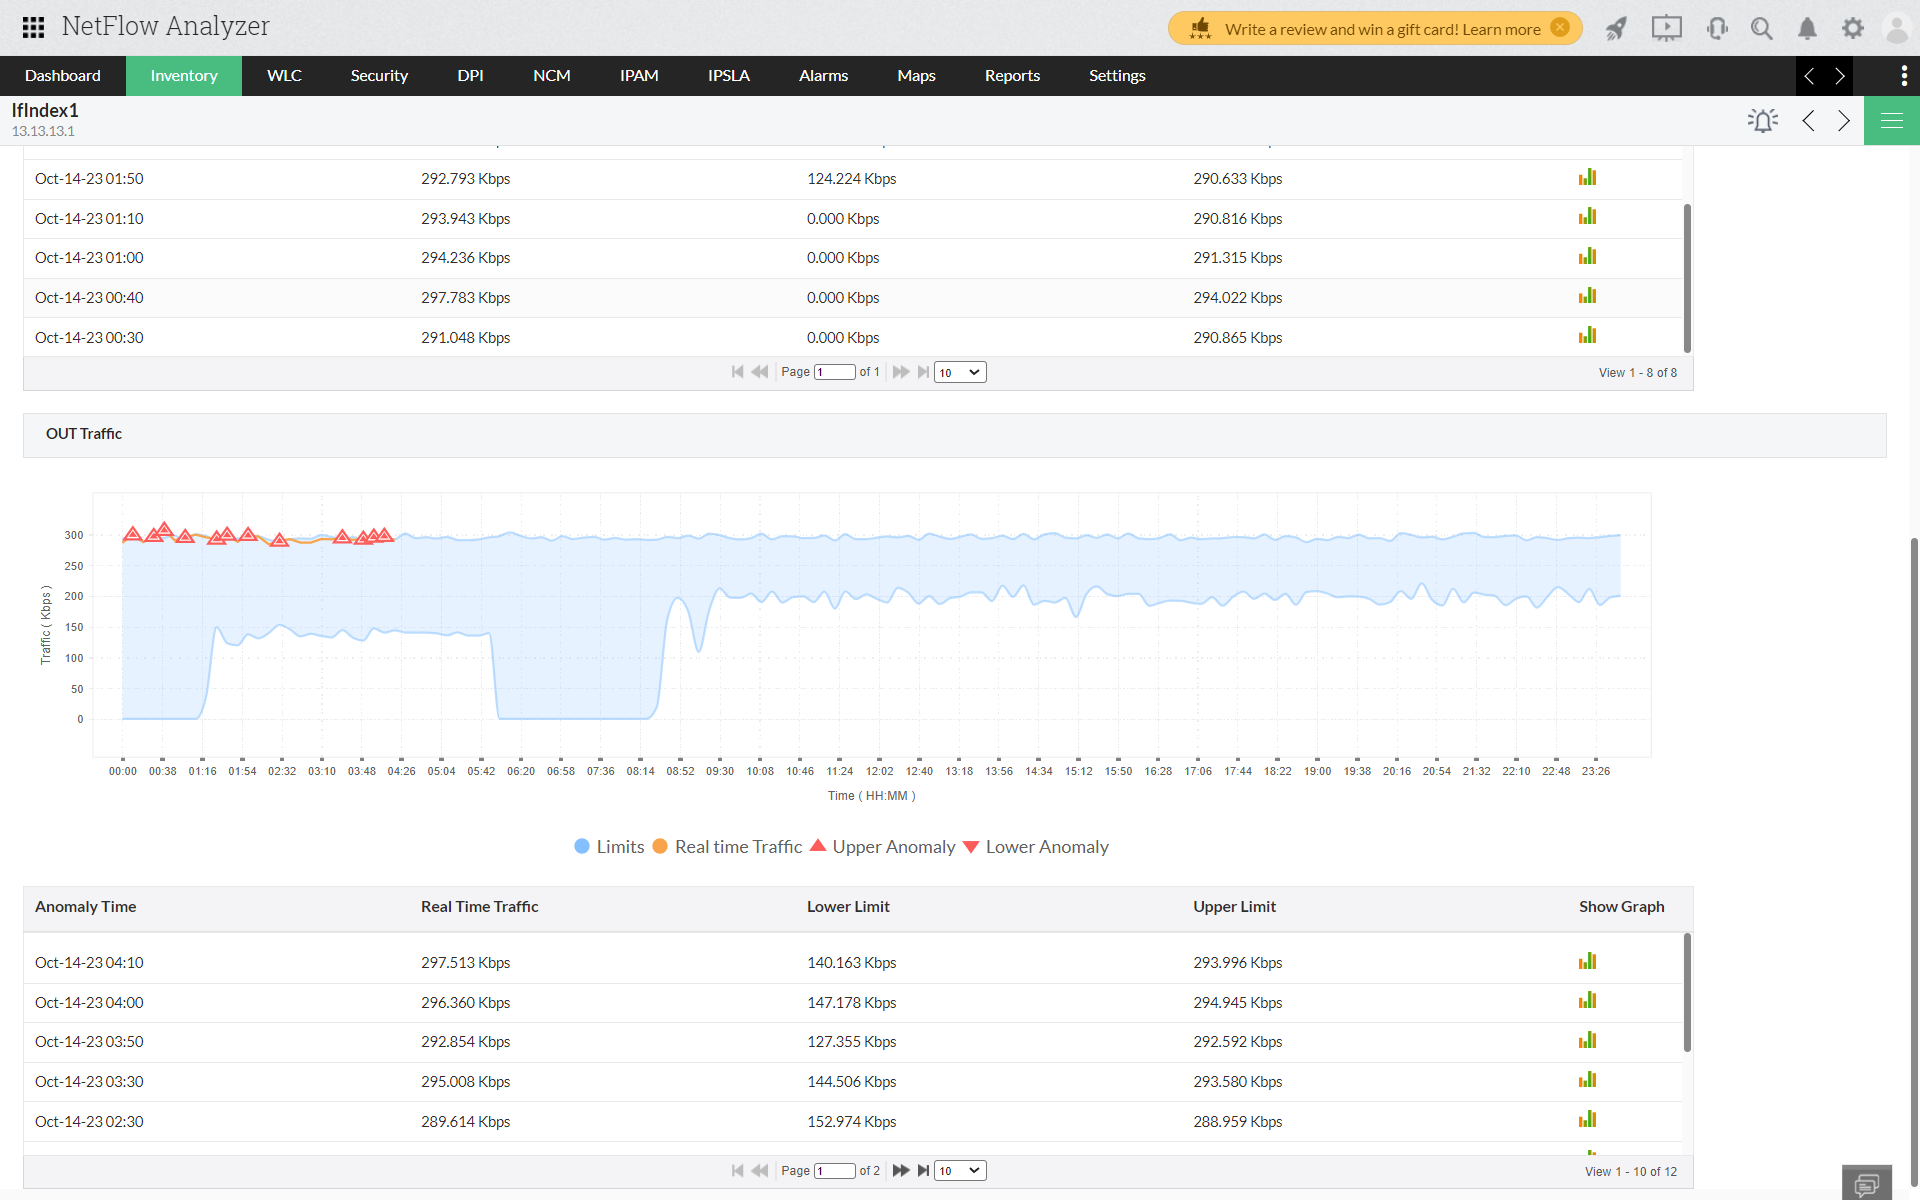
Network Traffic Pattern Analysis provides insights into the IN (incoming) and OUT (outgoing) traffic for a specific interface over a specified time frame, with the default setting being every 10 minutes. This analysis categorizes and segments data for each 10-minute interval within the past hour, allowing us to calculate an average and identify patterns in network traffic.
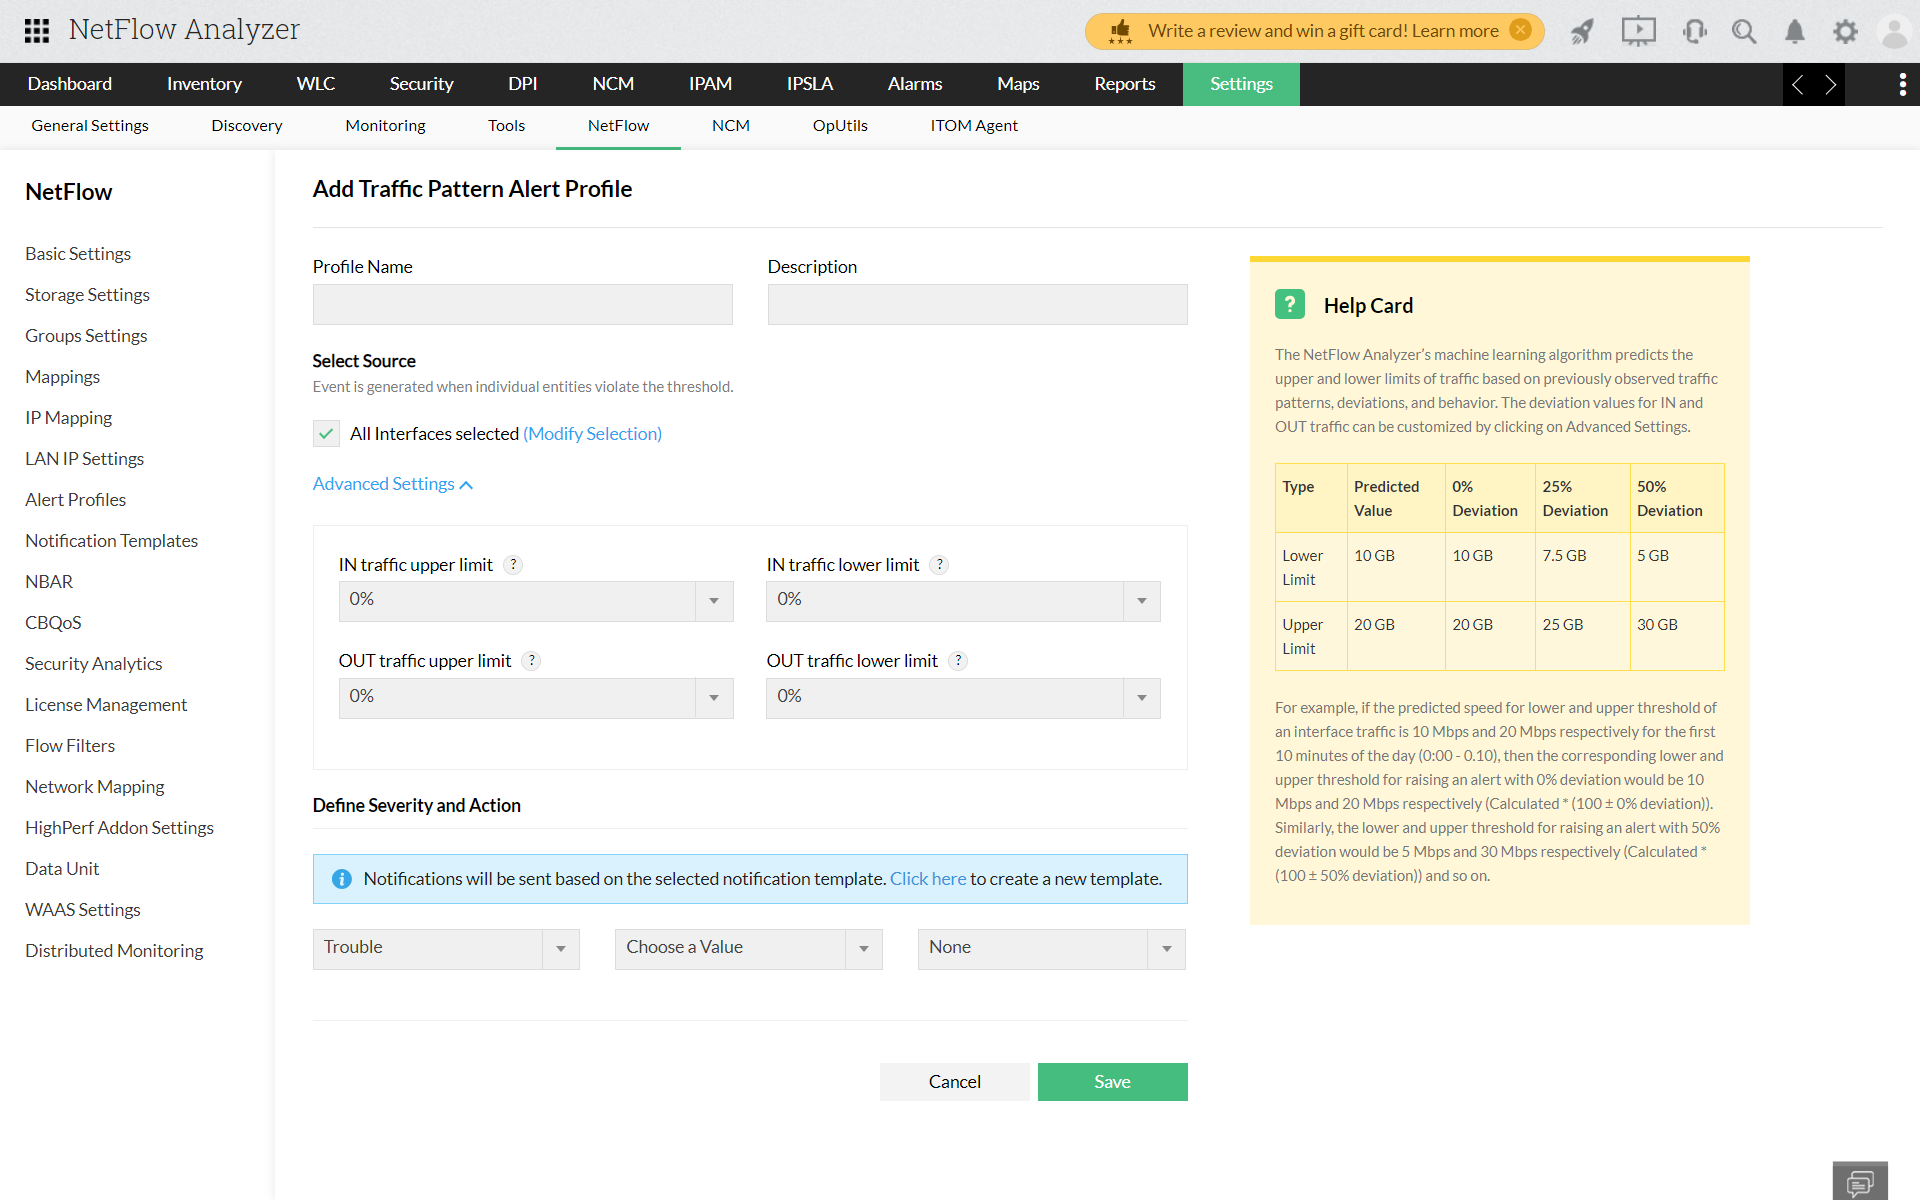
Utilizing historic traffic data, a data point from every 10 minutes predicts how a normal data behavior should be by applying ML and AI models. Baselines are established to provide buffer time periods for the upper limit and lower limit of traffic data for a respective data point.
Real- time traffic data travels through this to provide a network pattern and also learns for future predictions.
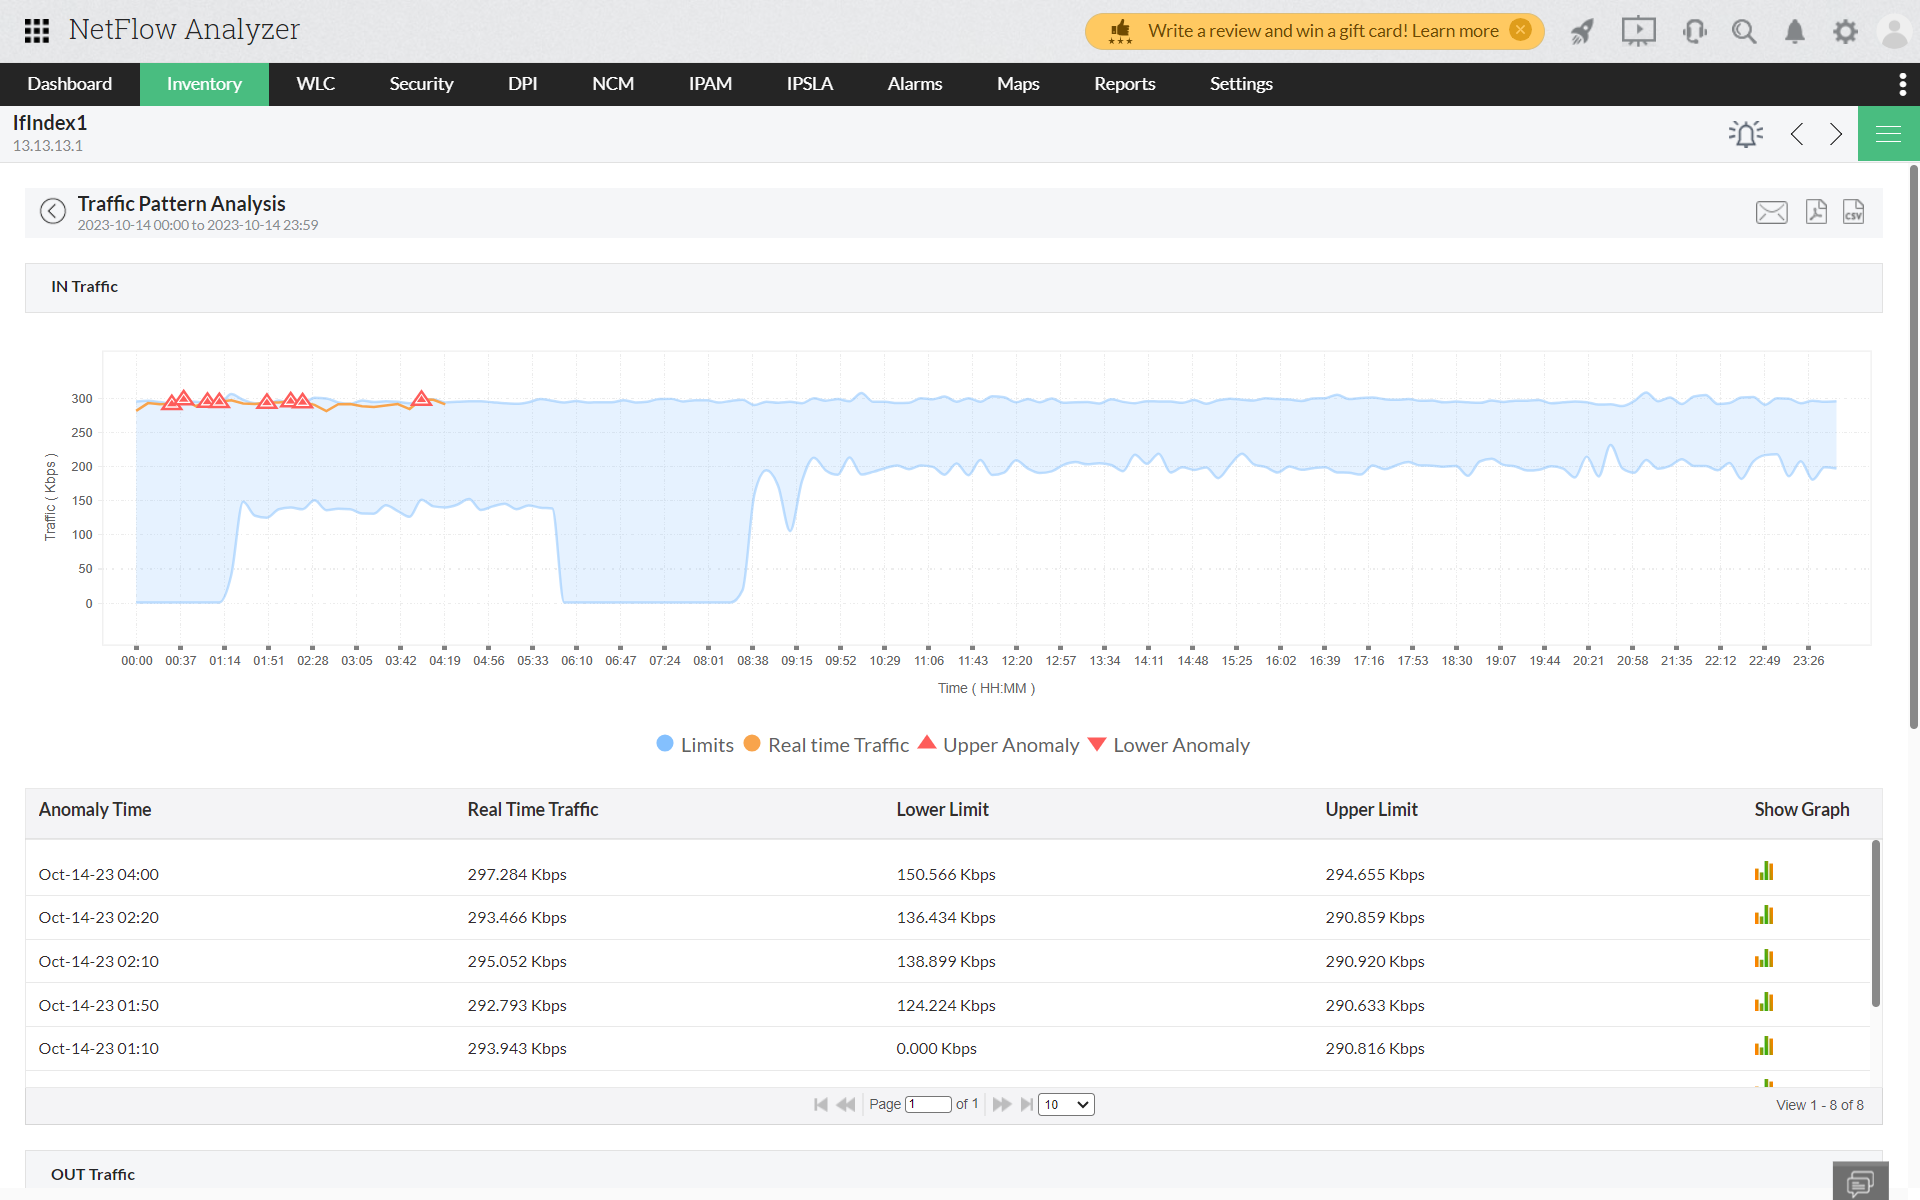
At any time, if there is an unexpected spike in traffic, the amount of traffic will then exceed the buffer time (the upper limit), it is detected as an anomaly. Similarly, if an ISP or a critical interface goes down, there is a decline in network traffic extends beyond the lower limit of the buffer, it is also detected as an anomaly.
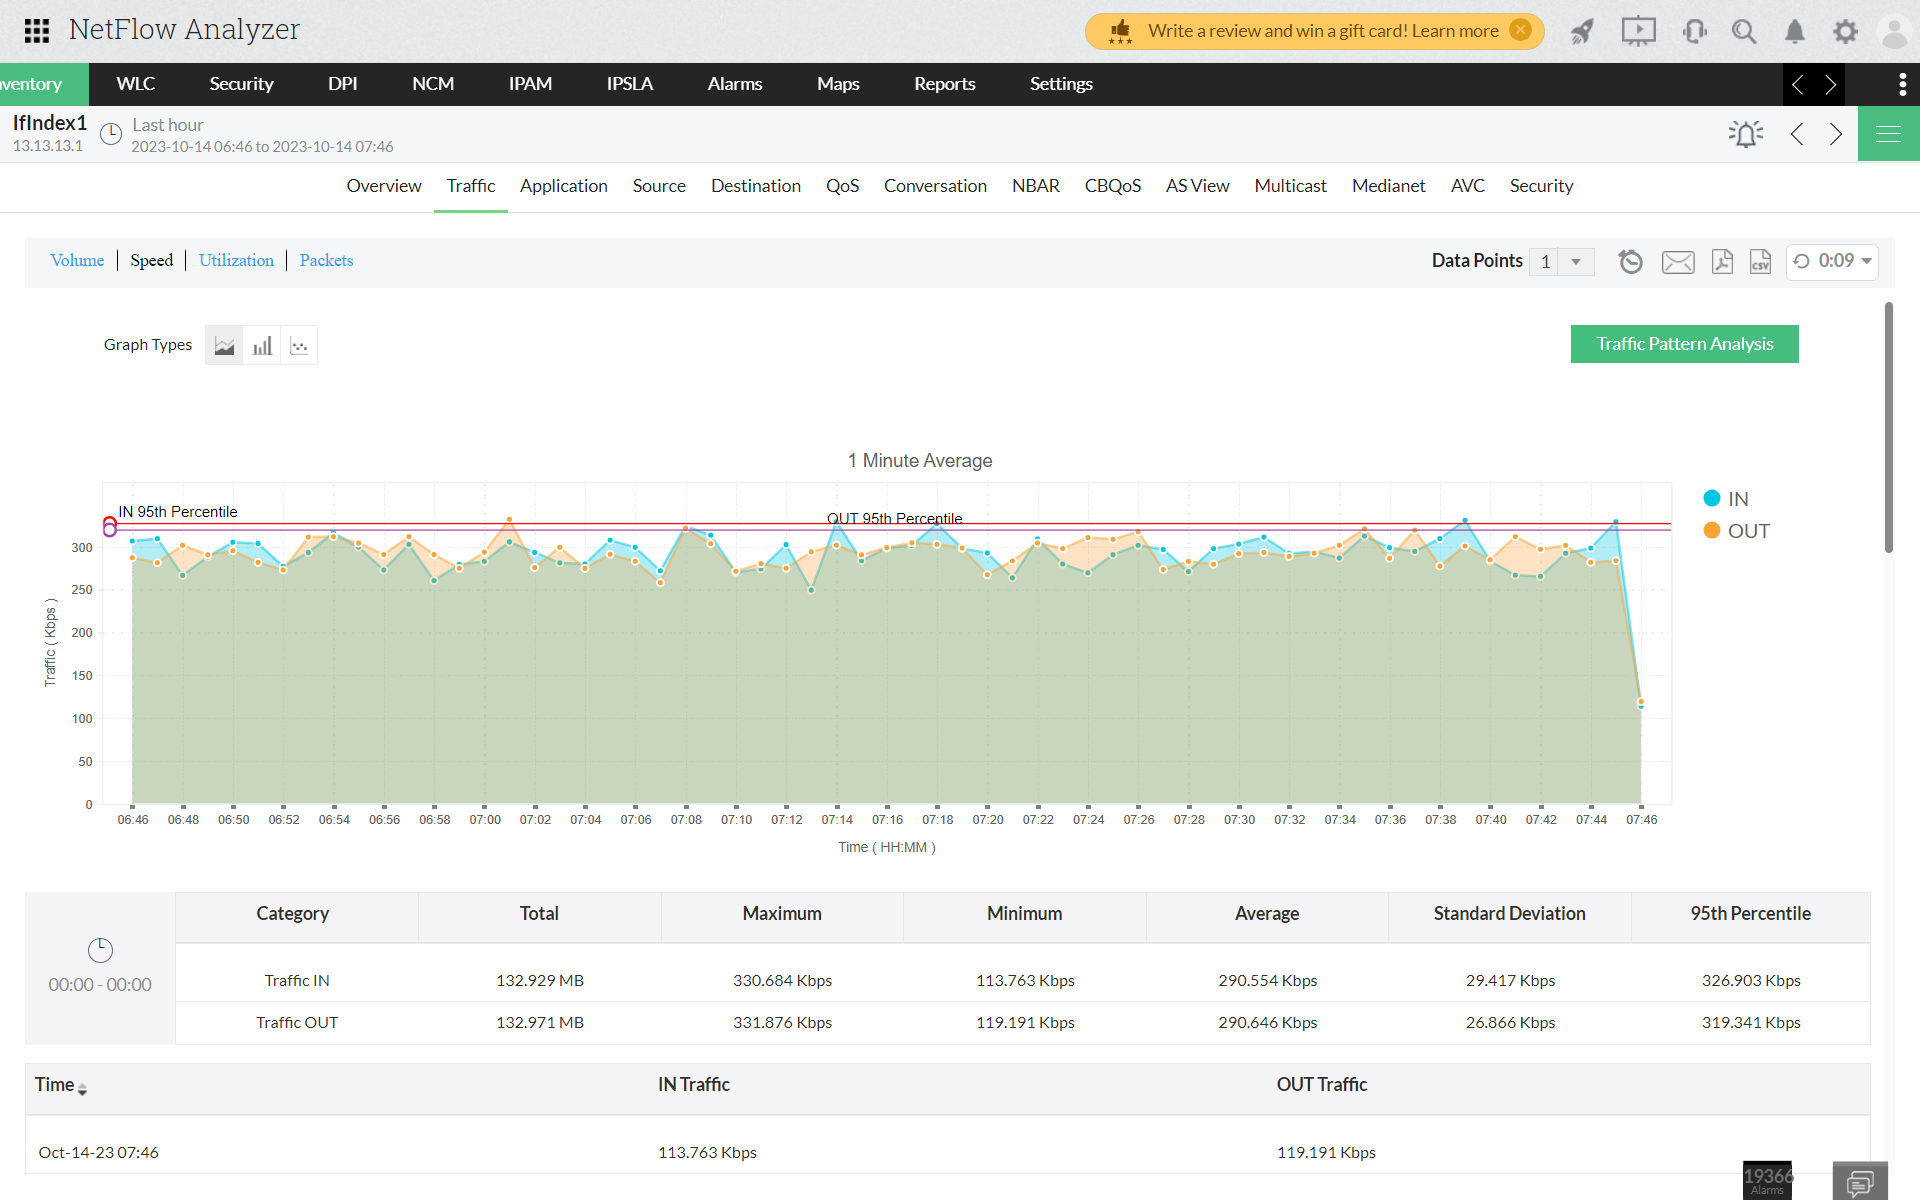
Traffic pattern alerts are generated from the anomalies on a real-time basis. To monitor the traffic pattern of an Interface, you can navigate to Interface >> Traffic >> Pattern Analysis.
Thank you for your feedback!