Auditing Compliance
Grouping policies for audit
The first step in creating a compliance audit is to group the policies against which you want to audit a specific group of target systems for compliance.
To create a policy group,
- Go to Compliance > Policy Groups.
If you're just starting out and haven't created a Policy Group yet, click on View Compliance Policies. It will open up a wizard that displays all the available policies along with their details, such as the category of the policy, OS platform to which it applies, and the total number of rules against which targets will be scanned.
NoteOnce a policy group is created, the View Compliance Policies button will change to Create Policy Group.- Give a meaningful name to the Policy Group.
- Select the policies you want to group together for audit. Clicking on a policy reveals a detailed breakdown. Refer to this document to learn more about the policies supported and how they're structured.
- Click on Create Group.
The created group will be listed under the Policy Groups section. Click the created policy group to view the policies included in the group. You can use filters to view policies by Deprecation Status and OS platform. The deprecated policies refers to the obsolete policies that are superseded by their latest upgraded version. The deprecated policies will appear greyed-out in the console. Vulnerability Manager Plus immediately supports the superseded version of all the deprecated policies. Later when you map target system groups to this policy group, they will appear under the Mapped Target Groups section.
Under built-in templates, policy group templates built by consolidating policies based on OS and profile levels are readily available. Click a template to view the policies that are included in it. If you want to use these template policy groups for audit, click the Add to Policy Groups button against the desired templates. These templates will now be available under Policy Groups and can be used for audits.
Configuring a Compliance Audit
Once you have a created a policy group, you have to link to a target custom group, where the compliance scan for these will be happening.
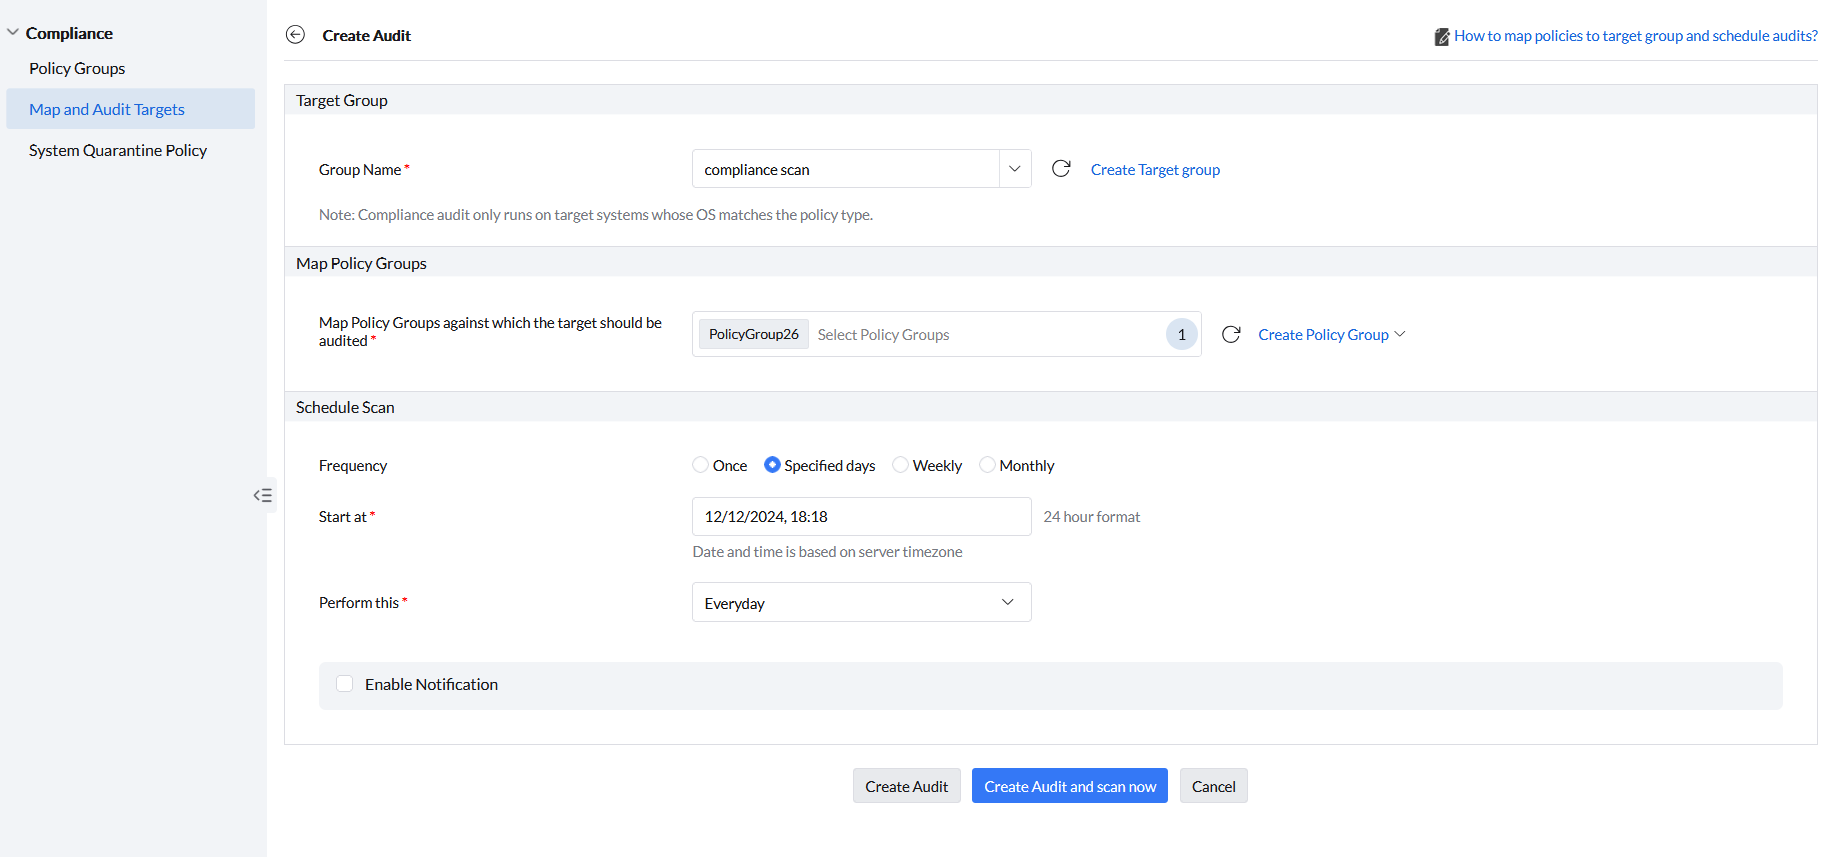
Click on Compliance → Map and Audit Targets → Create Audit.
A new window will be opened for creating audit. Under Target Group, choose the custom group, where you want to run the compliance check. Under Map Policy Groups section, under Map Policy Groups against which the target should be audited option, select the policy group that you have created.
Under Schedule Scan section, select Frequency for scan (it is recommended scheduling this daily, so that any deviations from compliance can be tracked easily.) and then under Start at option, choose the start date for scanning .
If you want to configure notifications regarding this CIS compliance audit, enable the check box on Enable Notifications.
After configuring these settings, click on Create Audit and scan now, if you want the compliance scan to happen immediately; Compliance scan will happen on the subsequent refresh cycle if you click on Create Audit.
Once an audit scan has been scheduled for a target group, the target group will be appear in the table in the Map and Audit Targets view. Systems belonging to the target group will then be periodically assessed for compliance against all the rules in the mapped policies based on the schedule. The resulting overall compliance percentage will be displayed for each target group. This overall compliance percentage indicates the percentage of systems that are secure (i.e, systems that achieved a compliance percentage of at least 90% each) out of the total systems scanned in the target group. Click on a target group to view its complete compliance details.
Overall compliance percentage = Number of secure systems (systems that achieved a compliance percentage of at least 90%)/ Total scanned systems * 100
Inside the target group
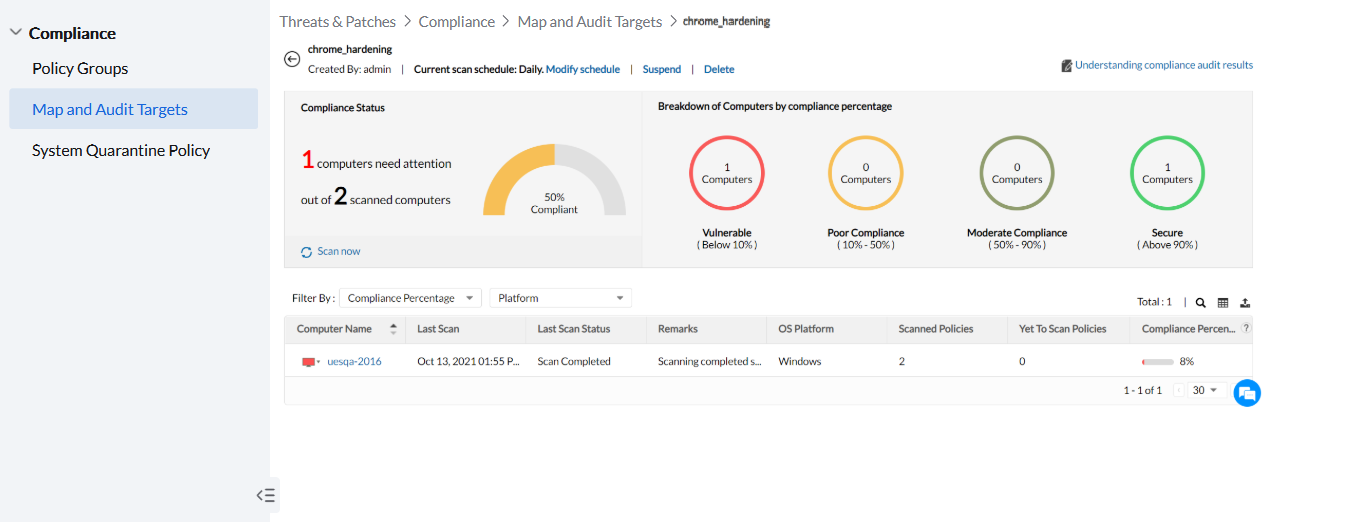
On the top, you can see the name of the target group, who scheduled the audit and what its scan schedule is. You can edit the schedule by clicking on the Modify schedule button.
Compliance Status
This section indicates the number of computers that need attention (i.e, computers whose individual compliance is below 90%) out of total scanned computers. According to Vulnerability Manager Plus, systems that have achieved a compliance of at least 90% are considered to be secure. The compliance percentage displayed here indicates the percentage of systems that are secure out of the total systems scanned in the target group. This percentage is the same as the overall compliance percentage of the target group.
Breakdown of computers by health
Computers are classified in this section by health based on their compliance percentage.
| Compliance Percentage of the systems | Health status |
| Below 10% | Vulnerable - indicates vulnerable computers |
| 10% - 50% | Poor Compliance - indicates systems with poor compliance |
| 50% - 90% | Moderate Compliance - Indicates systems whose compliance can be improved |
| Above 90% | Secure - Indicates secure computers |
The table view
The table section below lists all the computers belonging to this target group. Details such as OS platform, scanned and yet-to-scan policies, and compliance percentage for each computer are available here. In case, the audit is modified, after a scan, to map a new policy group or groups to the targets, these policies will remain unscanned until the next scan based on the schedule. Until then, these policies will be counted as Yet-to-scan policies. The compliance percentage of each system indicates the percentage of rules the computer has passed out of the total scanned rules (excluding unscored rules) from all the mapped policies.
Compliance percentage = Rules passed/(Total scanned rules - unscored rules) * 100
1.If the rules belong to policies that are yet to be scanned.
2.If the rules belong to policies that are not applicable to the system. This can happen if the policy is designed for a particular OS which doesn't match the OS of the system.
3.If the rules are labelled as unscored. While these rules are still counted towards the total rule count of a policy, their outcome will not be factored into the compliance percentage.
Also, if a policy group mapped to the target is modified, after an audit scan, to add/remove policies, those changes will not influence compliance percentage until the subsequent scan. Only after the systems are scanned in the subsequent scan against the modified list of mapped policies, the compliance percentage will change accordingly.
You can also view the compliance status and percentage of a computer on a per-policy basis. To do so, click on a computer.
Individual computer view
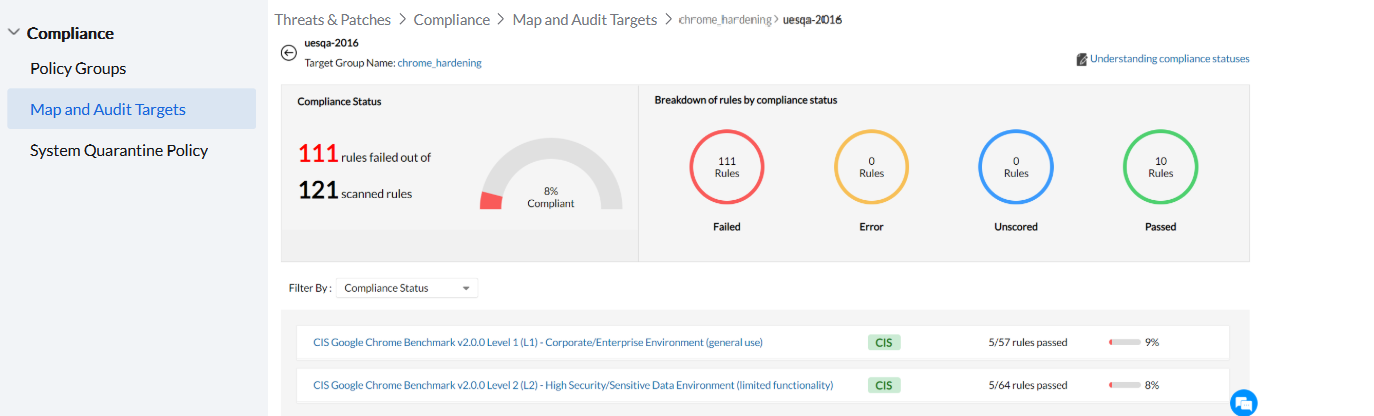
Compliance Status
This section indicates the number of rules the computer has failed to comply with out of the total scanned rules from all the mapped policies. The compliance percentage displayed here indicates the percentage of rules the computer has passed out of the total scanned rules (excluding unscored rules) from all the mapped policies.
Compliance percentage = Rules passed/(Total scanned rules - unscored rules) * 100
Breakdown of rules by compliance status
All the rules applicable to the computer are classified in this section based on the computer's compliance status.
- Failed - Rules that the computer configurations failed to comply with
- Error - Rules that failed to be processed while scanning.
- Unscored - While these rules are still counted towards the total rule count of a policy, their outcome will not be factored into the compliance percentage. According to CIS, the rules are either ‘scored’, or ‘not scored’. ‘Scored’ recommendations are mandatory to achieve CIS compliance, and if not met will lower the total benchmark compliance percentage. Recommendations which are ’not scored’ have no impact on the compliance percentage.
- Passed - Rules that the computer configurations successfully comply with
The table view
The table section below lists all the policies mapped to this computer along with the number of rules passed in each policy as well the compliance percentage of the computer per policy. The compliance percentage for each policy indicates the percentage of rules the computer has passed out of the total scanned rules from the policy. You can use the filter option to view the rules based on the computer's compliance status. For instance, if you select Failed in the compliance status filter, the failed rules from every policy will be displayed. Each rule suggests a recommended value for a security setting. Click on View resolution next to the failed rule to view the detailed steps to implement the recommended value.
You can also view the compliance status of a computer on a per-rule basis. To do so, click on a policy.
Individual Policy view
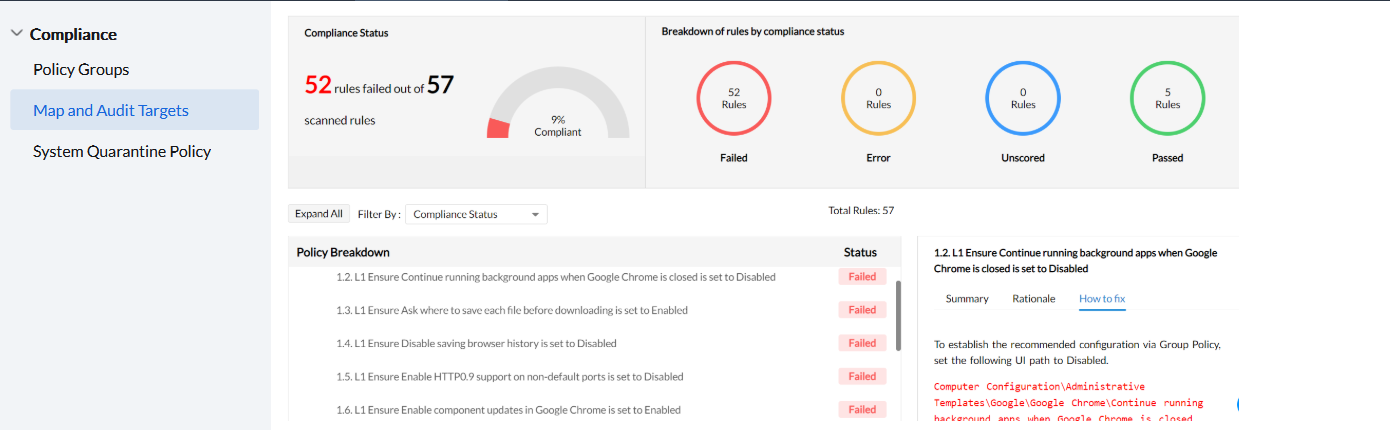
Compliance Status
This section indicates the number of rules the computer has failed to comply with out of the total scanned rules from this particular policy. The compliance percentage displayed here indicates the percentage of rules the computer has passed out of the total scanned rules from the policy.
Breakdown of rules by compliance status
All the rules from the policy are classified in this section based on the computer's compliance status.
- Failed - Rules that the computer configurations failed to comply with
- Error - Rules that failed to be processed while scanning.
- Unscored - While these rules are still counted towards the total rule count of a policy, their outcome will not be factored into the compliance percentage. According to CIS, the rules are either ‘scored’, or ‘not scored’. ‘Scored’ recommendations are mandatory to achieve CIS compliance, and if not met will lower the total benchmark compliance percentage. Recommendations which are ’not scored’ have no impact on the compliance percentage.
- Passed - Rules that the computer configurations successfully comply with
The Policy breakdown table view
Refer to this page if you wish to know more about how the policy is structured and detailed explanation for the terminologies used in the policy. For each title, you can view the number of rules the computer has passed. Click on the title to expand and reveal the rules pertaining to it. You can view the compliance status next to each rule. Each rule suggests a recommended value for a security setting. If you click on a rule, detailed summary, rationale and how to fix columns will be visible. The how to fix column offers the detailed steps to implement the recommended value in your computer for each failed rule.
You can also create customized CIS Compliance Reports. Navigate to Reports---> Executive Reports and Choose CIS Compliance Reports. Refer to this page to learn more about creating one.