APM Insight Alerts
Configure APM Insight alerts to get notified whenever the availability and health status of your monitor changes. Alarms can be configured at the application as well as instance level, whereas, threshold values can only be configured at the application level and cannot be configured separately for each instance. Configurations made at the application level are also applied to instances. Additionally, you can configure transaction-level alarms at the application level in APM Insight.
Classification of alerts
APM Insight alerts are classified based on availability (Up / Down) and health (Critical / Warning / Clear) status of the monitors. When your application exceeds specified threshold values, you will receive alerts based on the threshold configuration of the respective application.
Example:
Let's say your application has four instances.
- Your application will be marked as Down only if all four instances are down.
- Your application will be marked as Warning/Critical on comparing the configured threshold value with the aggregation of all of your application's instances.
- You will also receive an Up alert when the corresponding application/instance is up.
To configure alert notifications
- Log in to your Applications Manager account.
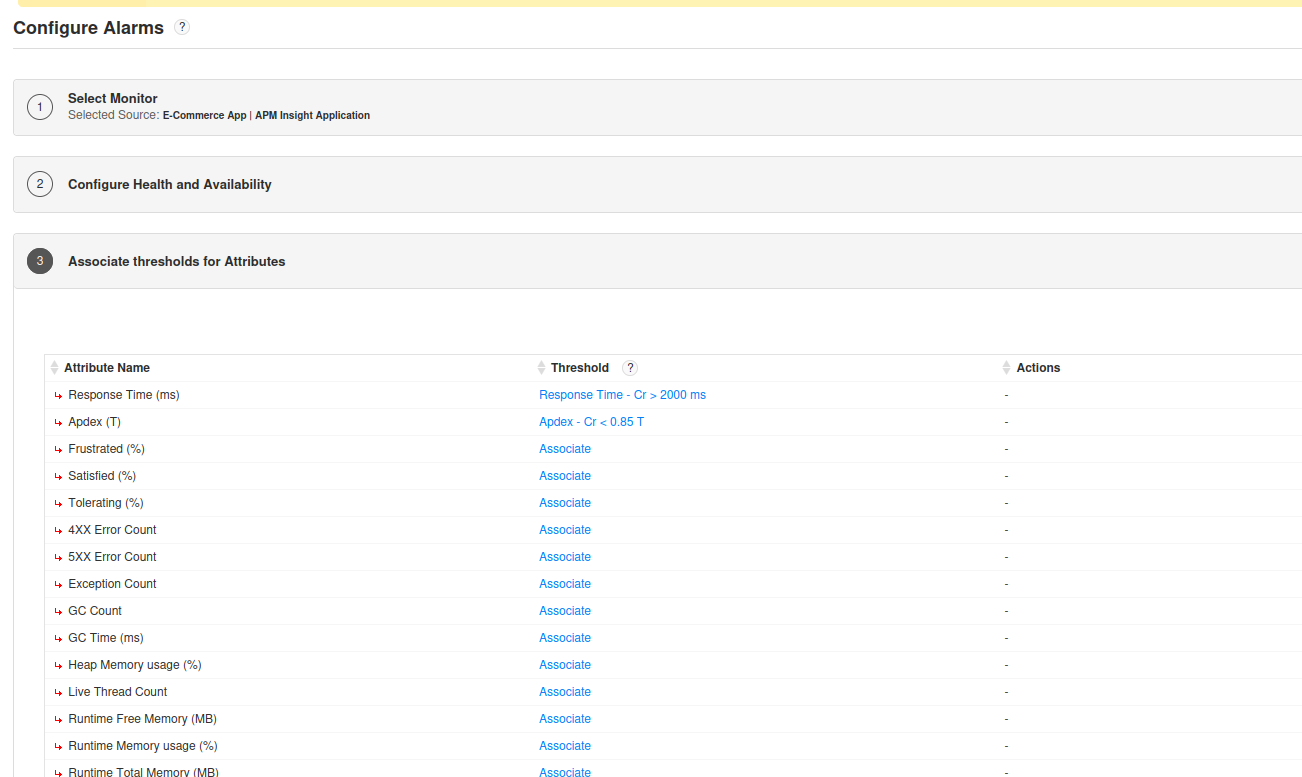
- Navigate to Configure Alarms tab and choose whether to configure alarms by Monitor/Monitor Type. Select the Monitor Type as APM Insight Application or APM Insight Instance and then choose the required monitor name from the dropdown.
- Once selected, proceed to associate the thresholds for the supported APM Insight metrics in the monitor.
For detailed information on configuring alarms for APM Insight monitors, refer here.
For detailed information on configuring thresholds for APM Insight monitors, refer here.
For detailed information on associate and actions to attributes for APM Insight monitors, refer here.
List of metrics supported
Following are the list of metrics supported for alert configuration in APM Insight:
- Response Time (ms)
- Apdex (T)
- Frustrated (%)
- Satisfied (%)
- Tolerating (%)
- 4XX Error Count
- 5XX Error Count
- Exception Count
- GC Count
- GC Time (ms)
- Heap Memory usage (%)
- Live Thread Count
- Runtime Free Memory (MB)
- Runtime Memory usage (%)
- Runtime Total Memory (MB)
- Error Count
- Errors
- Fatal Count
- JM CPU Usage (%)
- JIT Time (ms) (ms)
- Req. Count
- Req. Throughput (rpm)
- Warning Count