Insights
The Insights feature in CloudSpend provides a unified view of your most important cloud recommendations across cost, security, and availability.
Recommendations are actionable suggestions to improve your cloud environment. For example:
- Cost recommendations highlight ways to reduce unnecessary spend, such as removing idle resources or rightsizing instances.
- Security recommendations point out risks like open access or excessive permissions.
- Availability recommendations identify issues that could affect reliability, such as missing redundancy or scaling gaps.
Insights evaluates each recommendation based on its overall impact and ranks them accordingly. The ranking considers factors like potential cost savings, severity of risk, number of affected resources, and whether the issue is recurring or increasing over time.
This structured approach helps you quickly understand which issues need immediate attention and which can be addressed later. It gives cloud teams a clear starting point, so they can focus on the most important actions first without spending time manually sorting or prioritizing recommendations.
What problem does Insights solve?
Cloud environments generate a continuous stream of misconfigurations, security risks, and cost inefficiencies across dozens of services and accounts. Without a structured view, teams typically either work through issues in the order they were discovered or focus narrowly on whichever category they manage, leaving high-priority issues unaddressed.
Insights addresses this by:
- Combining cost, security, and availability findings into one ranked list, so no category is reviewed in isolation.
- Applying a multi-factor scoring model so that the most impactful findings appear first, regardless of category.
- Displaying severity labels (High, Moderate, Low, or Info) next to each finding, enabling teams to triage at a glance.
- Providing an investigation flow that shows which accounts, regions, and resources are affected by each finding, without leaving the product.
- Refreshing findings regularly so the list reflects the current state of your environment.
Benefits of Insights
Insights provides you with the following benefits:
- Better prioritization: Recommendations are ranked using multiple factors, so the most impactful ones appear first. This removes guesswork and helps teams act with clarity.
- Faster issue resolution: Since high priority items are surfaced immediately, teams can start fixing the most critical issues without delay.
- Improved cost optimization: Insights highlights recommendations with higher savings potential, helping you reduce cloud spend more effectively.
- Stronger security posture: Security risks are ranked based on severity and spread. This ensures critical vulnerabilities are addressed early.
- Early detection of risks: Insights considers trends such as increasing resource count or recurring issues. This helps you catch problems before they grow.
- Efficient resource allocation: Teams can focus their time and effort on recommendations that deliver the highest impact.
How Insights works
Each recommendation is evaluated using a scoring model. This model assigns a score based on multiple factors, and the final list is sorted in descending order of importance.
Scoring factors used
Savings cost
This measures how much cost can be reduced if the recommendation is implemented.
- Example: Removing idle instances or rightsizing resources usually has high savings, so these are ranked higher.
Security or compliance severity
Recommendations related to critical vulnerabilities or compliance violations are given higher priority.
- Example: An open security group exposing sensitive ports will rank higher than a low-risk configuration issue.
Historical recurrence
If the same issue repeatedly appears over time, it indicates an underlying problem. Such recurring issues are ranked higher because they need long term fixes.
Resource count trend
This checks whether the number of affected resources is increasing.
- Example: If more instances are becoming misconfigured over time, the issue is escalating and needs attention.
Resource count
This measures how many resources are affected. Issues impacting many resources are considered more critical.
Age of the finding
Older unresolved issues are given higher importance, especially if they are still active. This helps prevent long term risks or cost accumulation.
All these factors are combined into a single score that determines the position of each recommendation in the Insights list.
Use cases
Identifying the highest-risk security issues across AWS accounts
A security engineer logs in and navigates to Insights > Overview. They click Security to filter the Summary to security findings only. The list is already sorted by score, so the highest-priority issue—Security Groups - Unrestricted access on specific ports, affecting 1,188 security groups across AmazonVPC—appears first. The engineer clicks Investigate to see which regions and accounts are affected and begins remediation.
Focusing on high-severity availability issues
A site reliability engineer needs to review availability risks. They click Availability in the Summary, then filter the search results to select only High under Severity to narrow the list. They identify Amazon VPN Tunnels - UP as the only availability finding at High severity, click Investigate, and review the affected gateways and regions.
Reviewing a specific cloud service's findings
A platform engineer wants to check findings related to Amazon RDS only. They filter the search, scroll to the service group, and search for AmazonRDS. After applying the filter, the Summary shows only RDS-related findings. They identify Amazon RDS - Event subscription for OS updates as a Moderate availability issue affecting 87 regions and click Investigate to view the affected accounts and regions in detail.
Viewing Insights data
To view Insights data, log in to Cloudspend and go to the Insights tab. The Insights page provides a consolidated and prioritized view of recommendations across your cloud environment. It is divided into multiple sections to help you quickly understand trends, identify critical issues, and take action. Obtain the following details from the Insights section.
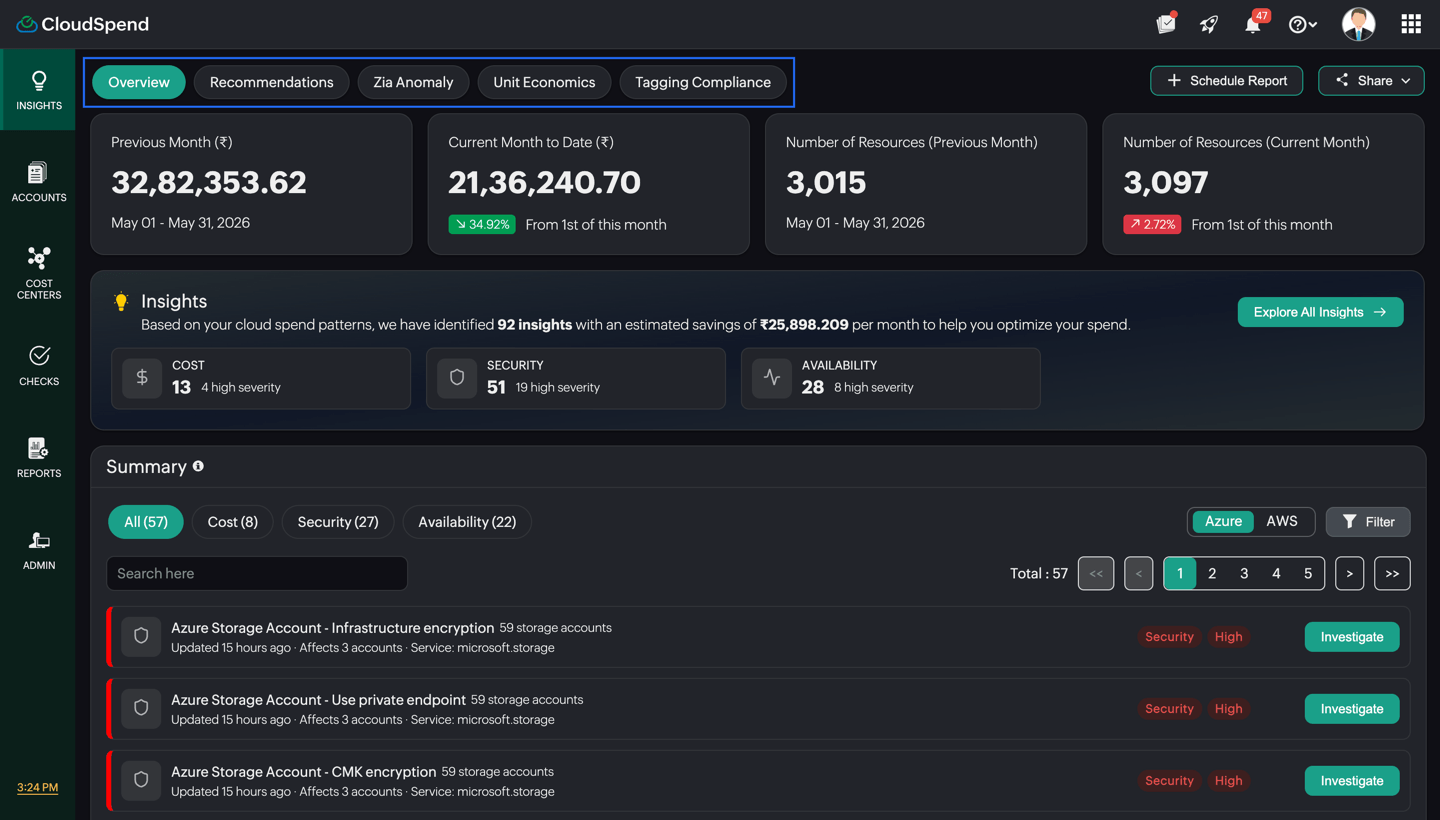
At the top of the Insights page, you can switch between different views using the available tabs. Each tab takes you to a specific Insights-related page for deeper analysis.
- Overview: This is the default tab that opens when you access the Insights section. It provides a consolidated view of key metrics, insights summary, and prioritized recommendations.
- Recommendations: Displays all identified recommendations in detail, allowing you to explore and act on them beyond the summarized Insights view.
- Zia Anomaly: Shows anomalies detected in your cloud spend using AI-driven analysis. This helps you identify unusual spikes or unexpected cost patterns.
- Unit Economics: Provides a dashboard to analyze cloud costs, understand spending patterns, and examine cost distribution across your cloud environment. Use the available visualizations to explore cost and usage data, identify key cost drivers, and find areas that require further investigation. If the Overview tab is unavailable, this dashboard opens by default. For more information, see Unit Economics dashboard.
- Tagging Compliance: Helps you track how well your resources are tagged and identify gaps in tagging practices.
These tabs allow you to move between high level insights and more focused analysis without leaving the Insights module.
These tabs allow you to move between high level insights and more focused analysis without leaving the Insights module.
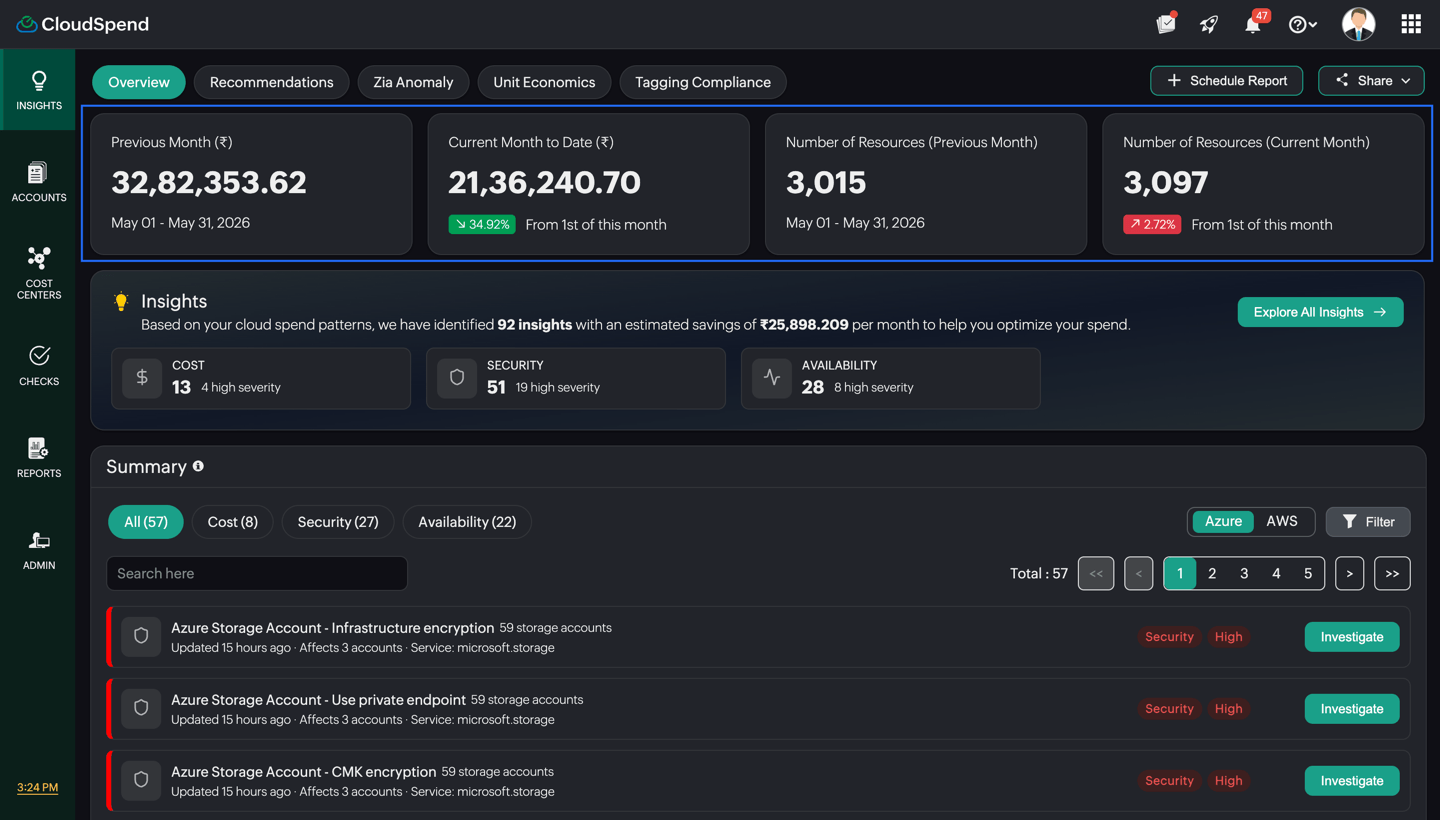
Top overview cards
- Previous Month ($): Shows the total cloud cost for the last completed billing month. This helps you understand your baseline spend. The date range (below previous month cost) indicates the exact billing period covered for the previous month.
- Current Month to Date ($): Displays the total cost incurred so far in the current month. The percentage change shows how current spend compares to the previous period. A higher percentage indicates increased spending.
- Number of Resources (Previous Month): Shows the total number of cloud resources used in the previous month.
- Number of Resources (Current Month): Displays the total number of resources currently in use for the ongoing month. The percentage change shows how your infrastructure size is growing or shrinking.
Insights section
The Insights section provides a quick, consolidated snapshot of all the recommendations identified in your cloud environment. It summarizes the total number of insights detected based on your usage patterns and highlights the estimated monthly savings that can be achieved by acting on cost related recommendations. Alongside this, it breaks down the insights into three categories—Cost, Security, and Availability—and shows how many items fall under each, including those marked as high severity. This helps you quickly understand where most issues are concentrated and whether your focus should be on reducing spend, fixing security risks, or improving reliability.
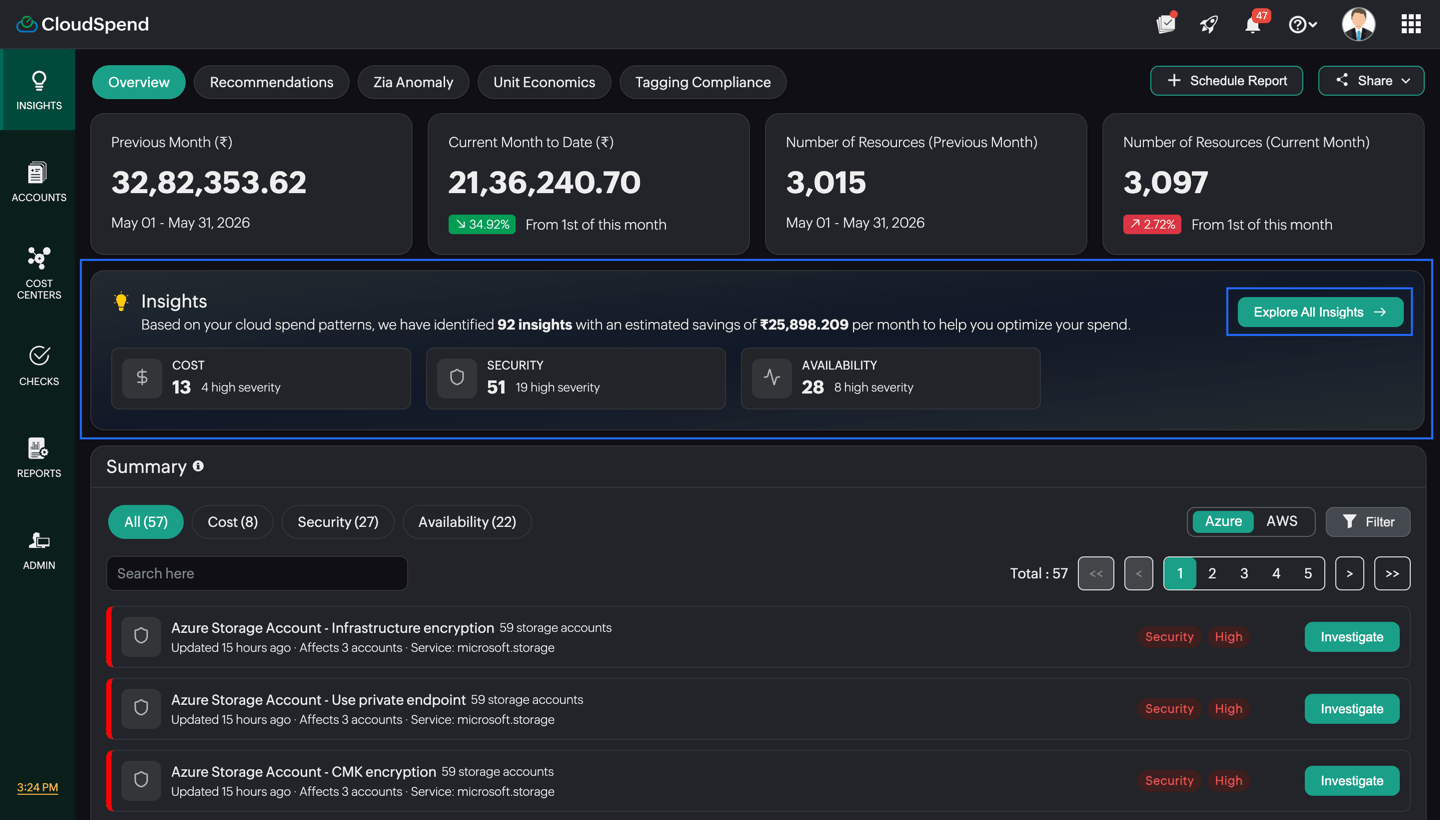
Click Explore All Insights to view the complete list of insights and analyze them in detail.
Summary section
The Summary section displays the complete list of insights identified in your cloud environment. These insights are presented as recommendations and are arranged in order of priority, helping you focus on the most impactful issues first.
You can view all recommendations using the All tab, or filter them by category using the Cost, Security, and Availability tabs. Selecting a category updates the list to show only the relevant recommendations. This allows you to focus on specific objectives, such as reducing cloud spend, addressing security risks, or improving service reliability.
You can further refine the list using the cloud provider filter to view insights specific to AWS, Azure, or GCP. The search option helps you quickly locate a particular recommendation using keywords.
All recommendations in this section are automatically sorted based on the Insights scoring model. This means the most critical and high impact items appear at the top of the list. The ranking takes into account factors such as potential cost savings, severity of risk, number of affected resources, recurrence of the issue, and growth in impact over time. Each recommendation is also tagged with a category and severity level, making it easier to identify high priority issues at a glance.You can also share these insight details with others by exporting them as a PDF, CSV or sending them via email, and schedule them as reports for regular tracking and review.
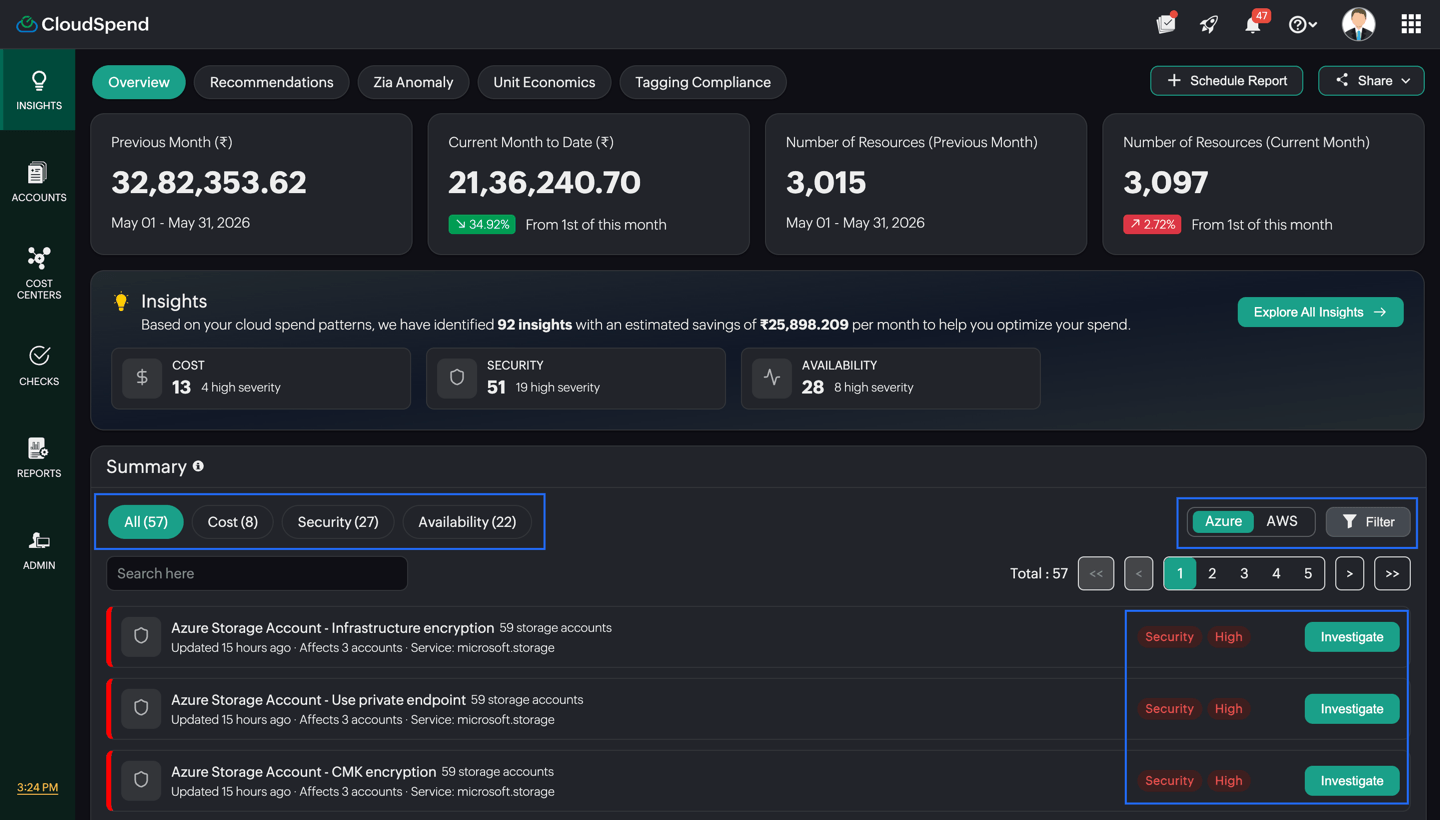
To explore a recommendation in detail, click Investigate. This opens a detailed view where you can review affected resources, understand the issue, and take the necessary action.
Viewing insight details
When you click Investigate on any recommendation, you are taken to a detailed view of that specific insight. This page provides complete context about the issue, including its impact, affected resources, and the actions required to resolve it. The page is divided into three sections as given below.
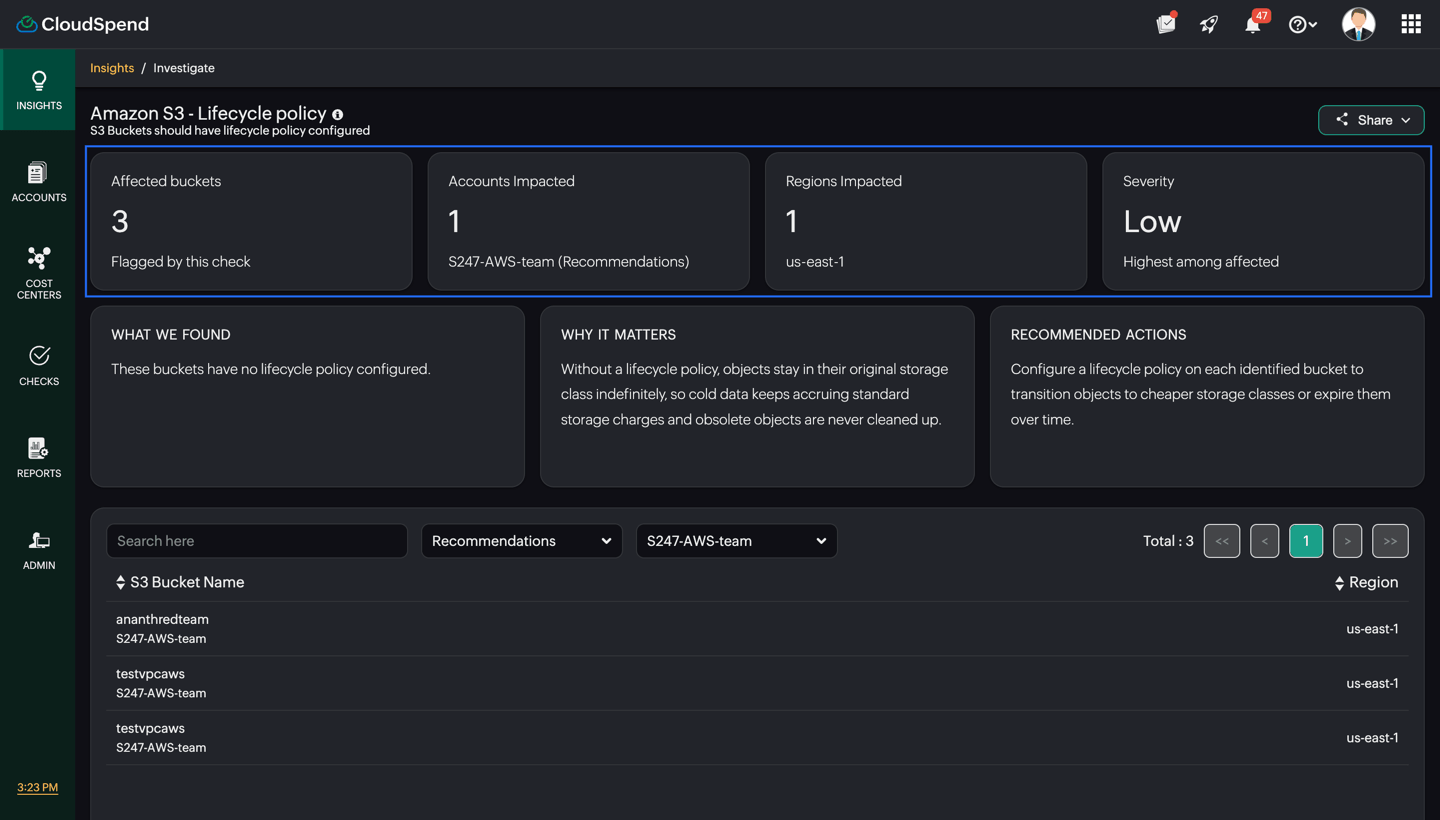
The top cards provide a quick summary of the impact and scope of the identified issue.
- Affected resources: Shows the total number of resources impacted by this insight. Example: Number of S3 buckets without a life cycle policy.
- Accounts impacted: Displays the number of cloud accounts where the issue exists. You can also see the account name for reference.
- Regions impacted: Indicates the number of regions affected. You may also see a few region names along with an option to view more.
- Severity: Shows the highest severity level for this insight across all affected resources. This helps you understand how critical the issue is.
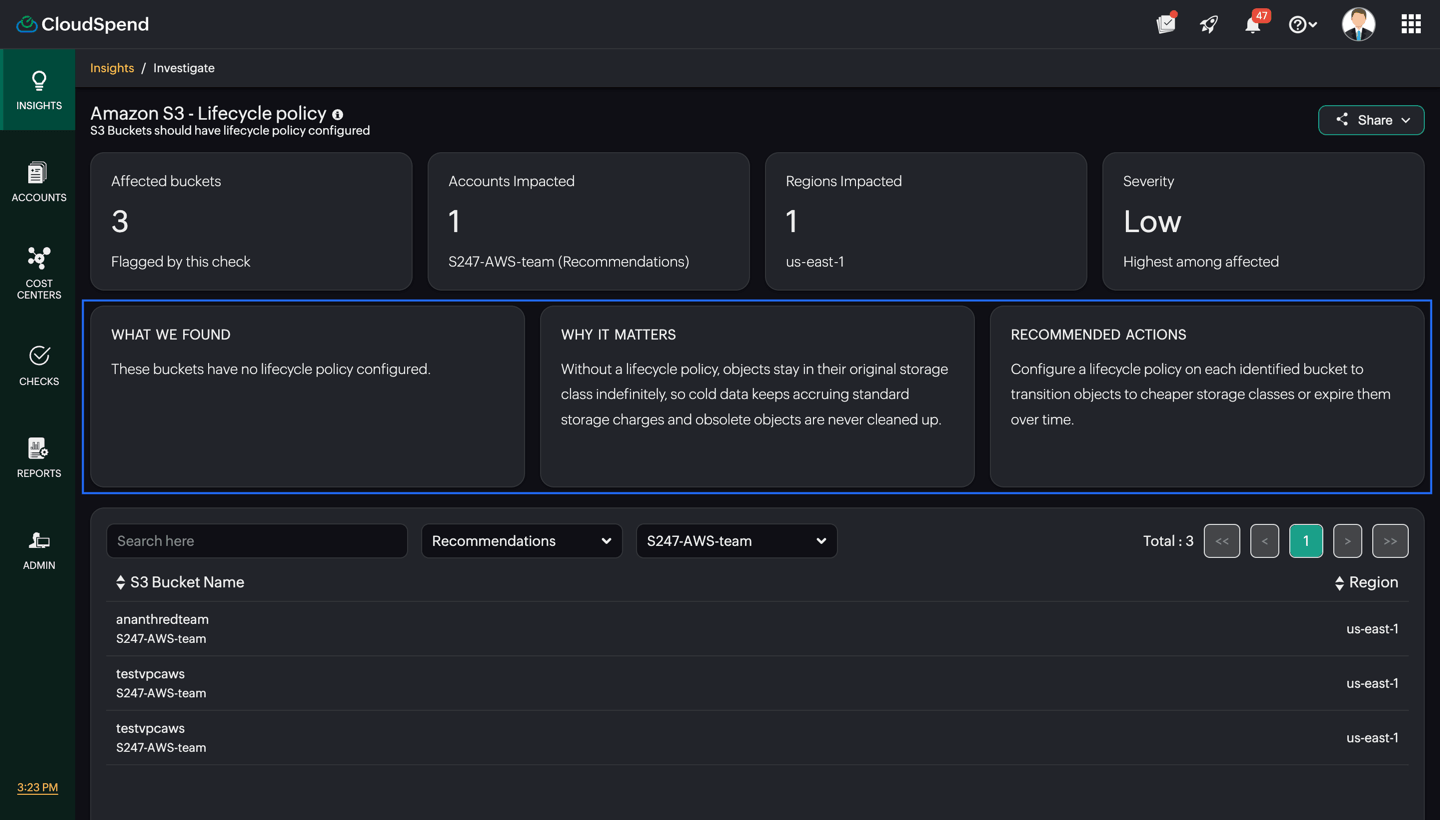
The middle cards explain the issue in detail and guide you on what to do next.
- What we found: Describes the exact issue identified. Example: Buckets without a life cycle policy configured.
- Why it matters: Explains the impact of the issue in practical terms. This could include cost implications, security risks, or operational concerns.
- Recommended actions: Provides clear guidance on how to fix the issue.These are actionable steps you can follow in your cloud provider.
The bottom section lists all the individual resources affected by the insight.
- Search bar: Allows you to find a specific resource quickly.
- Filters (integration or account): Lets you narrow down results based on integration or account.
- Resource name column: Displays the name of each affected resource. Example: S3 bucket name.
- Account details: Shows which account the resource belongs to.
- Region column: Indicates the region where the resource is located.
- Total count: Displays the total number of affected resources listed.
This page gives you a complete view of the identified issue, starting from a high-level summary down to individual affected resources. It helps you understand the scope and impact of the problem, why it needs attention, and what actions are required to resolve it. By combining context, impact, and actionable guidance in one place, it allows you to quickly move from identifying an issue to fixing it without switching between multiple views. You can also share these insight details with others by exporting them as a PDF, CSV, or sending them via email.
Unit Economics dashboard
The Unit Economics dashboard in CloudSpend Insights helps you understand cloud spending across business dimensions and resource usage types. It provides cost summaries, forecasts, and changes in spending to help you identify major cost contributors, investigate increases, and find opportunities to optimize cloud expenditure.
If the Insights Overview tab is unavailable in your account, the Unit Economics dashboard is displayed as the default landing page.
The dashboard provides two views: Business Units and Resource Units. Use these toggles to switch between business-level cost analysis and resource-usage based cost analysis.
Business Units
Select Business Units to view cloud spending grouped by business and cost dimensions. This view helps you understand how expenditure is distributed across accounts, services, regions, cost categories, and other business dimensions.
The dashboard displays report cards for the available dimensions, including the following:
Cost Category
Displays spending grouped by cost category. Use this view to identify the categories contributing most to your cloud expenditure and compare their spending forecasts and changes.
Linked Account
Displays spending across linked cloud accounts. Use this view to identify accounts with high expenditure or significant changes in spending and determine which accounts require further investigation.
Region
Displays spending grouped by cloud region. Use this view to compare regional expenditure and identify regions that contribute significantly to your overall cloud costs.
Service
Displays spending grouped by cloud service. Use this view to identify the services contributing most to your expenditure and prioritize services for further cost analysis.
Cost Center
Displays spending grouped by cost center. Use this view to understand how cloud costs are distributed across your organization's cost centers and identify areas with higher expenditure.
Product Family
Displays spending grouped by product family. Use this view to understand the cost contribution of different product families and investigate changes in their spending.
The report cards available to you depend on your configured reports and the data available in your account.
Each report card provides the following information:
- Spend (top 5): Shows the combined spending of the top five entries in the report.
- Forecast (top 5): Shows the forecasted spending for the top five entries. The percentage change indicates how the forecast differs from the comparison value displayed in the report.
- Display Name: Identifies each entry in the report, such as an account, region, service, or cost category.
- Spend ($): Shows the spending associated with each entry.
- Forecast ($): Shows the forecasted spending associated with each entry.
- Change: Shows the percentage change in the forecasted spending, helping you identify entries with significant increases or decreases.
Use these values to compare spending across business dimensions, identify the largest cost contributors, and determine where additional investigation may be needed.
Click View Details on a report card to open the corresponding report and examine its data in greater detail.
Resource Units
Select Resource Units to view cloud spending grouped by resource usage units and usage types. Unlike the Business Units view, which focuses on business and cost dimensions, this view helps you understand the spending associated with different types of resource consumption at the Region, UsageType, Service, and Unit levels.
The dashboard displays available reports, such as Cost Center Unit Economics reports, Cost Category reports, Cost Accounts reports, and Product Family reports. The reports displayed depend on your configuration and available data.
Each report card provides the following information:
- Unit: Shows the measurement unit associated with the resource usage, such as Metrics, GB, Hours, or Requests.
- Usage Type: Identifies the type of cloud usage associated with the entry, such as a metrics usage type or data transfer usage type.
- Spend ($): Shows the cost associated with the usage type.
- Forecast ($): Shows the forecasted cost for the usage type.
- Change: Shows the percentage change in the forecasted cost, helping you identify usage types with significant cost increases or decreases.
The report card displays the total spending and forecast for the top five entries, along with the percentage change in the forecast. Click any row to open the detailed Unit Economics view for that entry and analyze its cost, usage, and trends.
Use this view to identify which usage types contribute most to cloud expenditure. For example, you can examine metrics, data transfer, requests, or compute hours to identify usage categories that warrant closer analysis.
Click View Details on a report card to investigate the corresponding Unit Economics report in greater detail.
Filtering and finding reports
Both Business Units and Resource Units provide options to filter and find reports.
- Report filter: Use the dropdown to filter the reports displayed on the dashboard.
- Search by report name: Enter a report name to find a specific report without browsing through all available report cards.
- Pagination: Use the page navigation controls to browse additional report cards when the available reports span multiple pages.
These options help you find relevant reports quickly, especially when your cloud environment contains many accounts, cost dimensions, or usage types.
Viewing report details
Click View Details on a report card to open the corresponding report. The detailed view helps you move from a dashboard summary to a more focused analysis of the selected cost dimension or resource usage.
Depending on the report, you can examine the cost per unit, usage, spending trends, and contributing resources.
The detailed view can help you understand whether an increase in cloud expenditure is associated with increased usage, a higher cost per unit, or particular resources contributing to the total cost.
Use this information to investigate cost changes and identify potential optimization opportunities.
Scheduling and sharing reports
The Unit Economics dashboard also provides options to schedule and share reports.
- Schedule Report: Use this option to schedule reports so that the relevant cost information can be delivered at defined intervals.
- Share: Use this option to share report information with stakeholders through the available sharing options.
Scheduling reports helps teams review cloud spending regularly without manually accessing the dashboard each time. Sharing reports helps finance, engineering, and cloud operations teams review cost information and coordinate optimization efforts.
Benefits of the Unit Economics dashboard
The Unit Economics dashboard helps you:
- Understand business level spending: Use Business Units to compare costs across cost centers, accounts, services, regions, and other business dimensions.
- Identify resource usage cost drivers: Use Resource Units to understand which usage types and units contribute most to cloud expenditure.
- Anticipate spending changes: Review forecasts and percentage changes to identify areas where costs may increase.
- Investigate cost increases: Open detailed reports to understand the cost and usage patterns behind significant changes.
- Improve cost visibility: Compare spending across different dimensions instead of relying only on an overall cloud cost figure.
- Support cost optimization decisions: Use business level and resource usage analysis to identify areas that may benefit from further investigation or optimization.
By switching between Business Units and Resource Units , you can analyze cloud expenditure from both business and usage perspectives. This helps you understand where your money is being spent, which usage types contribute to the cost, and where to focus your cost optimization efforts.