Sensors
Overview
Sensors in DEX Manager Plus allow IT administrators to define and collect custom device metrics that go beyond standard performance indicators. These script-based data collectors enable organizations to capture real-time, environment-specific data—such as registry values, hardware compatibility, event information, and application-specific details (antivirus status, and so on)—to enhance visibility and drive automated decision-making.
Sensors are highly flexible and can be used to power workflows, generate reports, and surface meaningful insights tailored to your unique endpoint environment.
Why Use Sensors?
| Benefit | Description |
|---|---|
| Custom Intelligence | Monitor any system state that matters to your organization and gain visibility |
| Data-Driven Automation | Use sensor outputs as dynamic triggers in workflows. |
| Flexible Reporting | Track and export custom data via dashboards and reports. |
| Scalable Management | Deploy sensors across device groups with centralized control. |
Accessing the Sensors Module
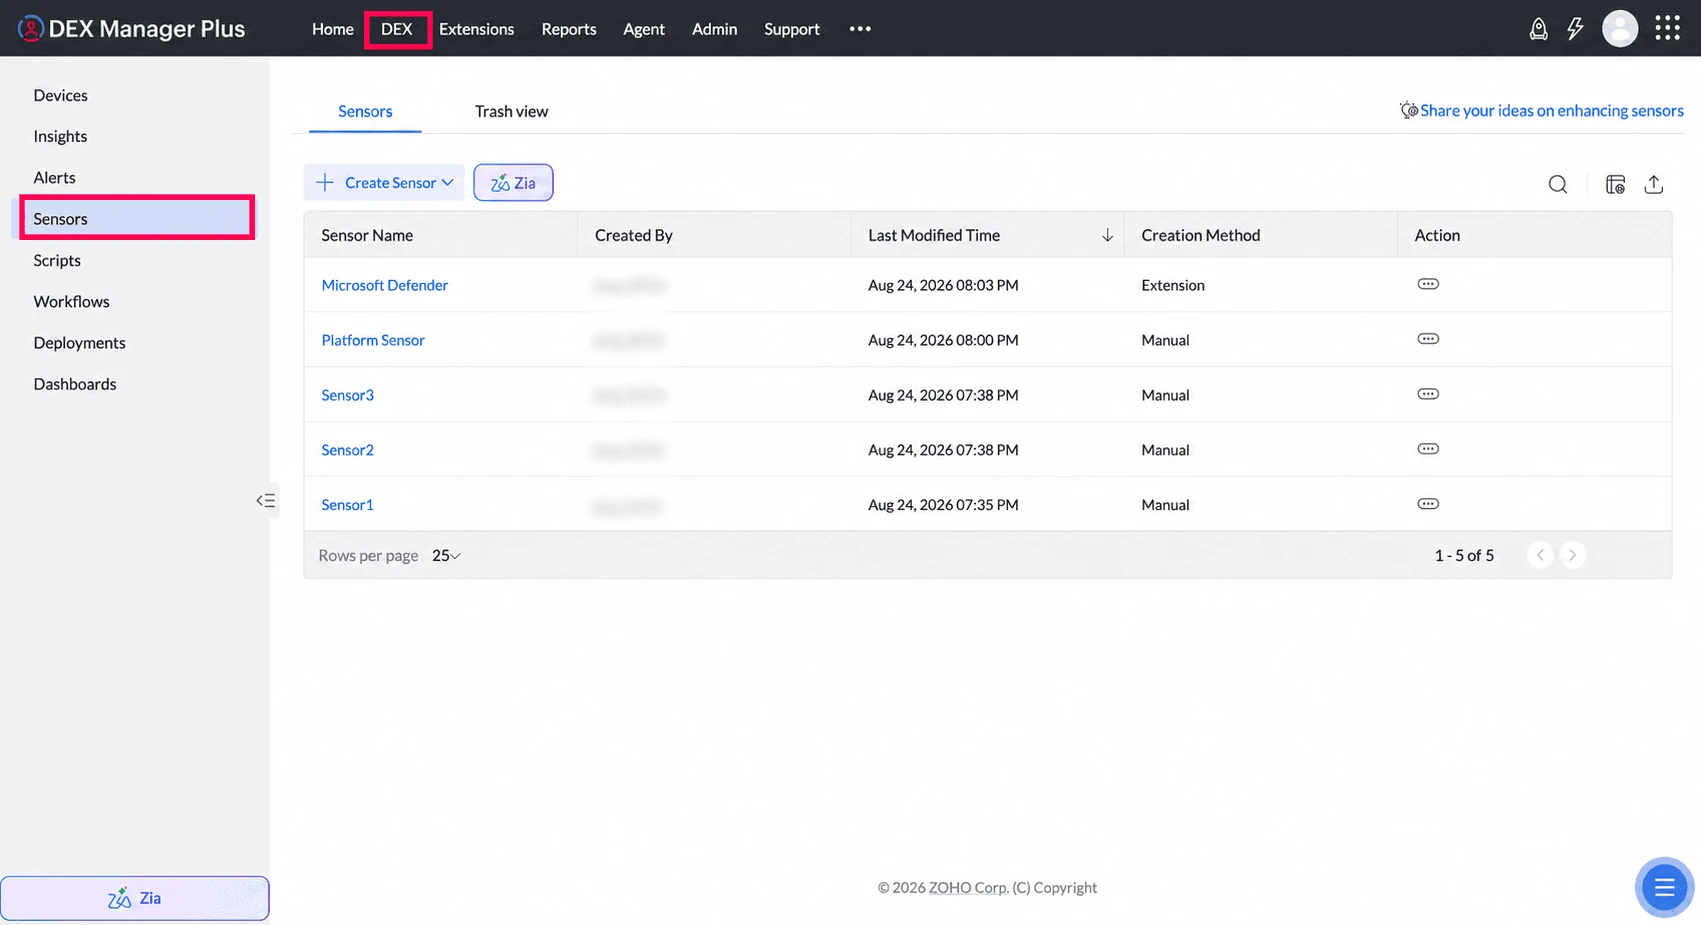
Navigate to Sensors from the left-hand pane of the DEX tab. The main view lists all created sensors with their names, types, and usage status. Use the Create Sensor button to create new ones.
Generating Sensors Using Ask Zia
DEX Manager Plus integrates Ask Zia directly within the Sensors module so administrators can describe monitoring requirements in natural language and generate sensor content faster.
Ask Zia helps reduce manual scripting effort by preparing the sensor fields and initial script structure directly inside the Add Sensor flow.
Steps to Generate a Sensor Using Ask Zia
Navigate to DEX > Sensors.
Click the Ask Zia button available next to Create Sensor or within the Create Sensor view.
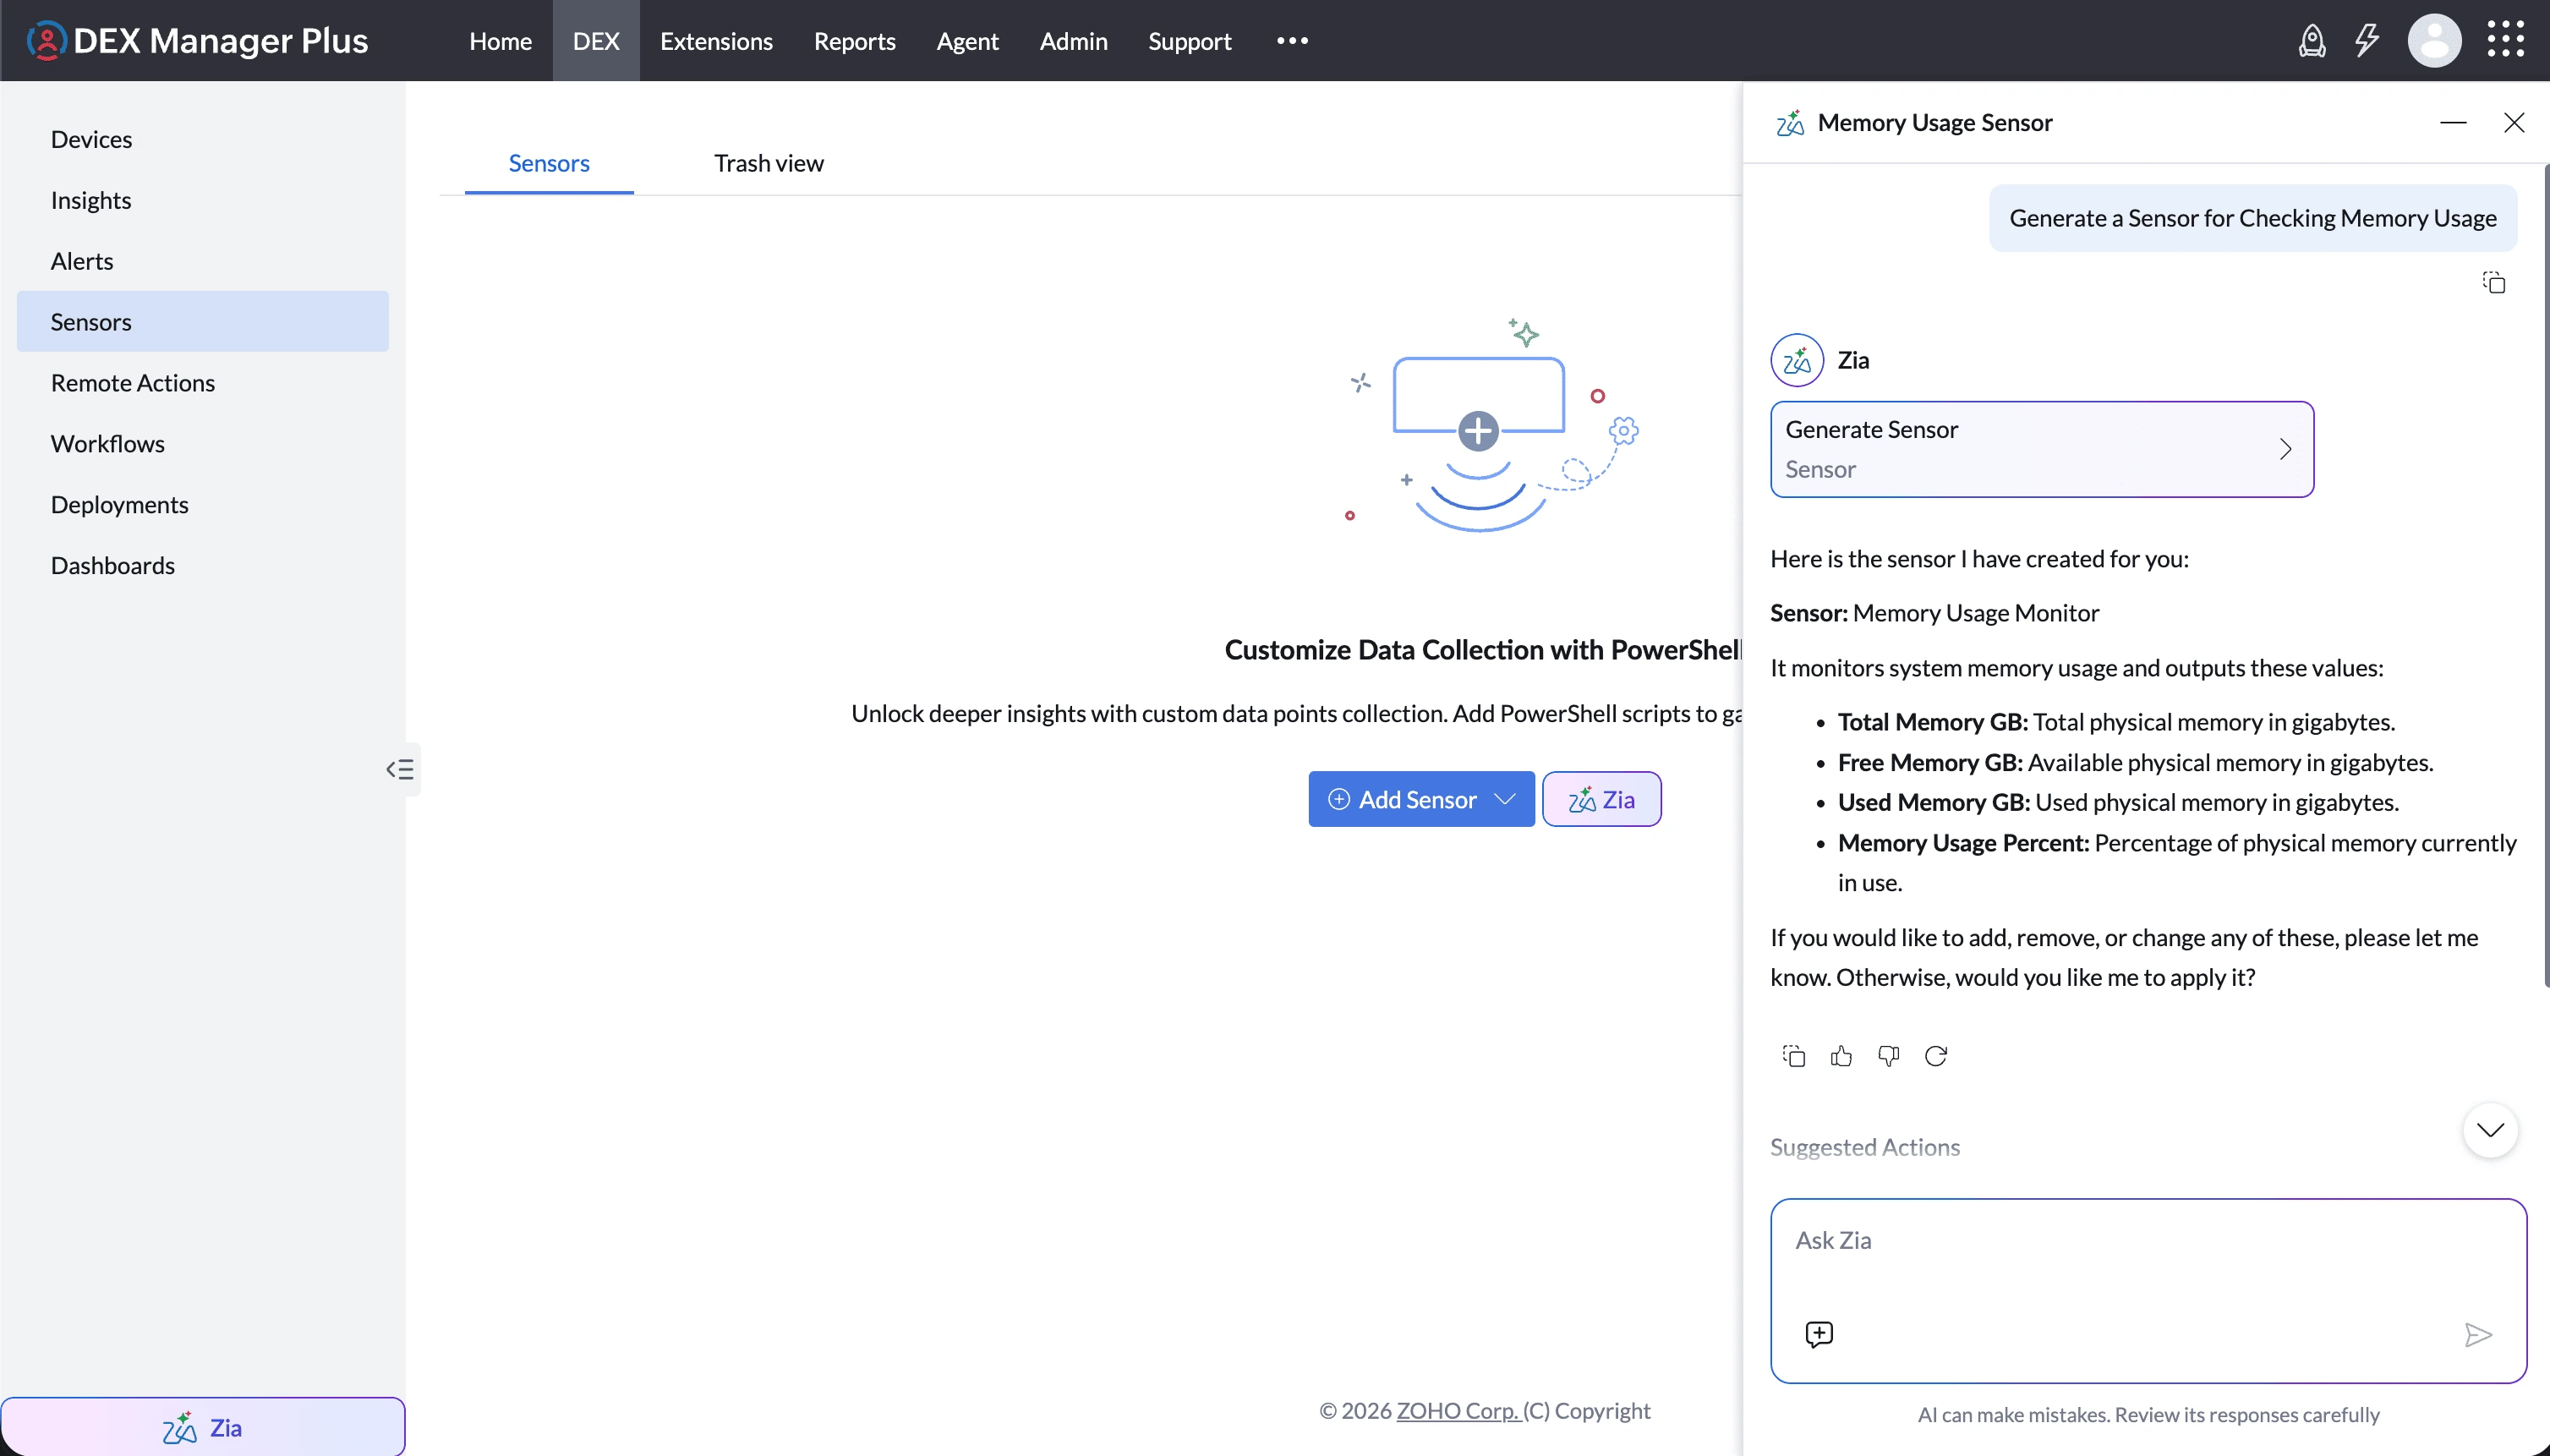
Enter your requirement in natural language or choose one of the suggested prompts.
Ask Zia generates the sensor content directly in the Create Sensor flow.
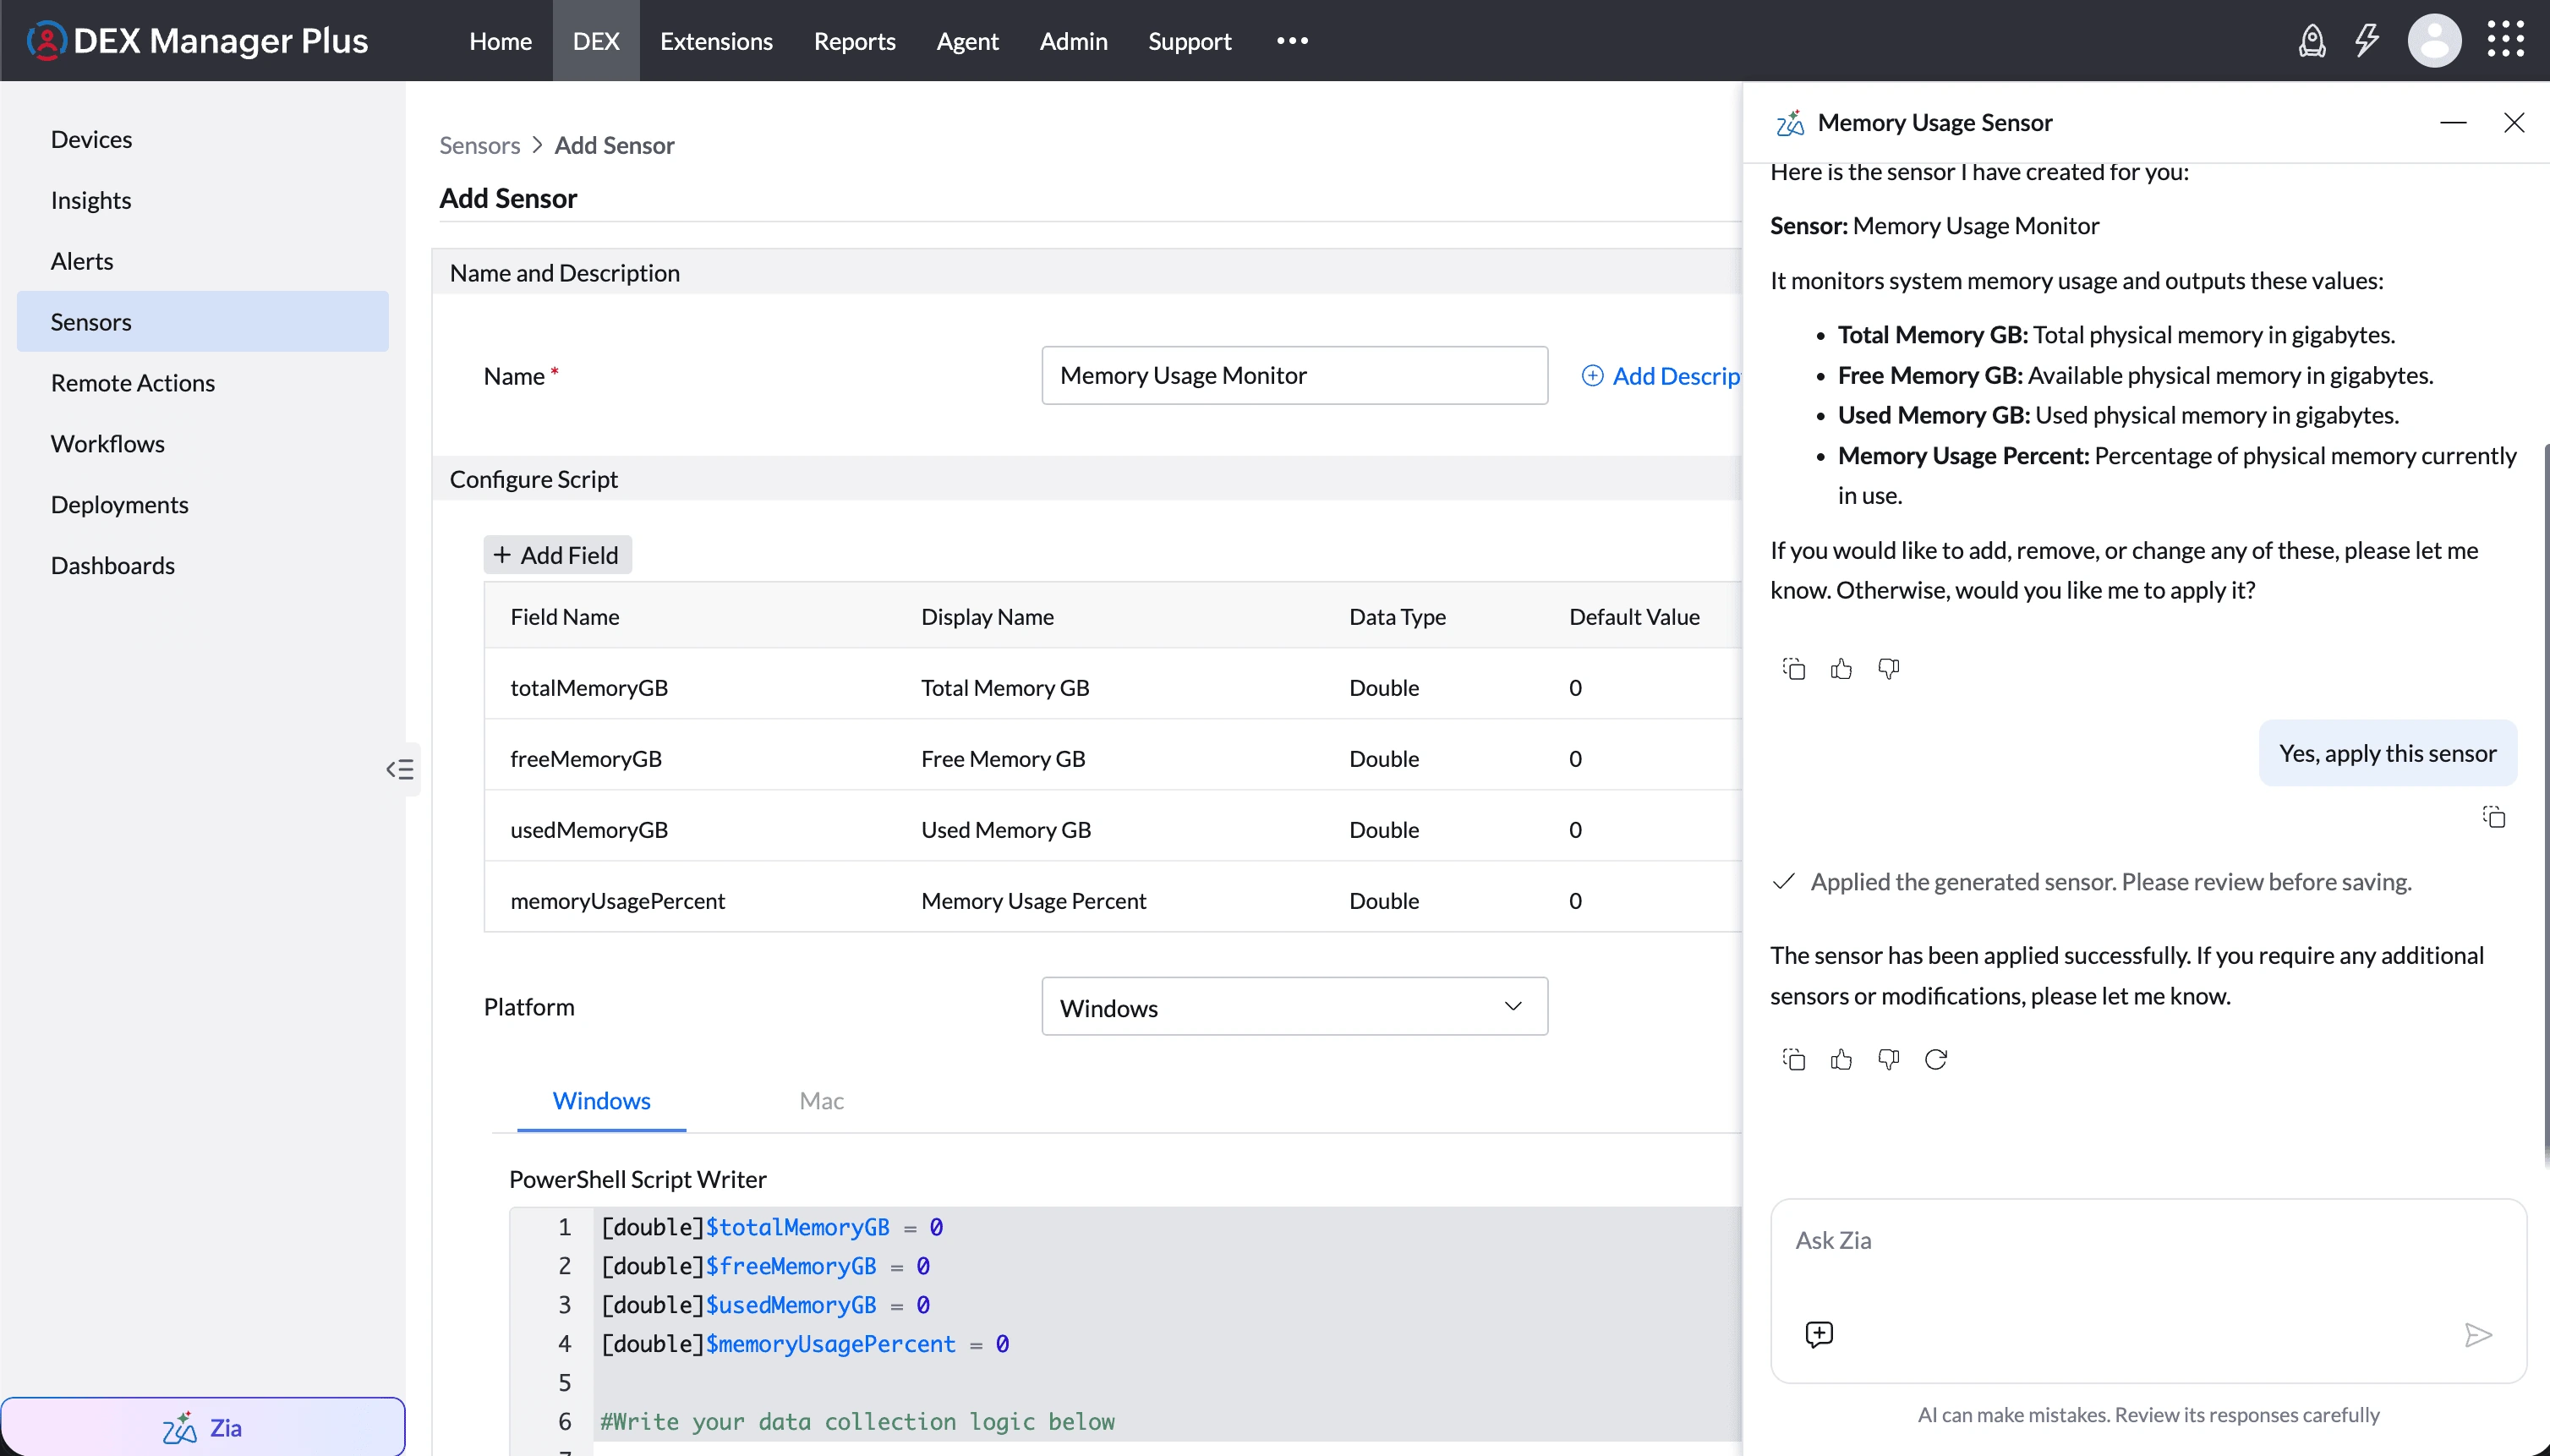
Review the generated fields and script, make any required changes, and save the sensor.
Sample Prompts
Generate a sensor for monitoring disk space.Generate a sensor to verify whether Google Chrome is installed.Generate a sensor for monitoring memory usage.Generate a sensor to read a registry value.Generate a sensor to check if a service is running.Ask Zia must be enabled before use. To enable Zia, navigate to Admin > Zia Configuration. For more details, refer to the Ask Zia configuration guide.
Creating a Sensor
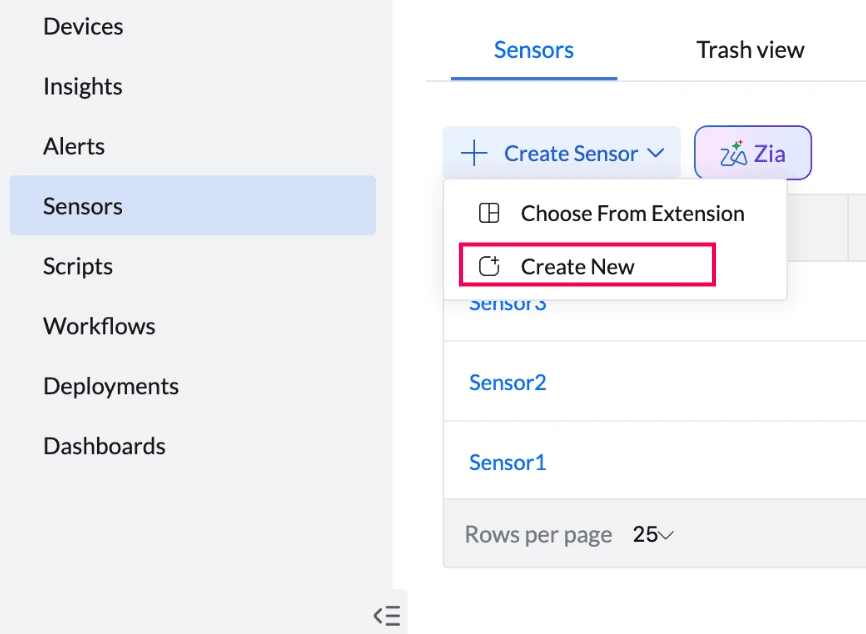
Click on the Create Sensor button and choose Create New from the dropdown.
Step 1: Define Sensor Details
- Sensor Name: Enter a unique, descriptive name.
- Description (optional): Summarize the sensor’s purpose or logic.

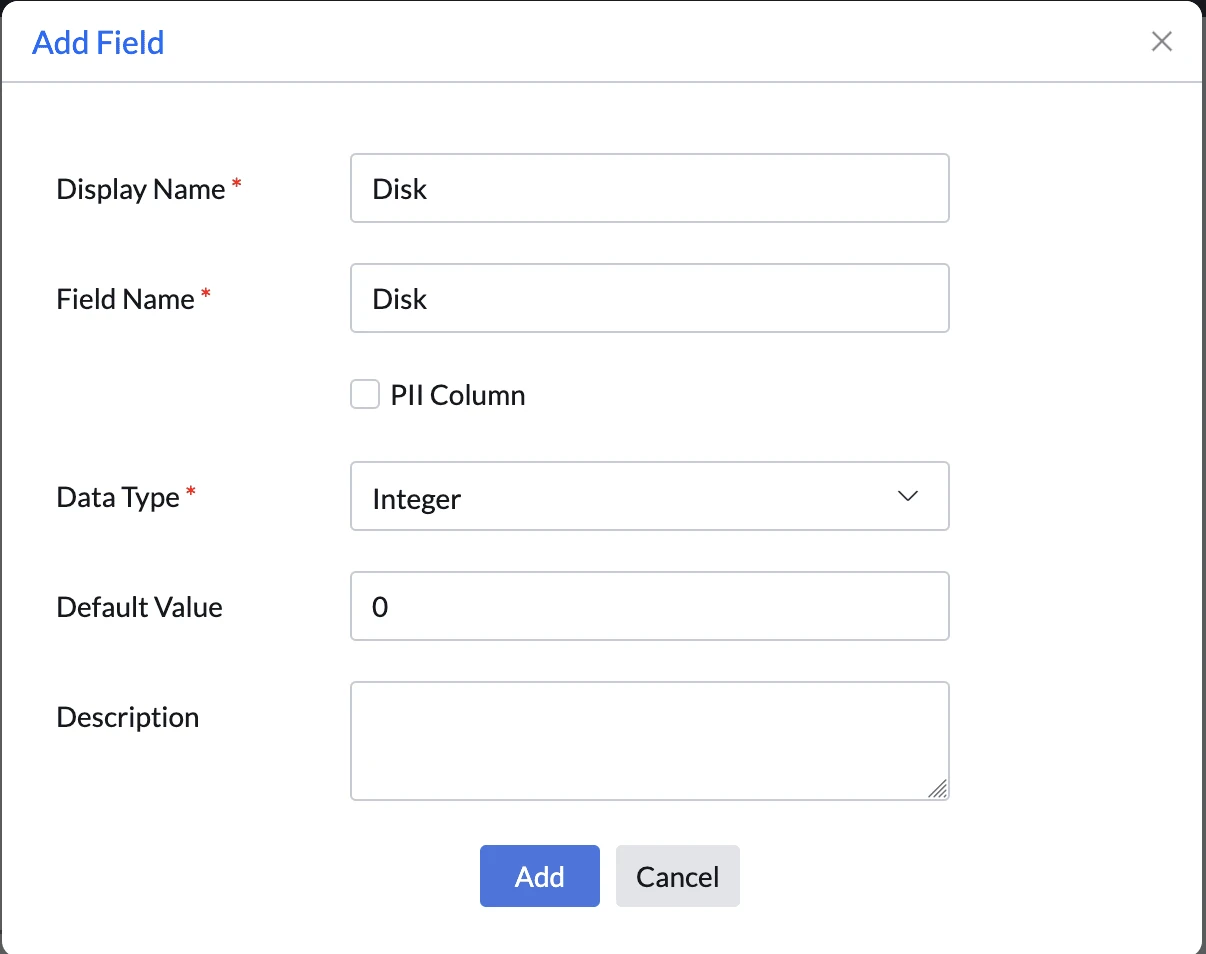
Step 2: Declare Fields
Use Add Field to define input/output variables. These fields act as data carriers between the sensor and the script. You can define field type (string, number, and so on) and optionally flag fields as PII for compliance.
Step 3: Write the Script
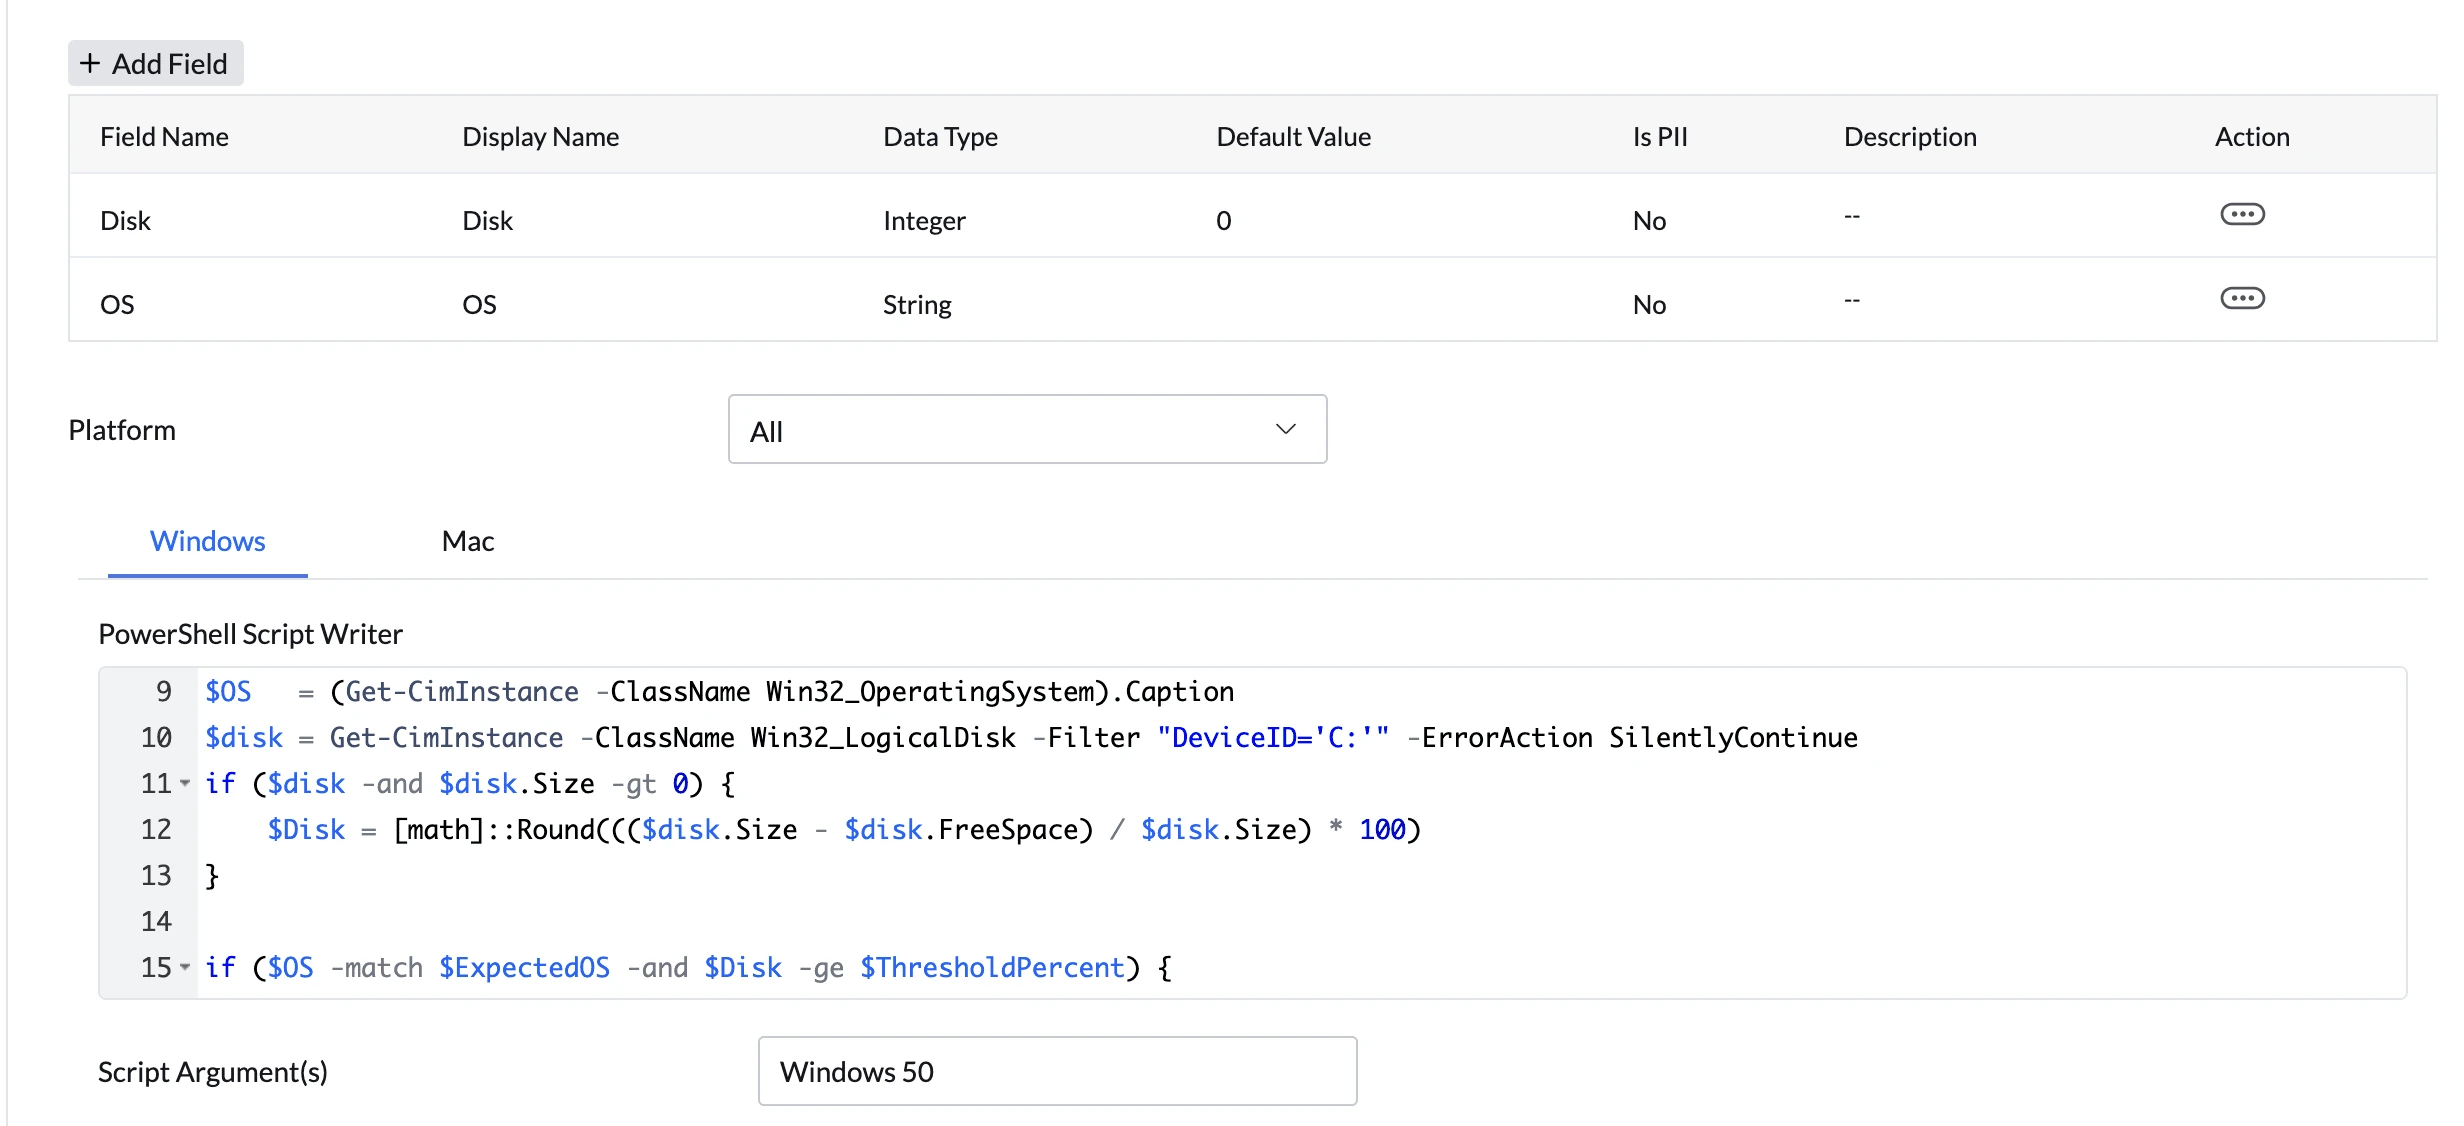
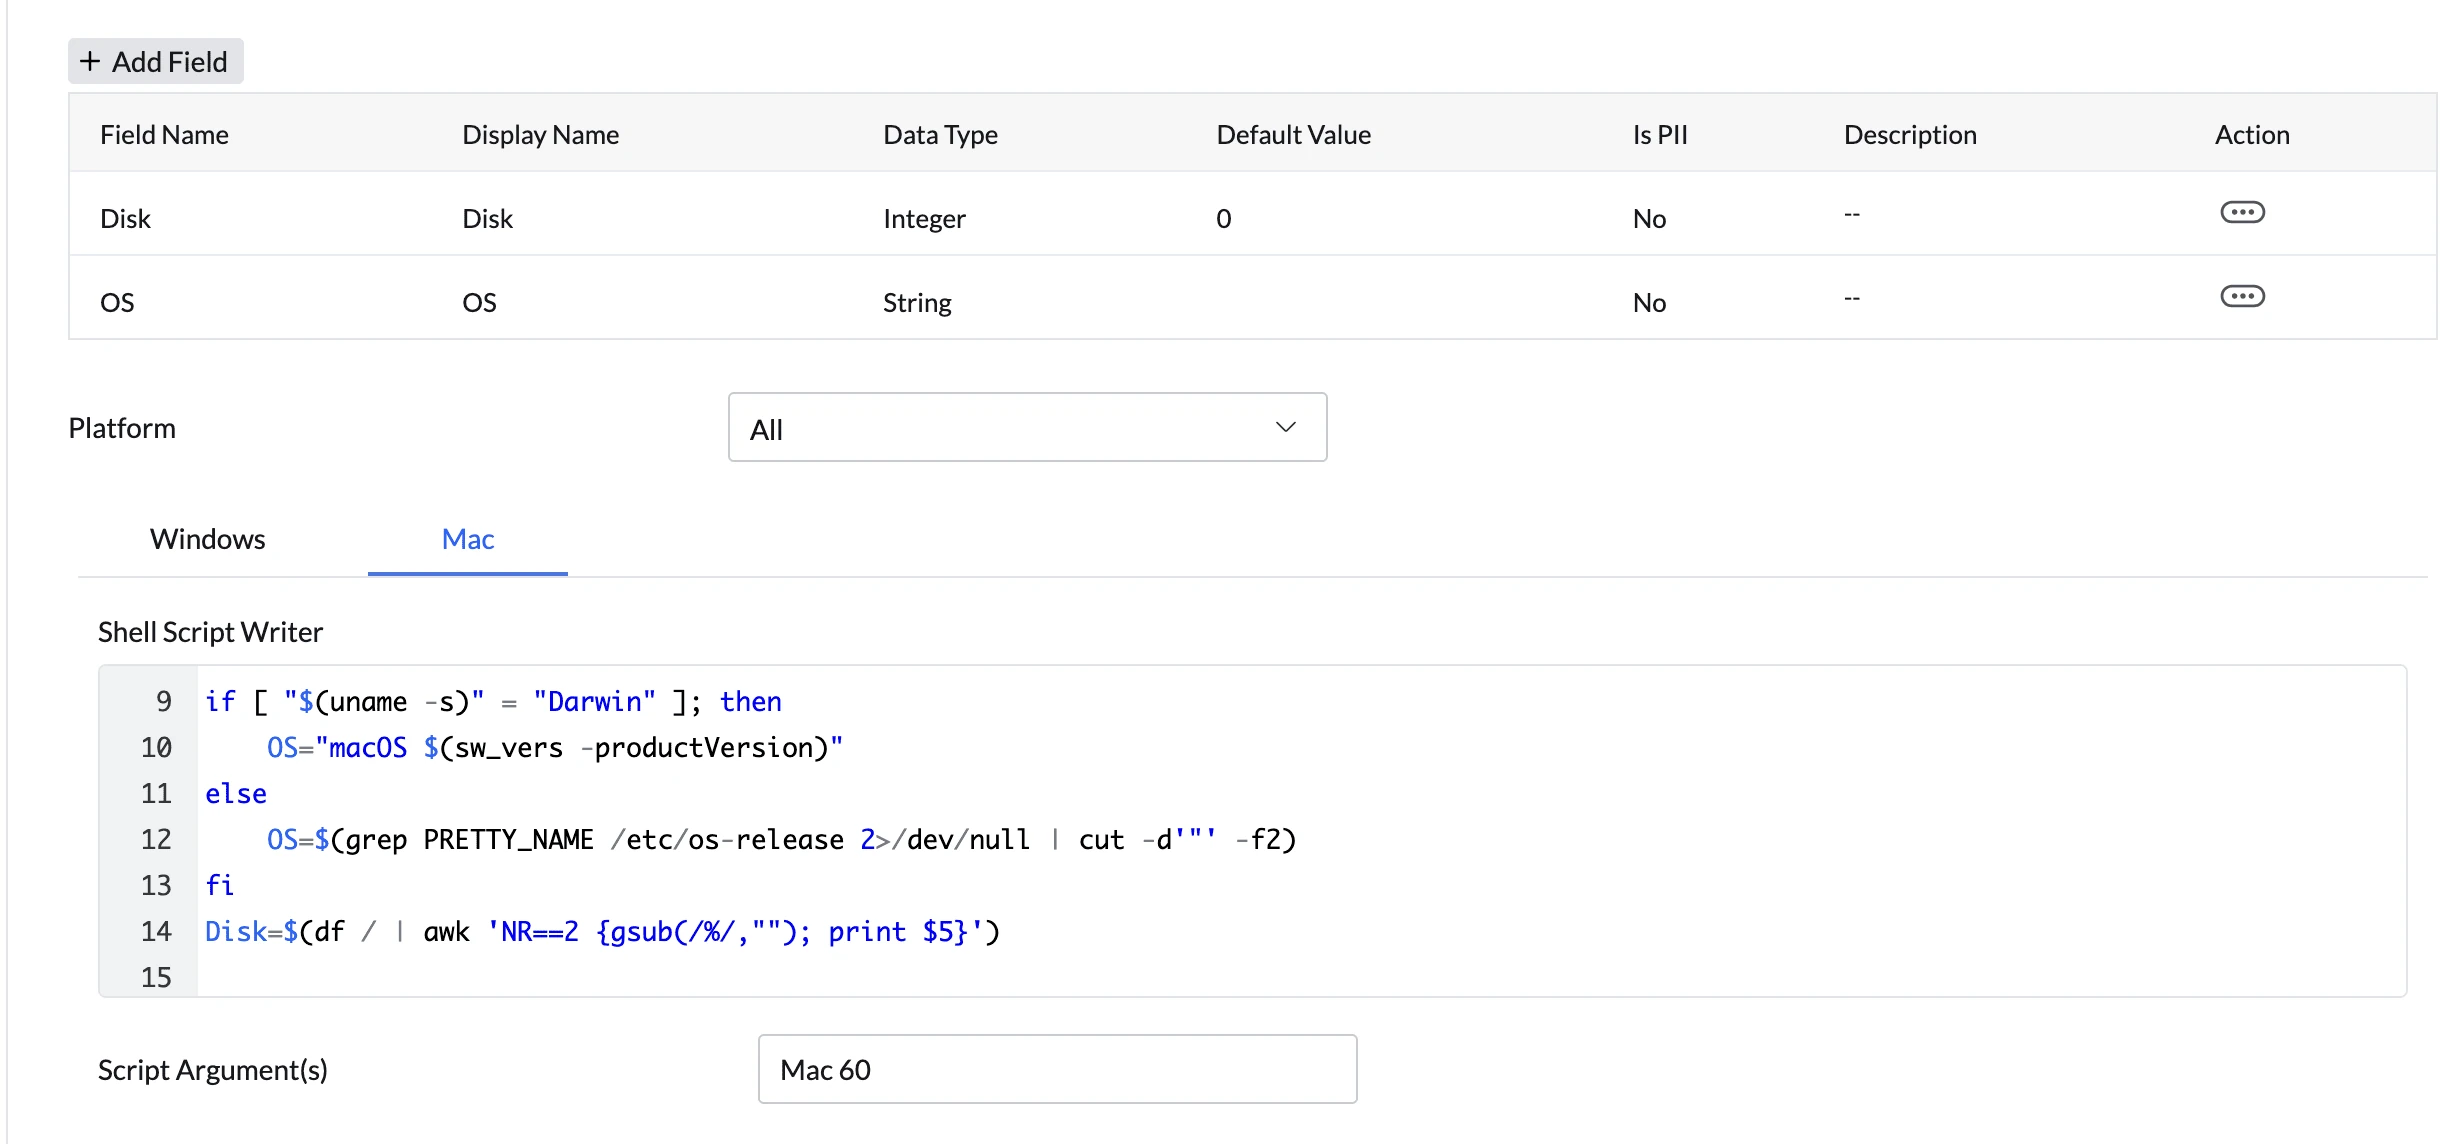
Use the built-in Script Writer to compose your PowerShell or Shell script. When a sensor targets both Windows and Mac devices, the Script Writer lets you configure each platform separately. Fields defined above are available as variables. The script must output structured values that match the declared fields.
Windows
Mac
Optional Script Arguments
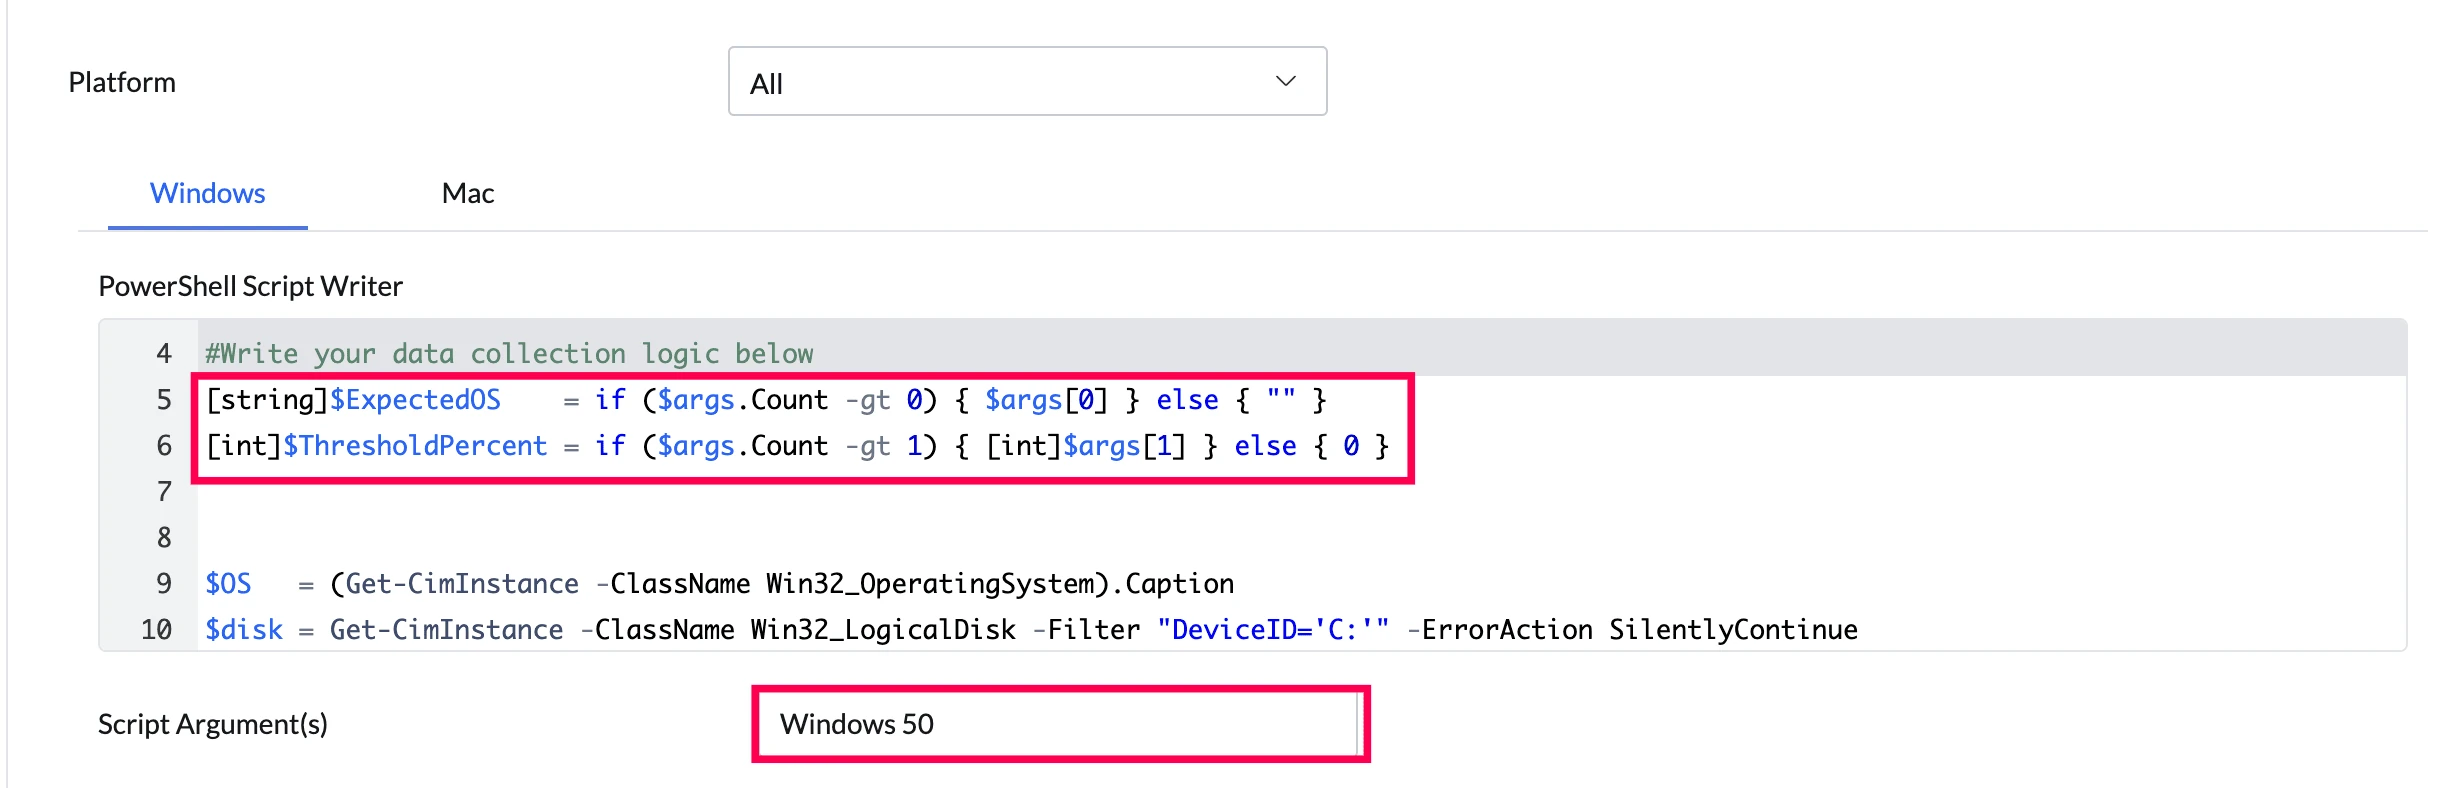
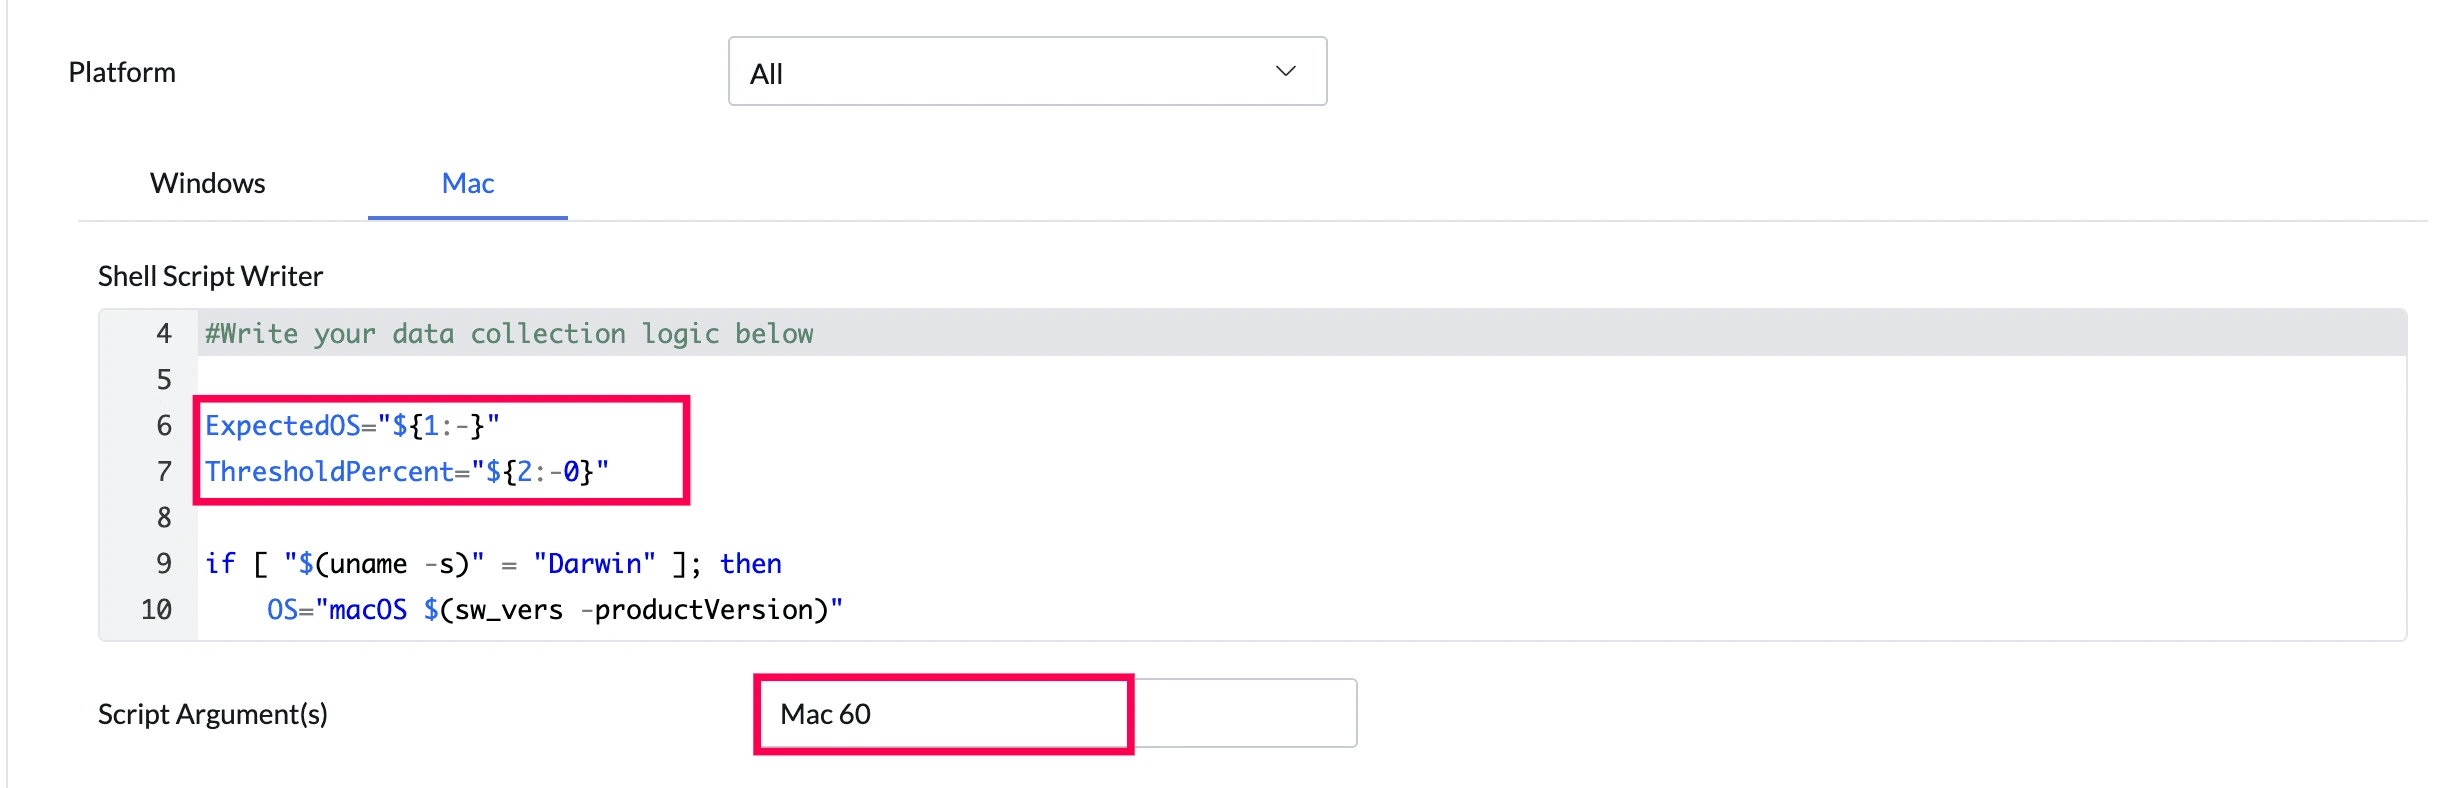
Custom sensors support an optional Script Argument field that lets you pass runtime values to your script without modifying it. Arguments are provided as a space-separated string (for example: Wednesday 06:00 Custom true), and can be accessed within the script by position or by name, depending on how the script is written. When a sensor targets both Windows and Mac, each platform can have its own Script Argument value to accommodate platform-specific argument handling.
Windows
Mac
Step 4: Set Run History Retention
Define how many execution records should be stored per deployment execution. Minimum: 1, Maximum: 5. This helps track trends over time and enables post-event analysis.
Step 5: Save
Click Save to add the sensor to your repository. The sensor is now available to deploy for data collection on targeted endpoints.
Adding Sensor from Extensions
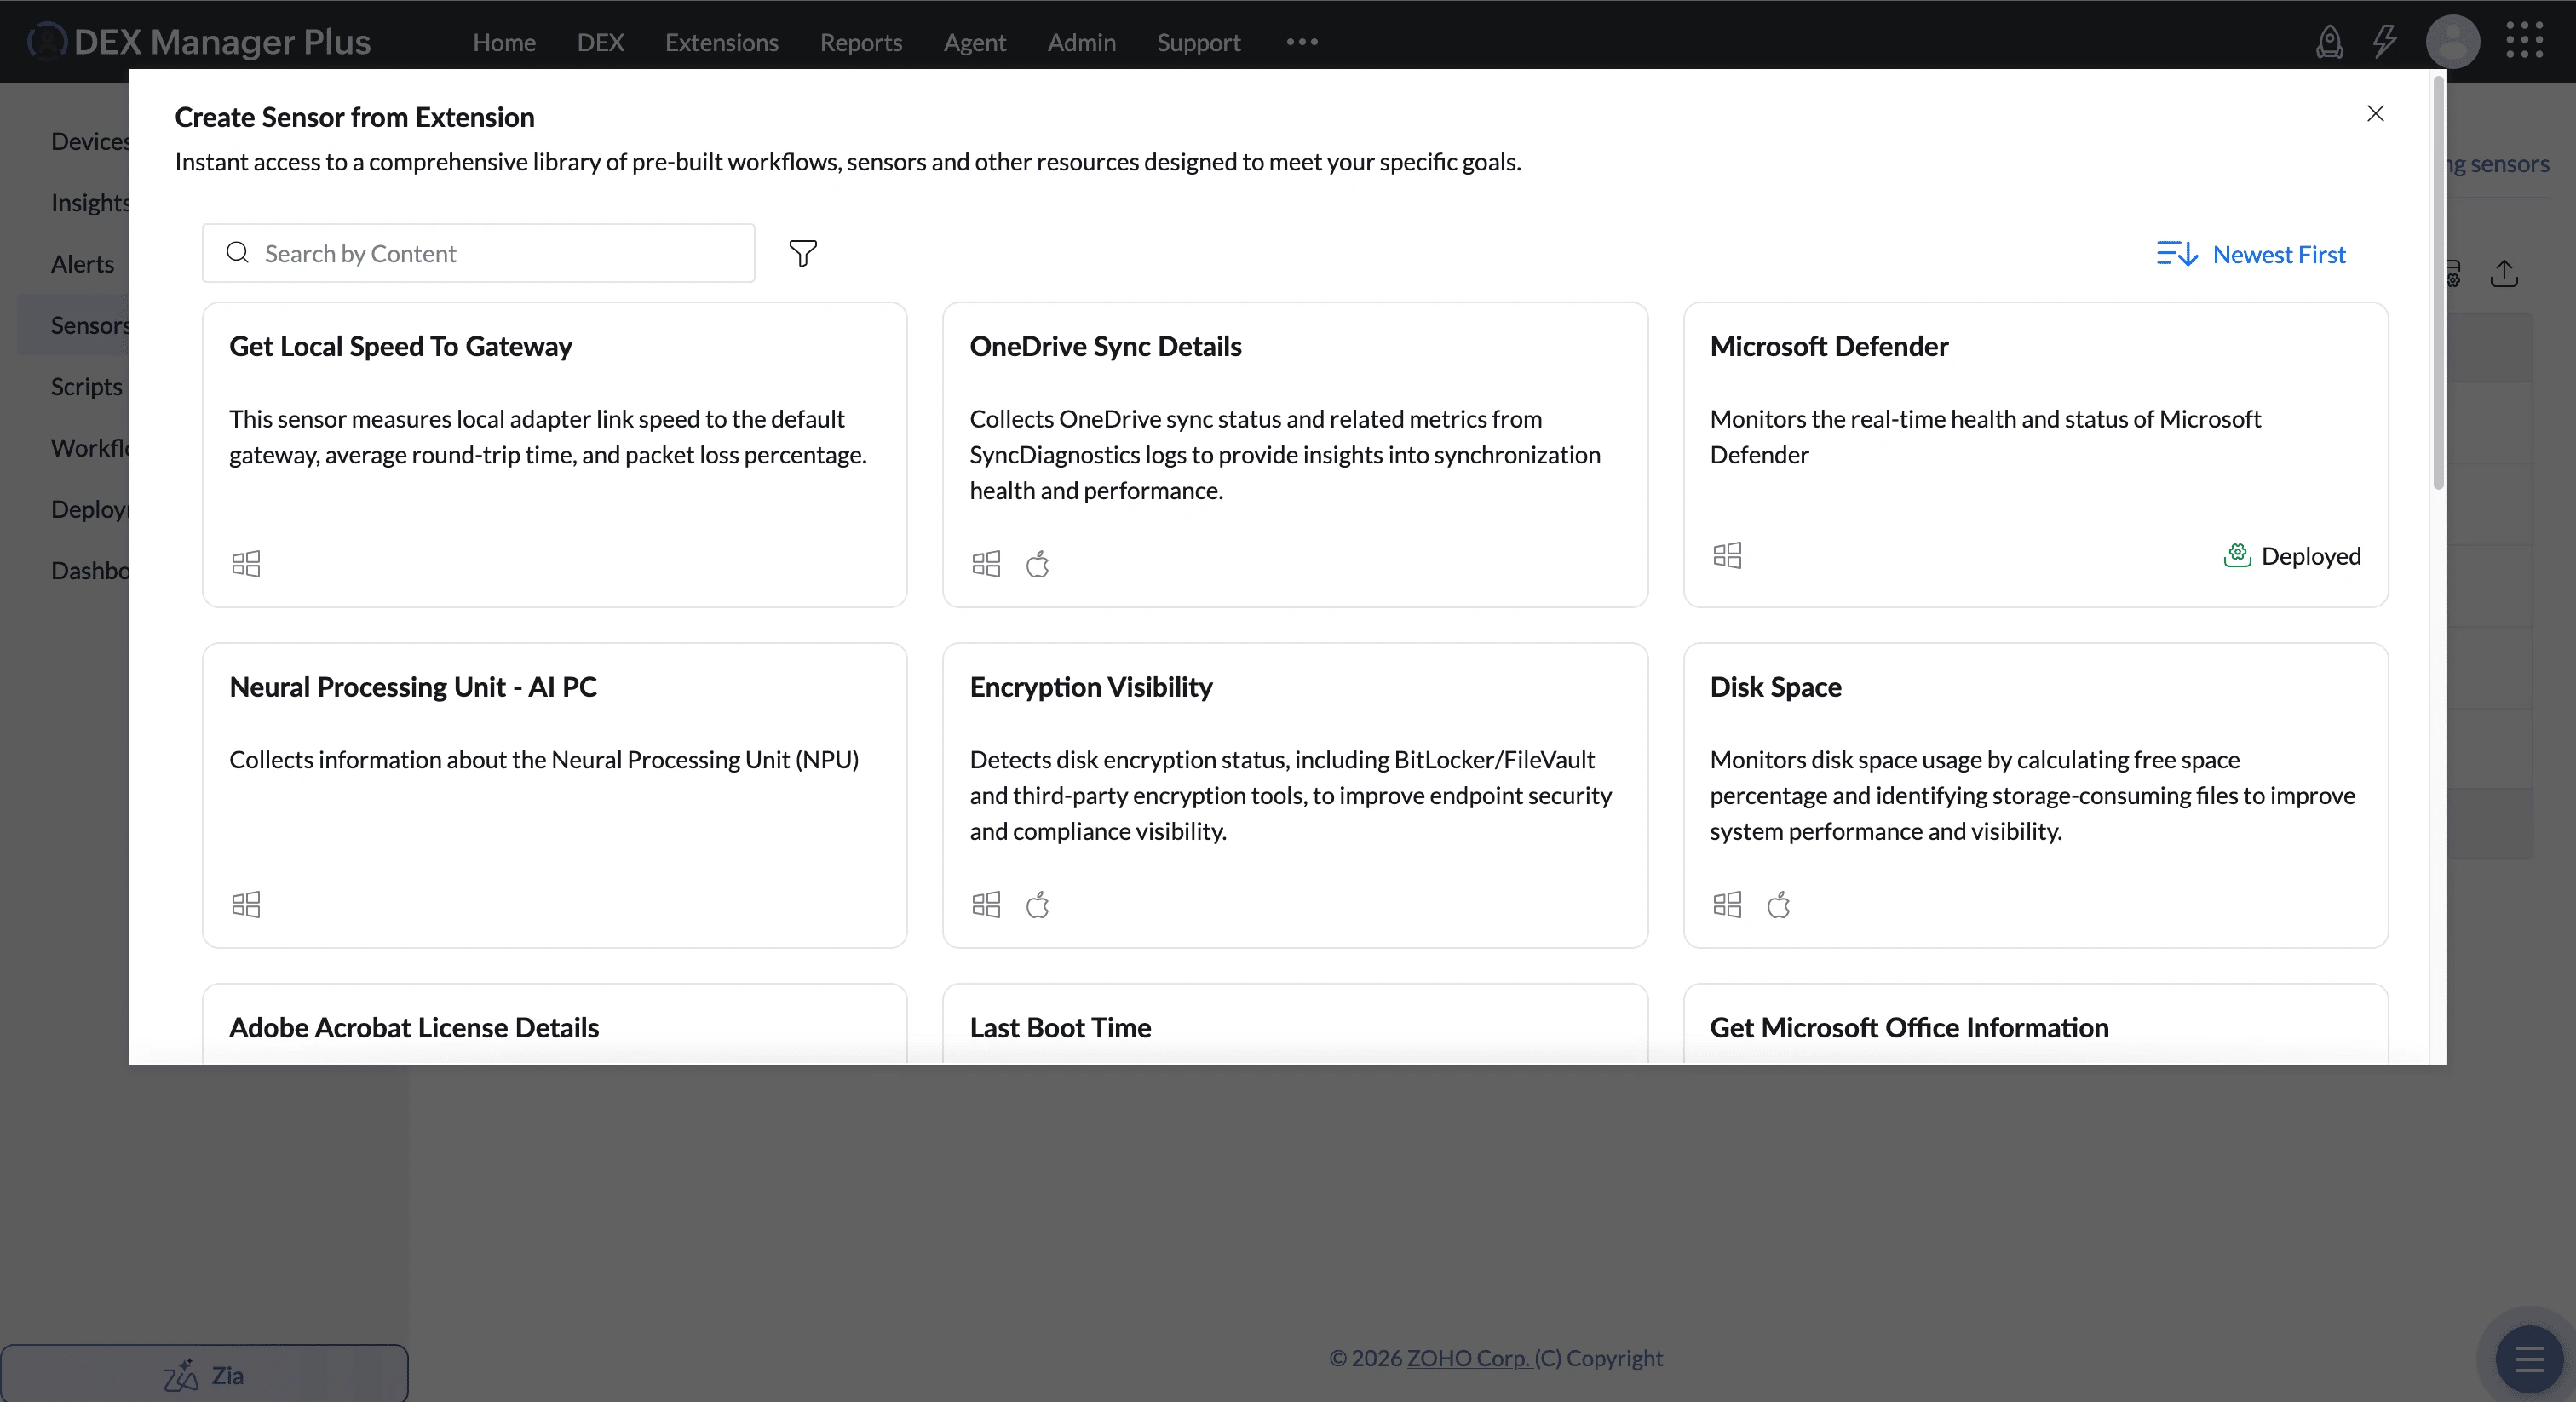
Sensors can be added from Extensions, which provide ready-made sensors designed to address common IT and endpoint management use cases. These pre-built solutions help you quickly monitor and manage specific use cases without having to create sensors from scratch.
Click on the Create Sensor button and select Choose from Extension from the dropdown.
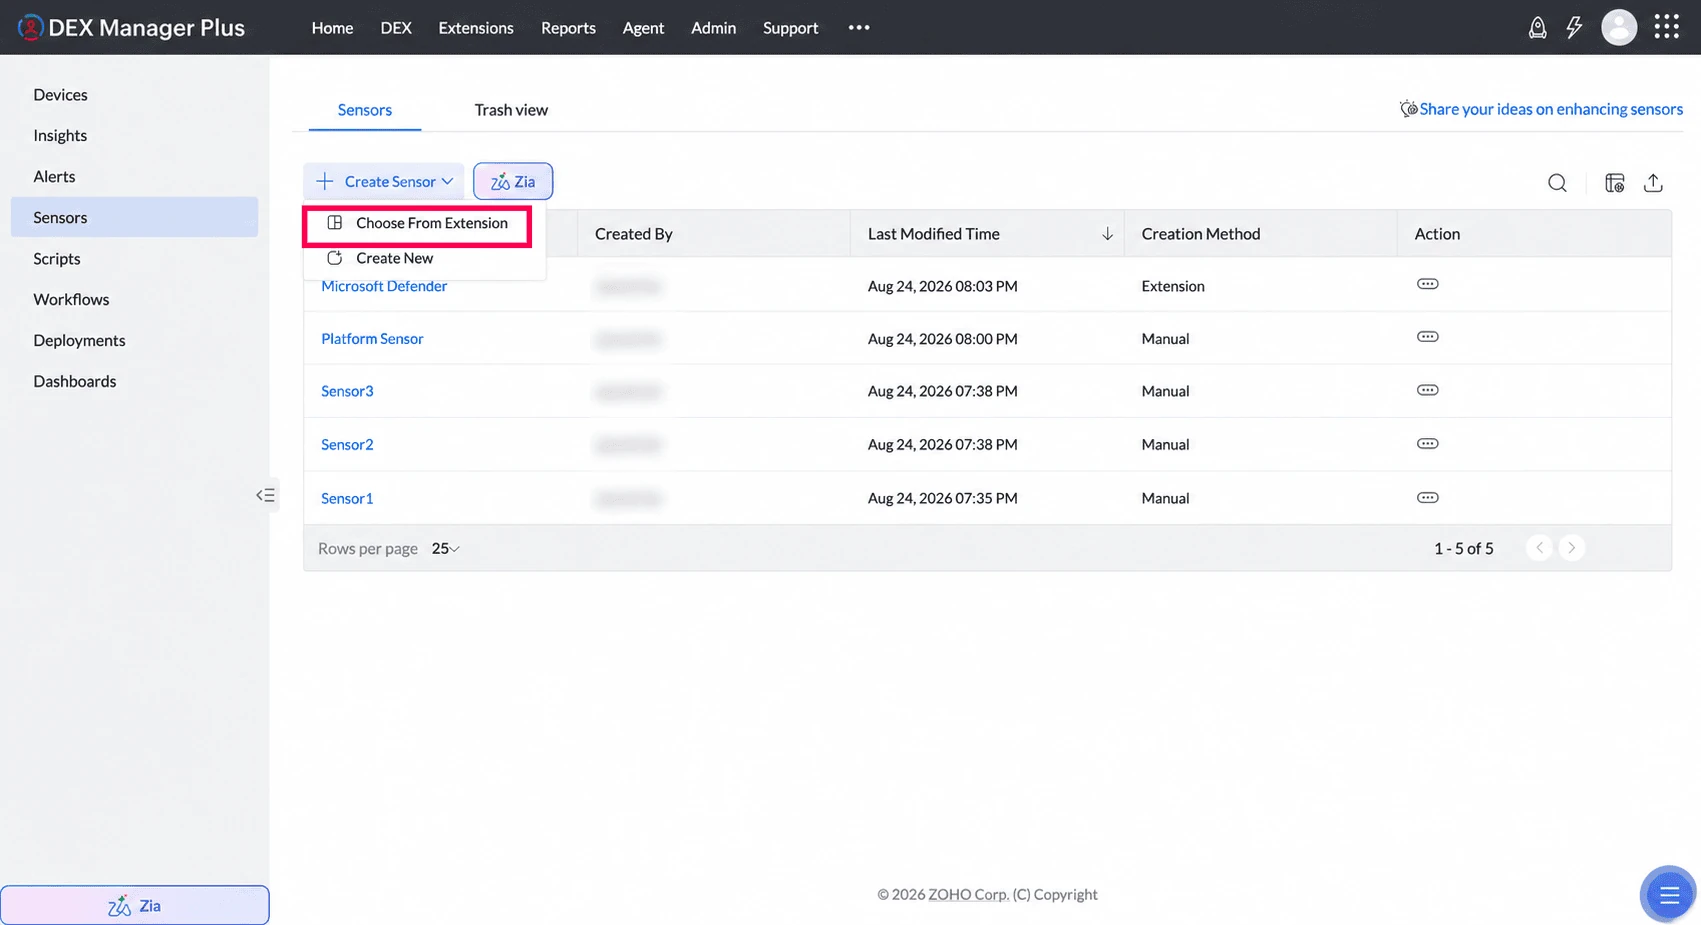
Available sensors will be listed. Select the sensor that matches your use case and add it to your environment.
Deploying a Sensor
A saved sensor collects data only after it is deployed to devices. You can deploy a sensor from two places, and both create the same deployment:
- From the sensor’s own Deployment tab — convenient when you are already working on that sensor.
- From the Deployments module — convenient when you are setting up several deployments together.
Sensors support Immediate and Schedule deployment modes. For full details on deployment, targeting, and monitoring, see Deployments.
Deploy from the Sensor’s Deployment Tab
- Open the sensor, then select the Deployment tab.
- Click Create Deployment.
- Enter a Deployment Name and an optional description.
- Select one or more Custom Groups to define the scope. Use the include / exclude options for finer targeting.
- Set the Deployment Mode to Immediate or Schedule. If you choose Schedule, set the frequency, active period, and run time.
- Click Deploy.
Deploy from the Deployments Module
Set the Type to Sensor when creating the deployment. For the full procedure, see Creating a Deployment.
| Use Case | Description |
|---|---|
| Network Strength | Monitor endpoint connectivity quality in remote setups and trigger alerts if poor (for example, Wi-Fi signal strength, speed). |
| Windows 11 Readiness | Check TPM version, OS build, and hardware specs to assess upgrade compatibility. |
| POS Hardware Check | Ensure barcode scanners and printers are connected to retail systems. |
| Inactive Local Users | Detect dormant local accounts for cleanup and compliance. |
| Software Checks | Track specific software versions, editions, and usage, and flag outdated or unlicensed installations. |
Best Practices
| Practice | Why It Helps |
|---|---|
| Use descriptive sensor names | Improves discoverability and reduces misconfiguration |
| Flag sensitive fields as PII | Ensures privacy and regulatory compliance |
| Test a sensor on a small group first | Prevents execution failures or device impact |
| Avoid overlap with built-in metrics | Focus sensors on what’s unique to your environment |
| Reuse sensors in multiple workflows | Promotes modular, scalable automation |