Why do we need digital experience analytics
System slowdowns. App crashes. Freezes. These are among the most common complaints IT teams receive—but rarely are they accompanied by actionable detail. A ticket might say, “My laptop is slow,” but what does that actually mean?
Traditional monitoring tools can tell you what went wrong—high CPU usage, low disk space, memory spikes—but they rarely explain why it happened or how it affected the end user.
That’s the missing link.
Without context, IT teams are left to guess, escalating issues unnecessarily and wasting hours chasing symptoms instead of solving the root problem.
Digital experience analytics bridges this gap, transforming vague complaints and disconnected alerts into clear, correlated insights. It gives IT the context they need to diagnose faster, fix smarter, and support users proactively.
How Insights & Root Cause Analysis (RCA) simplify troubleshooting
Collecting telemetry is the foundation. But data without interpretation only tells you what went wrong — not why.
That’s where DEX Manager Plus' Insights and Root Cause Analysis (RCA) capabilities come in.
When users raise tickets like “My system is slow” or “Apps keep crashing,” IT teams often face a lack of clarity and context. Standard alerts might point to a spike in CPU or memory usage, but they stop short of explaining what’s causing it. Without deeper analytics, support teams are left guessing, wasting time, and piling up unresolved tickets.
With DEX Manager Plus, telemetry isn't just collected — it's interpreted.
Automatic correlation and prioritized Insights
Here’s how it works:
- Configurable thresholds trigger alerts when a monitored metric (like memory or CPU usage) crosses a critical value.
- These alerts are automatically grouped, avoiding alert fatigue. For example, if Microsoft Teams is crashing on 100 machines, instead of 100 alerts getting triggered, they are smartly grouped into a single alert that is easier to deal with, for the IT teams.
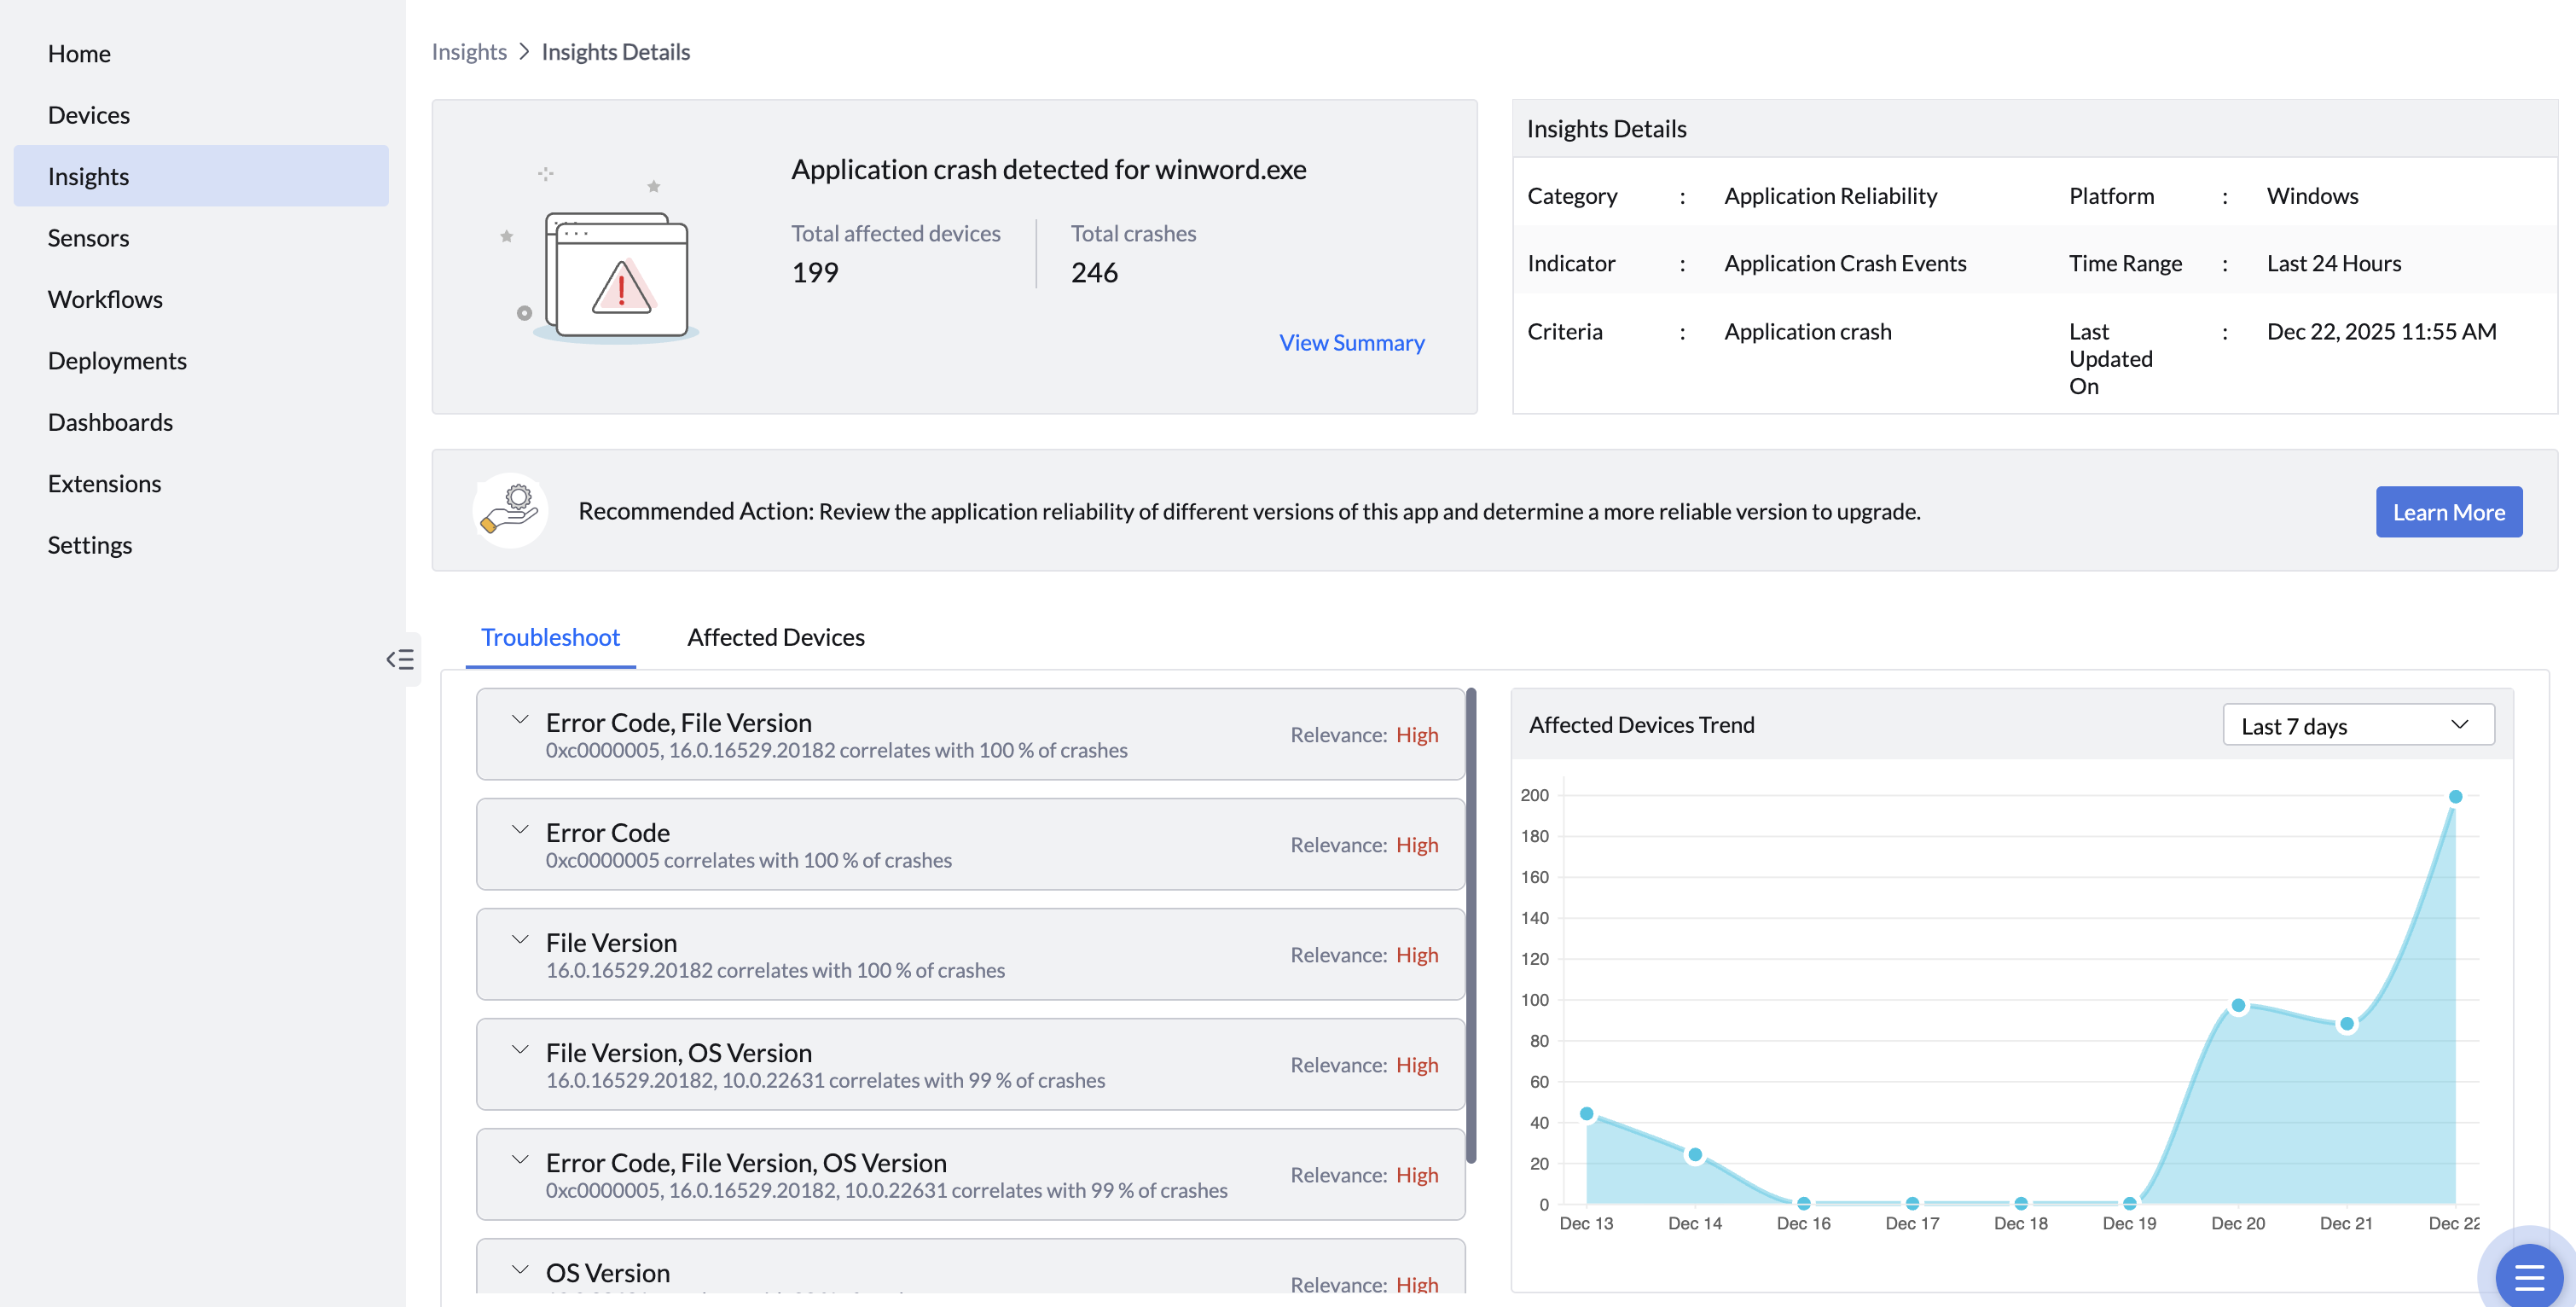
- Drilling down into the alert, IT doesn’t just see the incident. They see what contributed to it, how often it’s occurred, and which devices are consistently affected.Automatic correlation between components that contributed to the issue is available for complete context and smarter diagnostics.
- The correlated components are prioritized based on their criticality using a pre-defined algorithm within the solution, so IT knows what to fix first.
- Apart from analytics, we also suggest remediation or recommended best practices to fix an issue then and there. For instance, if an app crash alert is triggered, we will establish complete details of the version that crashed, how often it crashed, and on how many machines, along with recommendation to move to a stabler older version or update to a new version.
This step — turning data into context — is what transforms telemetry collection into true experience analytics
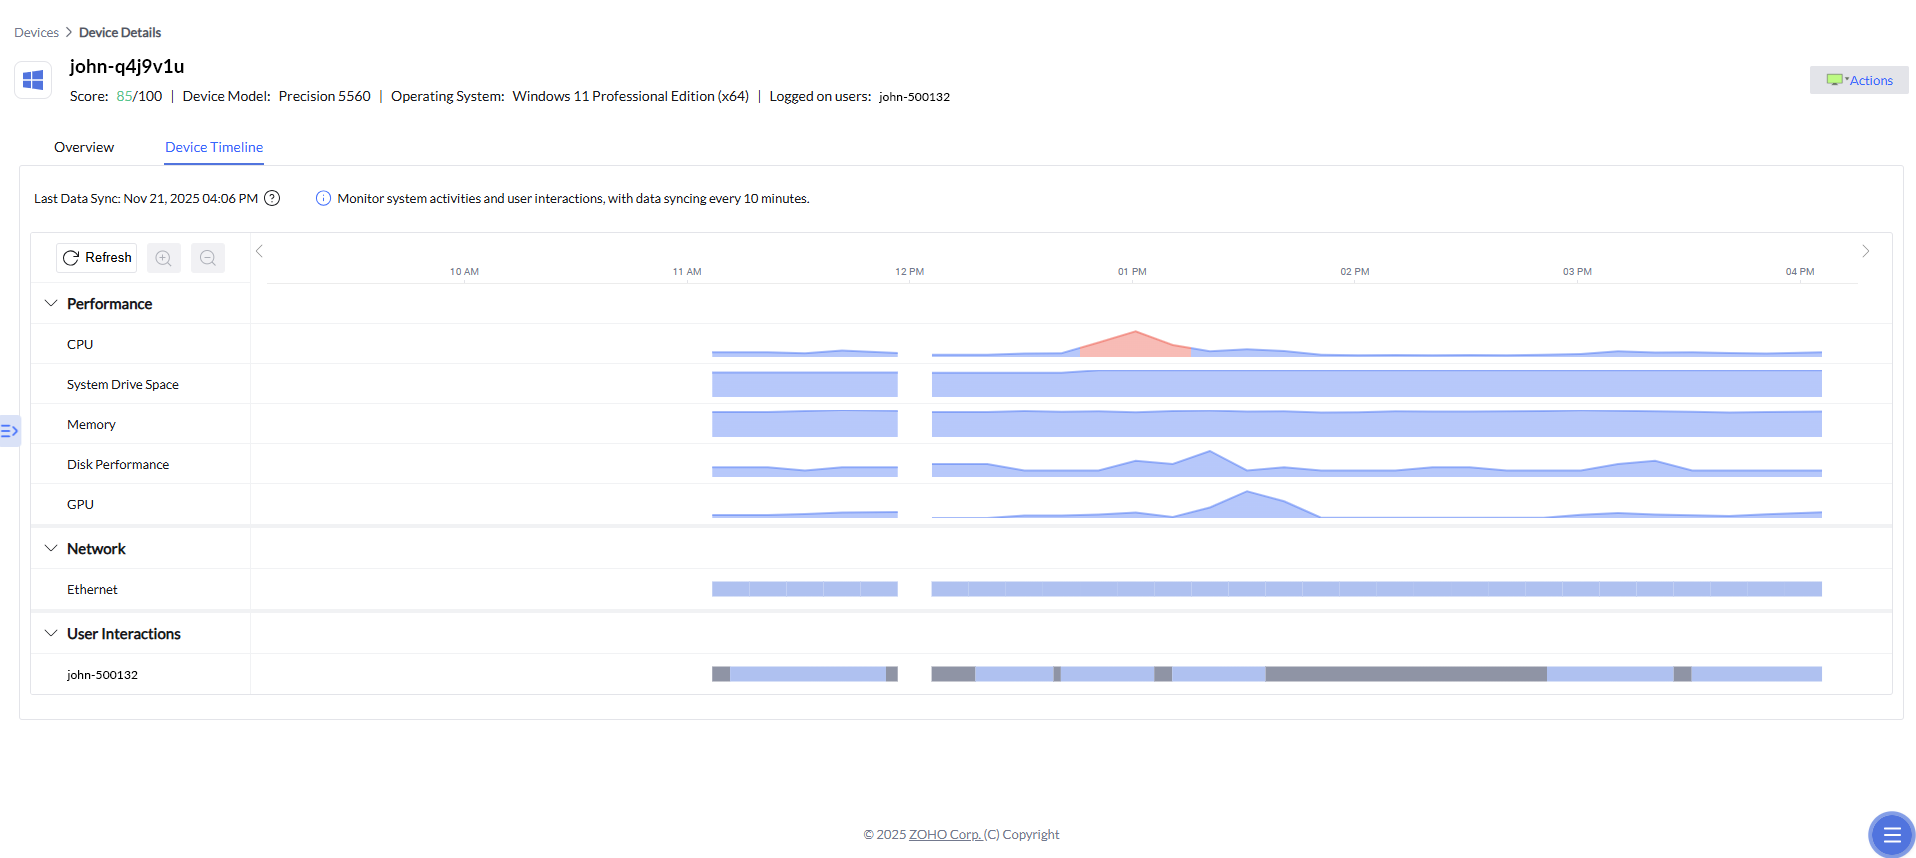
Device Timeline
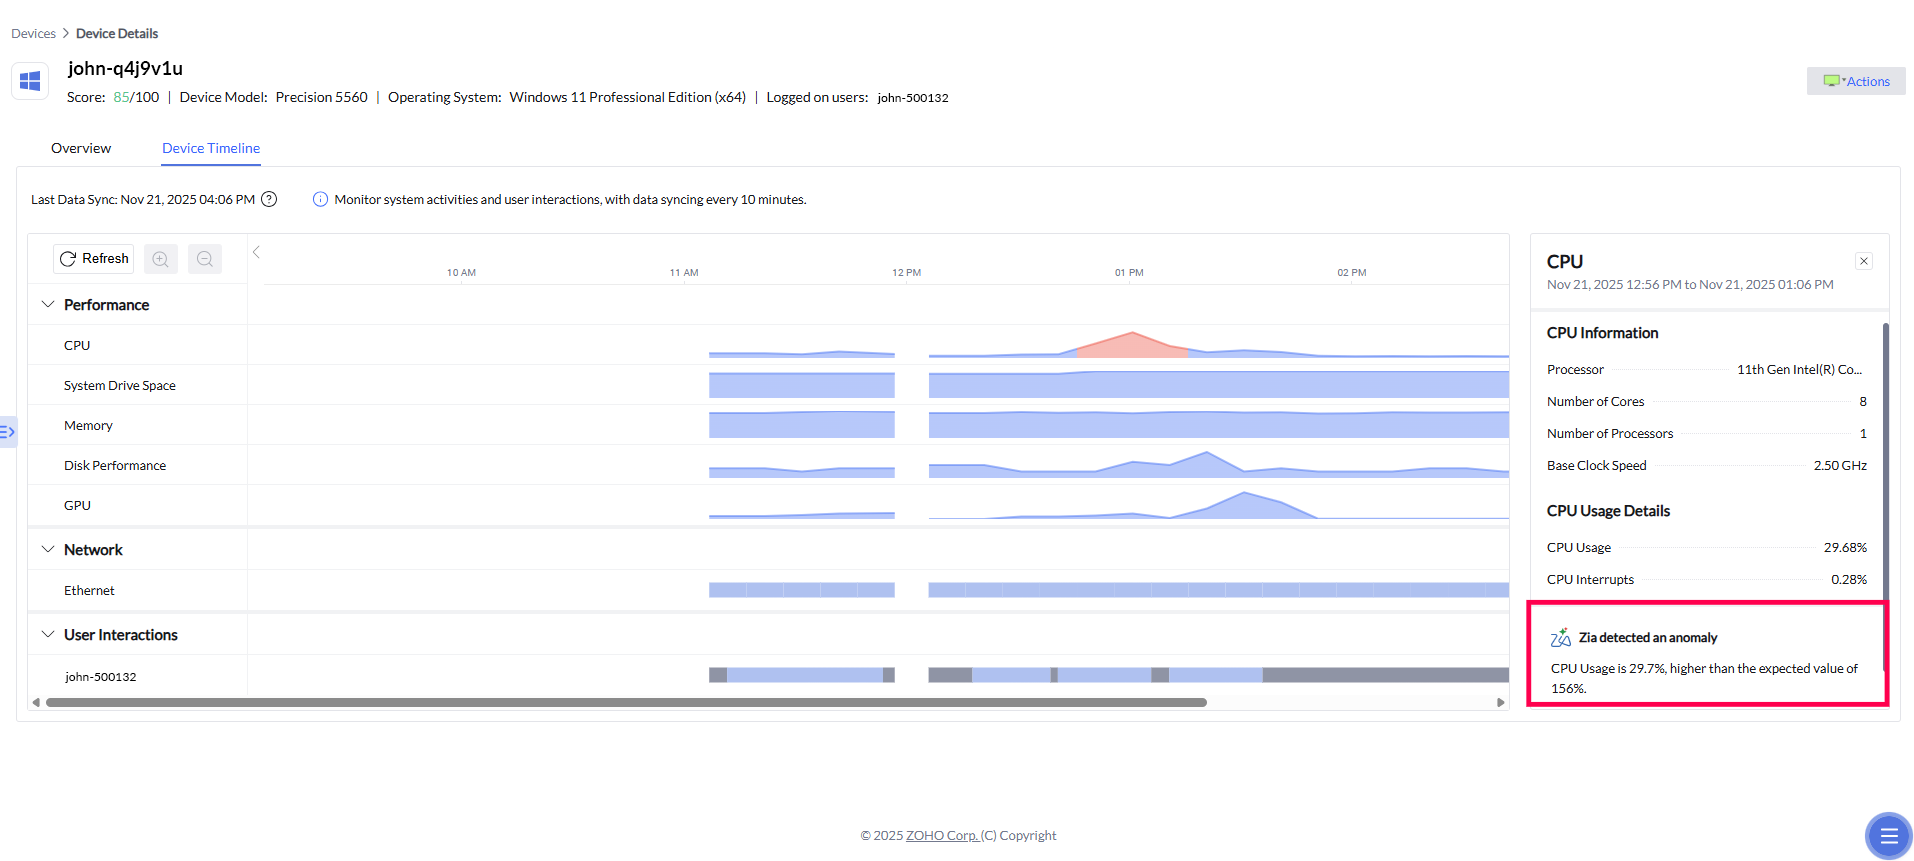
In addition to correlated alerts and prioritized insights, Device Timeline adds a critical time-based dimension to root cause analysis. It allows IT teams to visually trace device behavior before, during, and after an incident by laying out performance and network metrics on a chronological timeline. When an alert is triggered, admins can jump to the exact timeframe in which the issue occurred and examine related CPU spikes, memory pressure, disk activity, or network fluctuations. This historical context helps confirm causality, distinguish symptoms from root causes, and understand whether an issue was isolated or part of a broader pattern—further accelerating diagnosis and enabling more confident remediation decisions.
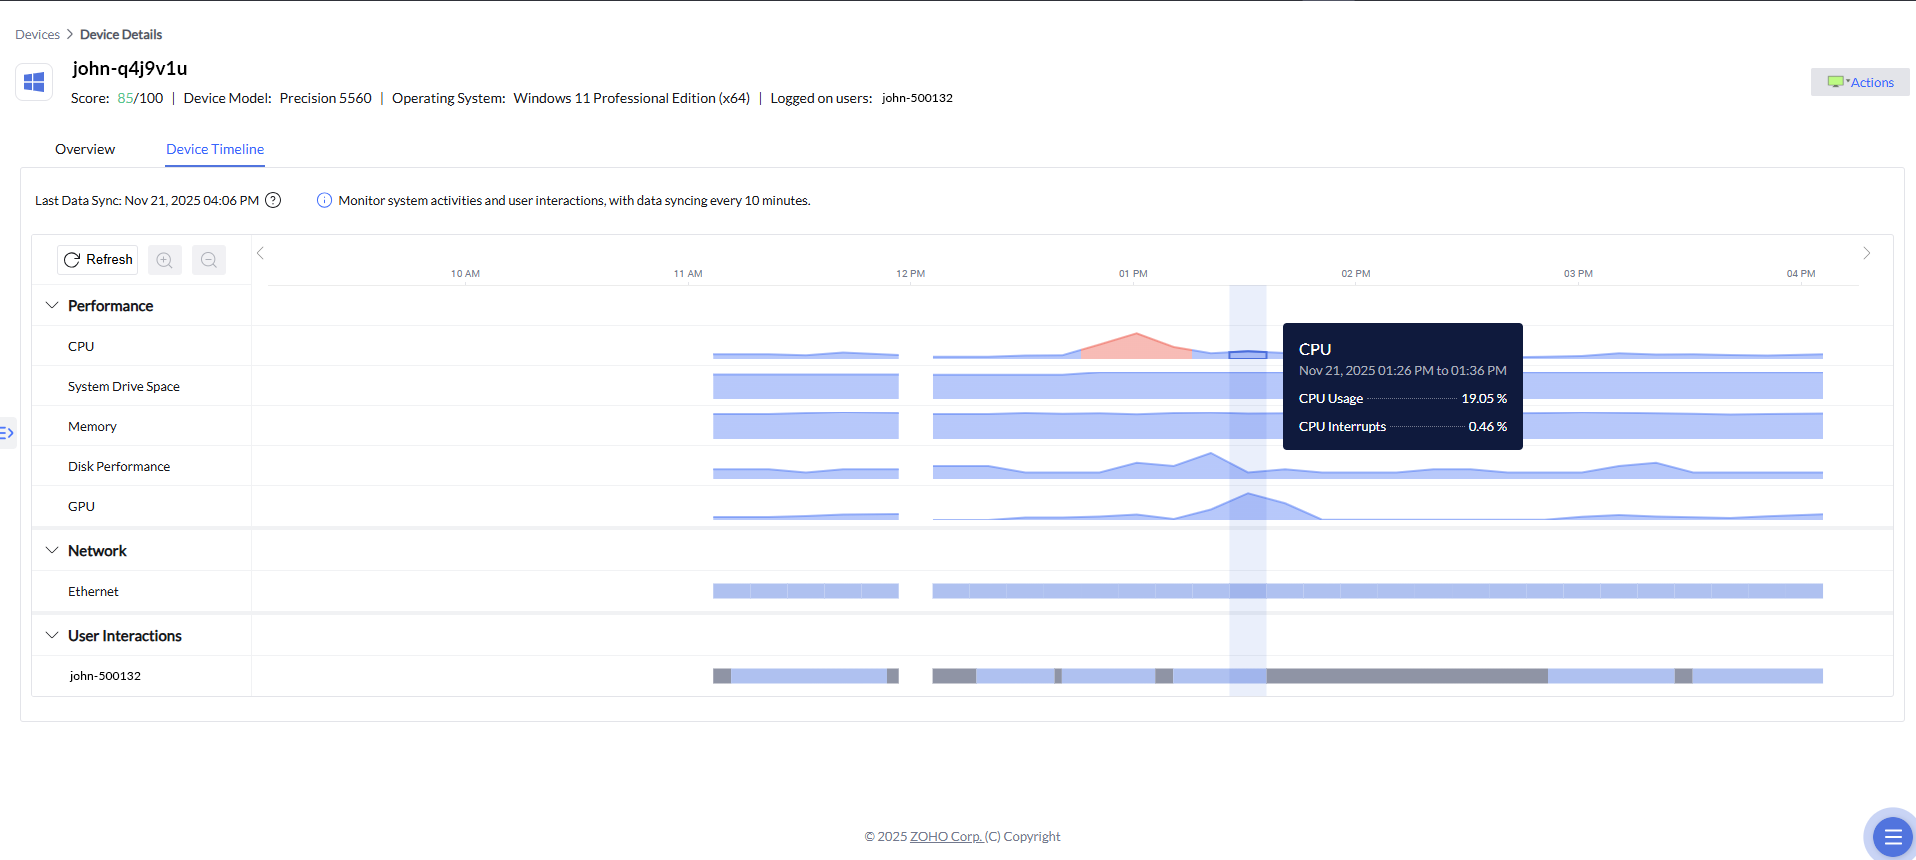
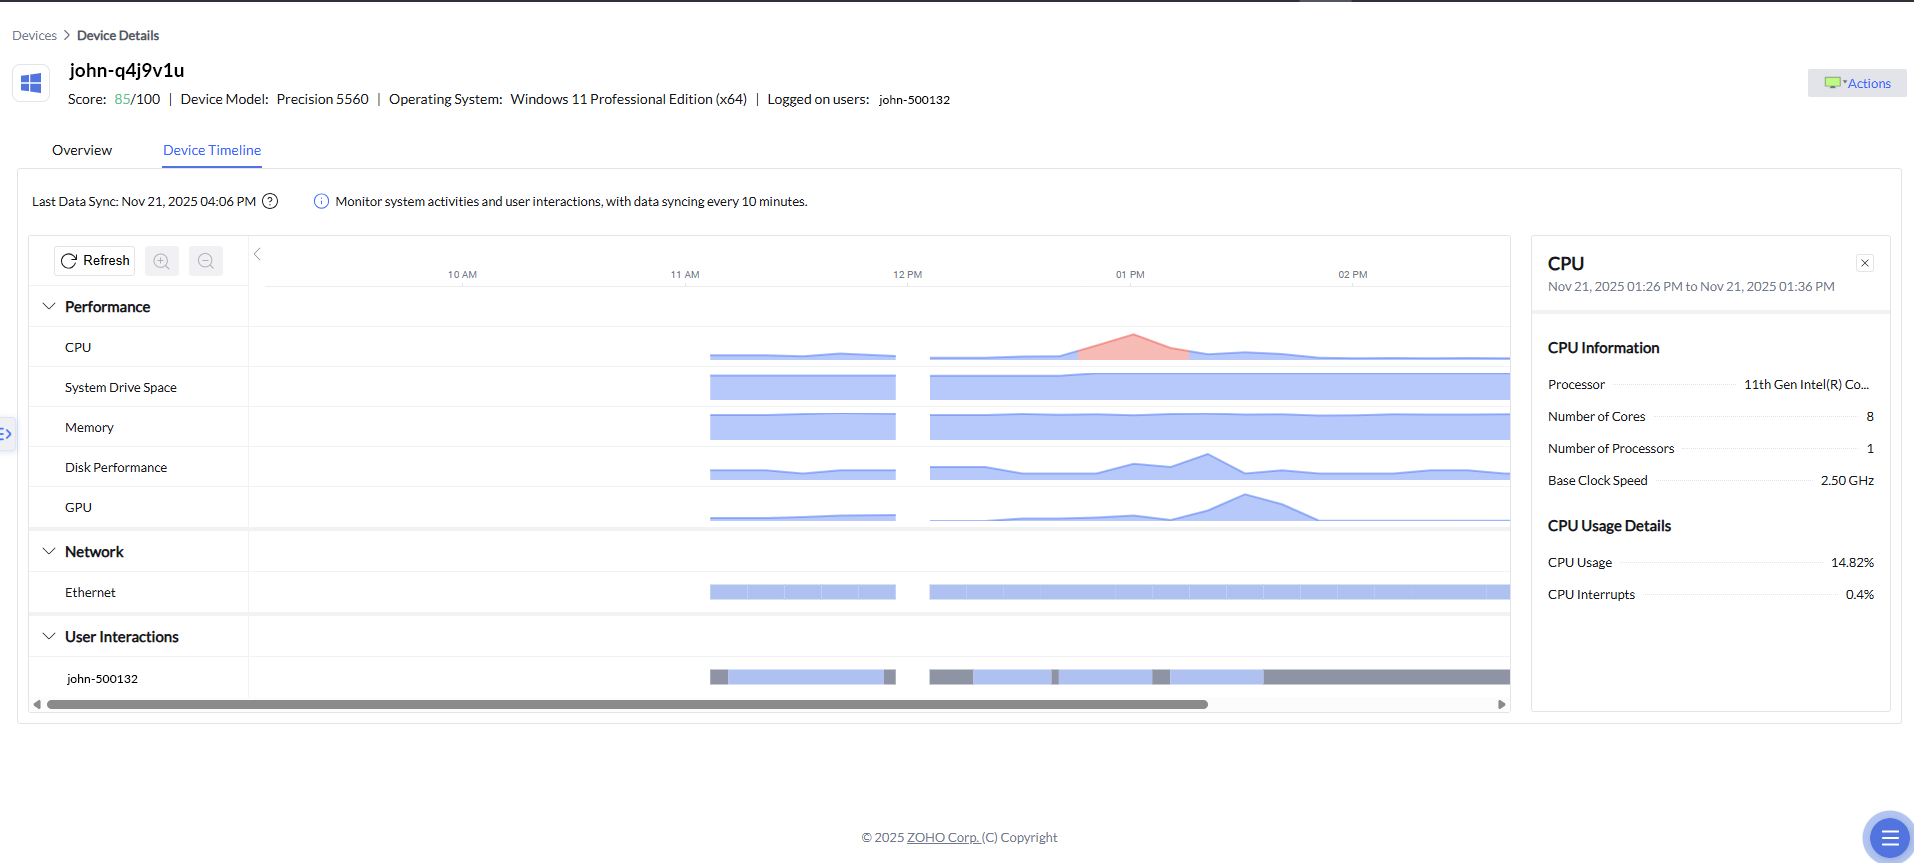
Zia Anomaly Detection
Building on the historical context provided by Device Timeline, Zia's anomaly detection adds an intelligent layer of interpretation to device behavior. By continuously learning what “normal” performance looks like for each device over time, the system can automatically flag unusual deviations in CPU, GPU, or memory activity when they occur. These anomalies are highlighted directly within the timeline, allowing IT teams to quickly spot unexpected spikes, drops, or irregular patterns and understand how far they diverge from typical behavior. Instead of manually scanning metrics, admins are guided to the moments that matter most, with contextual insights that explain why the deviation is noteworthy—making root cause analysis faster, more precise, and far less reliant on guesswork.
The next step in empowering proactive IT support and enabling a frictionless digital experience is in automating remediation to the issues detected, or in simpler terms, resolving the experience hampering or potentially problematic issues.