Configuring Forecast Alerts
Forecast alerts help you stay updated on the resource utilization of your network devices, by predicting the approximate duration in which your resource(s) could potentially be exhausted. This prediction is based on the observation of the particular resources over a period of time, and utilizing a forecast engine to forecast the future trend of utilization. Alerts are raised based on this forecast, for early mitigation and a proper plan of action to be taken by the network administrator.
List of monitored resources
With the latest version of OpManager, forecast alerts are supported for the following resources, using their respective monitors:
Resource | Monitor |
|---|---|
| Disk Forecast | Disk Utilization |
| SQL Server Transaction Log | Log Files Used Percentage |
| Storage Server | Capacity Utilization |
| VMware Datastore | Datastore Free Space (%) |
| Interface Rx Utilization | Interface Rx Utilization |
| Interface Tx Utilization | Interface Tx Utilization |
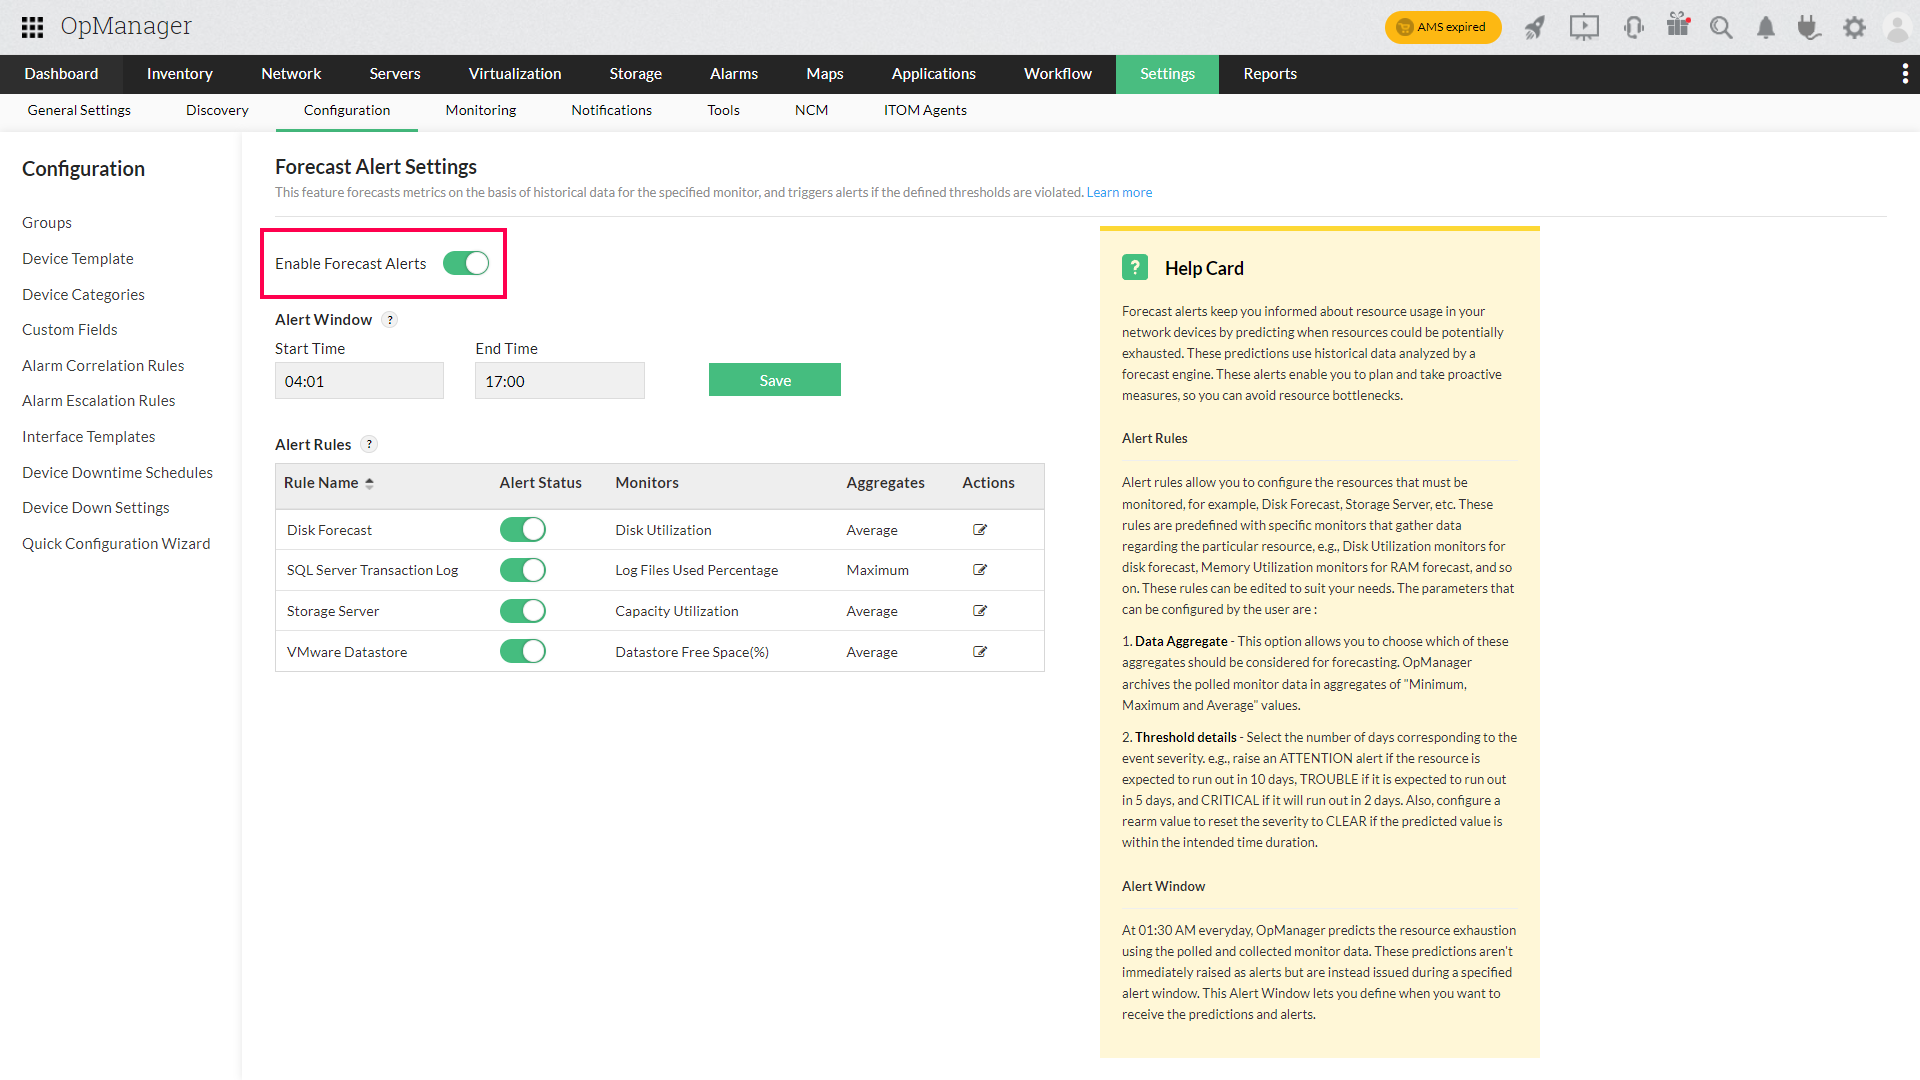
How to enable/disable Forecast Alerts
- Navigate to Settings → Configuration → Quick Configuration Wizard → Forecast Alerts.
- Use the toggle to enable/disable Forecast Alerts.
Alert Rules
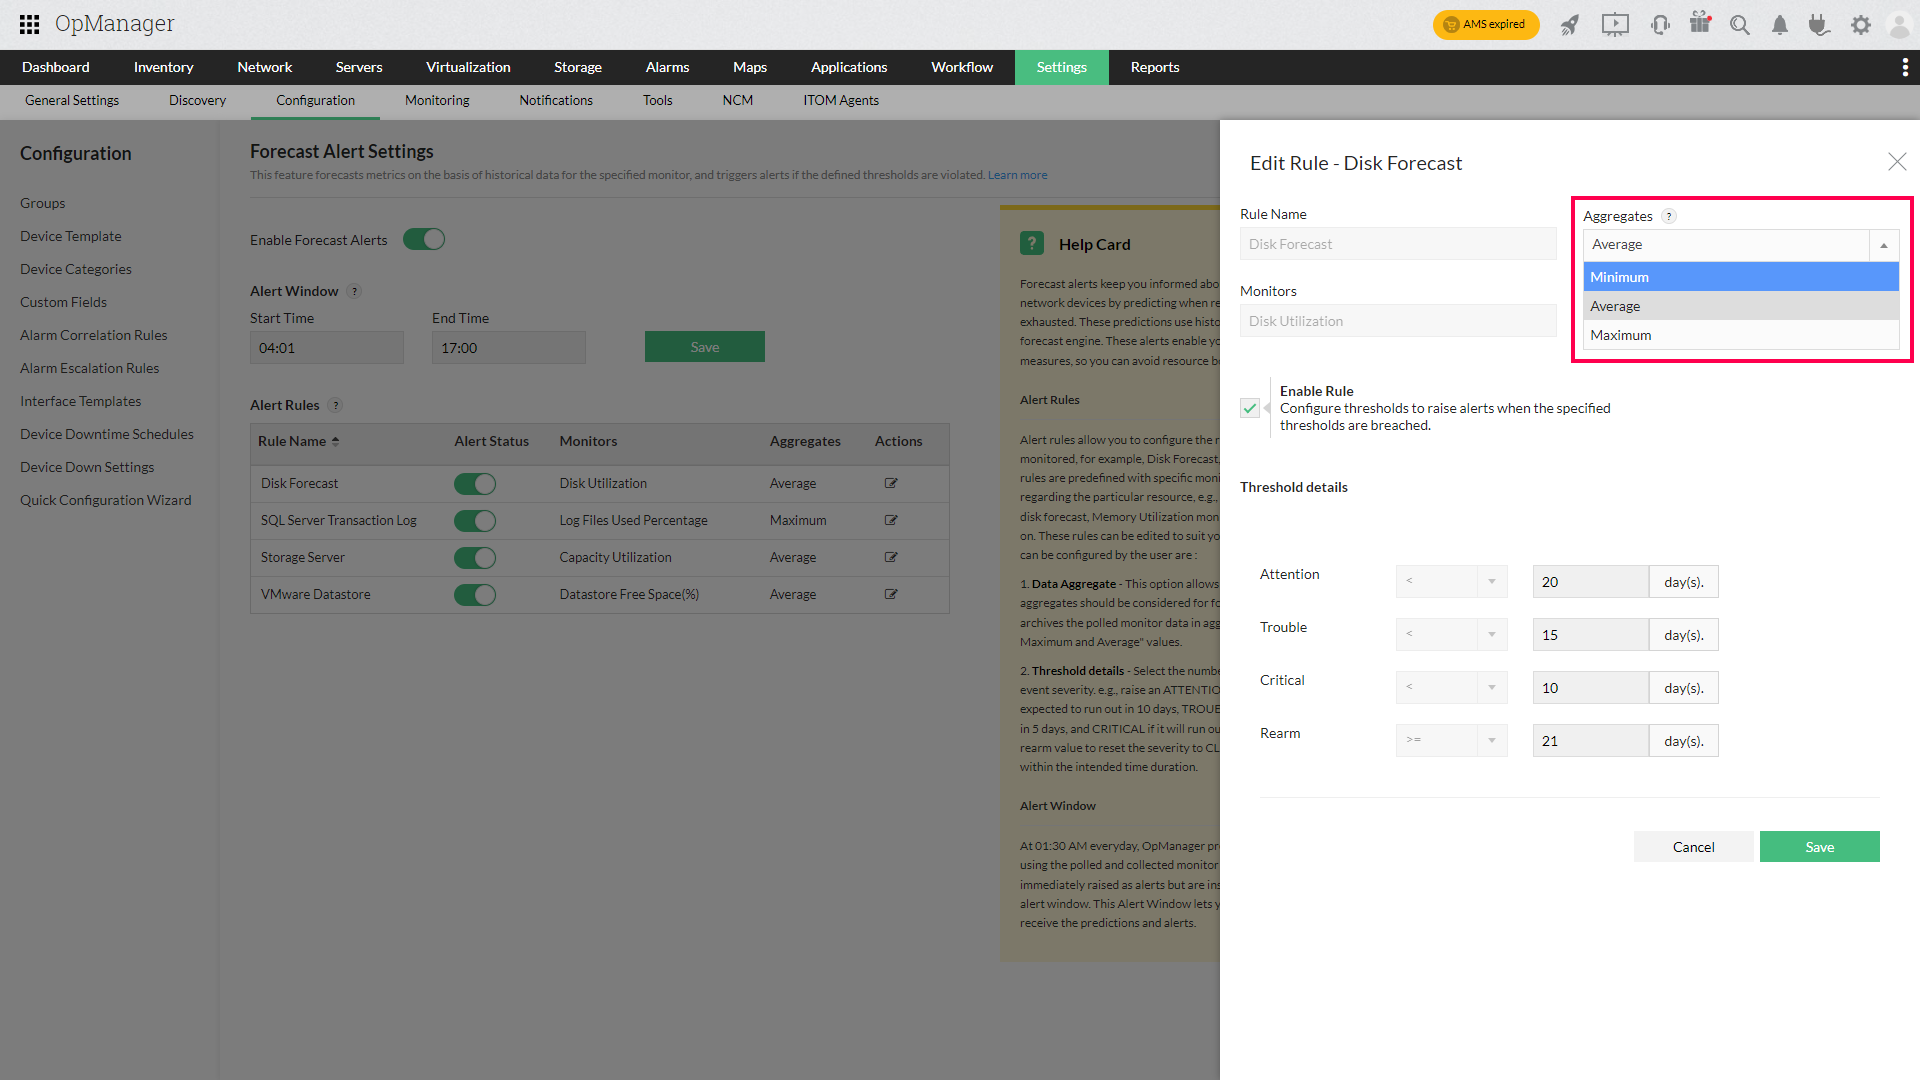
Forecast Alerts rely on alert rules to identify which resources must be monitored, for example, Disk Forecast, etc. These rules are predefined with specific monitors that gather data pertaining to the particular resource, e.g., Disk Utilization monitors for disk forecast, Memory Utilization monitors for RAM forecast, and so on. These rules can be edited to suit the network administrator's needs. The parameters that can be configured by the user are:
- Data Aggregate: This option allows you to choose which of these aggregates should be considered for forecasting. OpManager archives the polled monitor data in aggregates of MIN, MAX, and AVG values. To know more about these aggregates, please check this page.
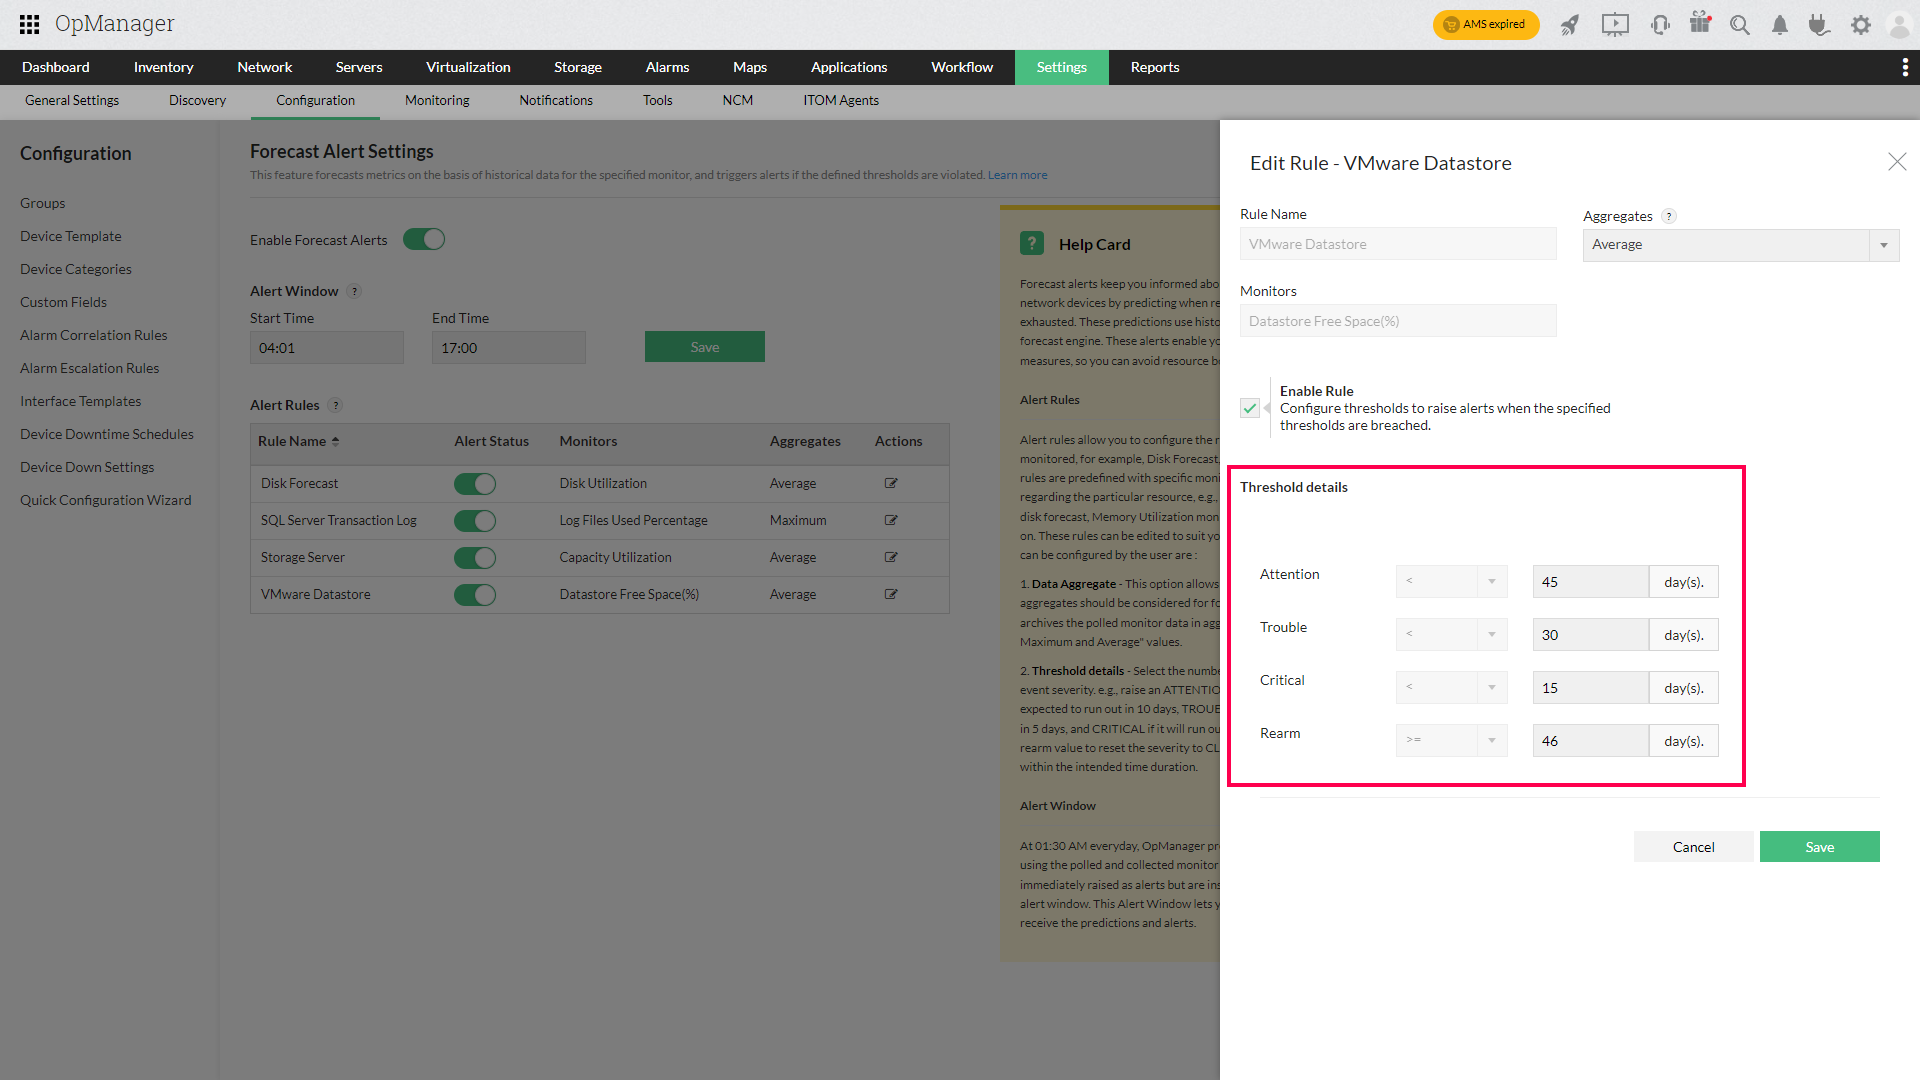
- Threshold Details: Select the number of days corresponding to the event severity. e.g., raise an ATTENTION alert if the resource is expected to run out in 10 days, TROUBLE if it is expected to run out in 5 days, and CRITICAL if it will run out in 2 days. Also, configure a rearm value to reset the severity to CLEAR if the predicted value is within the intended time duration.
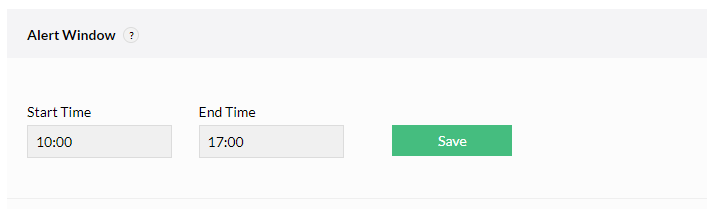
Alert Window
OpManager routinely polls the monitors associated to the alert rules, and every day, during non-business hours (01:30 AM), the forecast engine uses this data to predict the expected resource exhaustion duration. The predictions made during this time, are not raised as alerts immediately, but rather, during a time frame referred to as the alert window. This duration is the time during which you wish to receive the predictions (and therefore, the alerts).
Note: For convenience, it is recommended that the configured alert window be the same as your business hours.
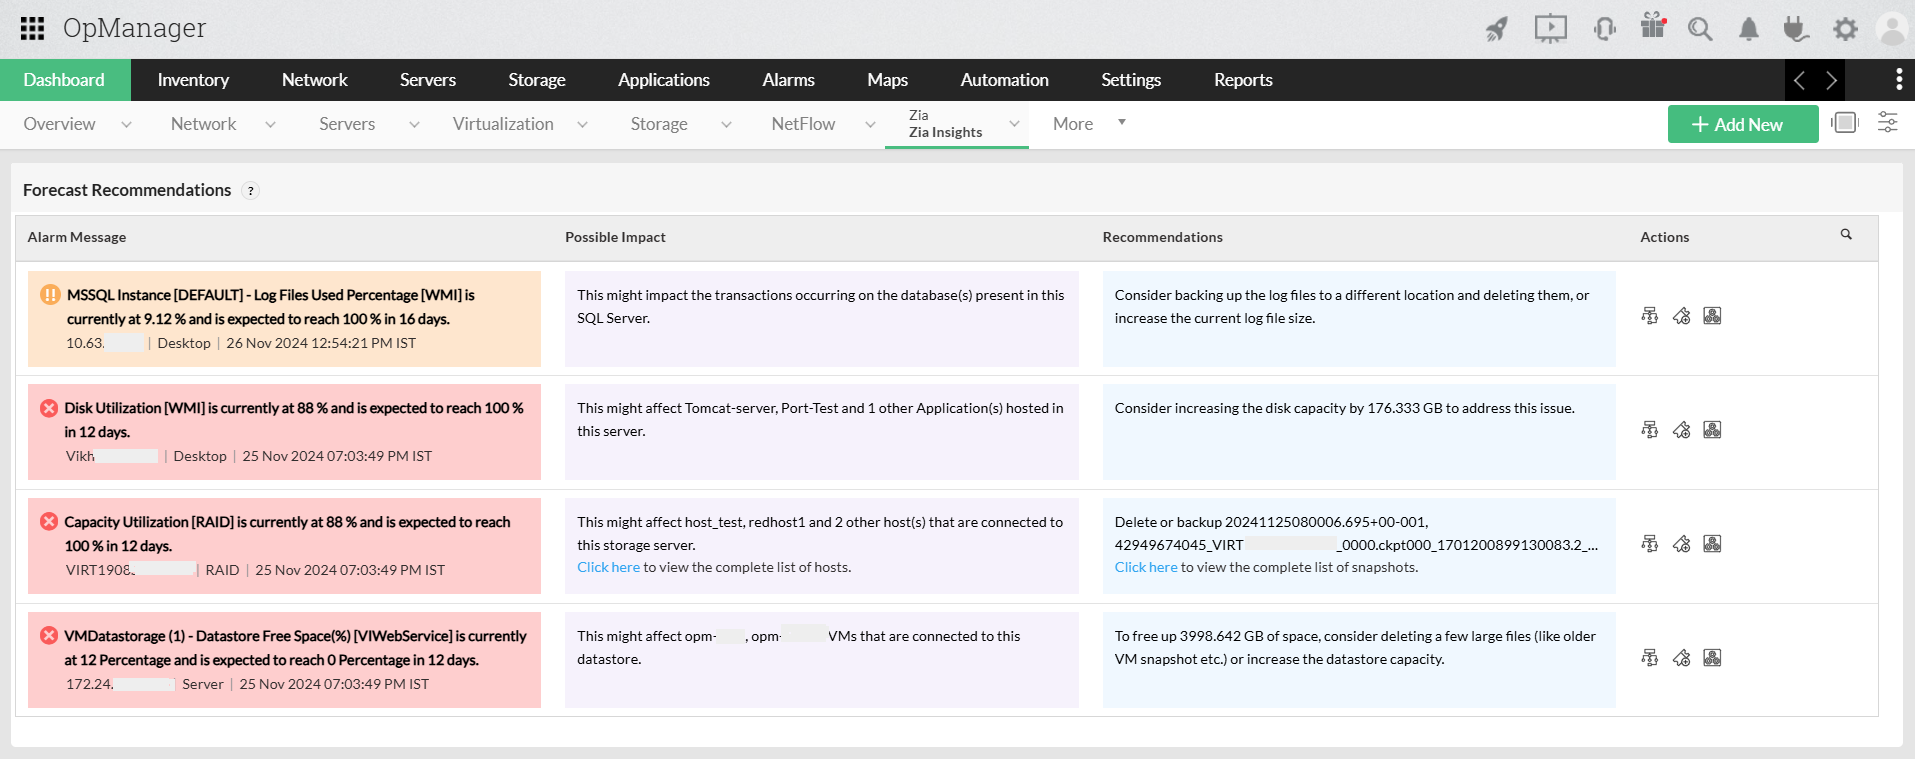
Zia Dashboard–Driven Insights using Forecast Alerts
Forecast Alerts drive the recommendations displayed in the Zia Insights Dashboard. They analyze historical performance data to predict when a resource is likely to reach its utilization threshold, providing an estimate of the time remaining before exhaustion.Based on these predictions, OpManager generates early warnings to support proactive planning and timely remediation. The insights also help identify potential impacts on related resources if the alert is not addressed, along with recommended actions to prevent disruptions.