Monitoring GPU with OpManager
GPUs are central to modern infrastructure, powering AI training, machine learning inference, and high-performance data processing. As reliance on GPU-enabled systems grows, issues like overheating, memory saturation, or performance degradation can quietly affect workloads before being noticed.
OpManager gives sysadmins, DevOps teams, and AI engineers visibility into GPU utilization, memory consumption, temperature, power draw, and device status across Linux-based hosts — all from one place. Seven key monitors are automatically associated with a device upon discovery; the remaining monitors can be added manually as needed.
- Auto Discover and Associate GPU Monitors
- Viewing GPU Data
- Associating NVIDIA GPU Monitors to Multiple Devices
- Supported NVIDIA GPU Monitors for Linux
Auto Discover and Associate GPU Monitors
During CLI-based device discovery, OpManager detects whether the device supports NVIDIA GPU. If supported, the following key GPU metrics are automatically associated with the device:
- NVIDIA GPU Availability [CLI]
- NVIDIA GPU Fan Speed in Percent [CLI]
- NVIDIA GPU Memory Utilization [CLI]
- NVIDIA GPU Power Draw in Percent [CLI]
- NVIDIA GPU Power Draw in Watts [CLI]
- NVIDIA GPU Temperature in Celsius [CLI]
- NVIDIA GPU Utilization [CLI]
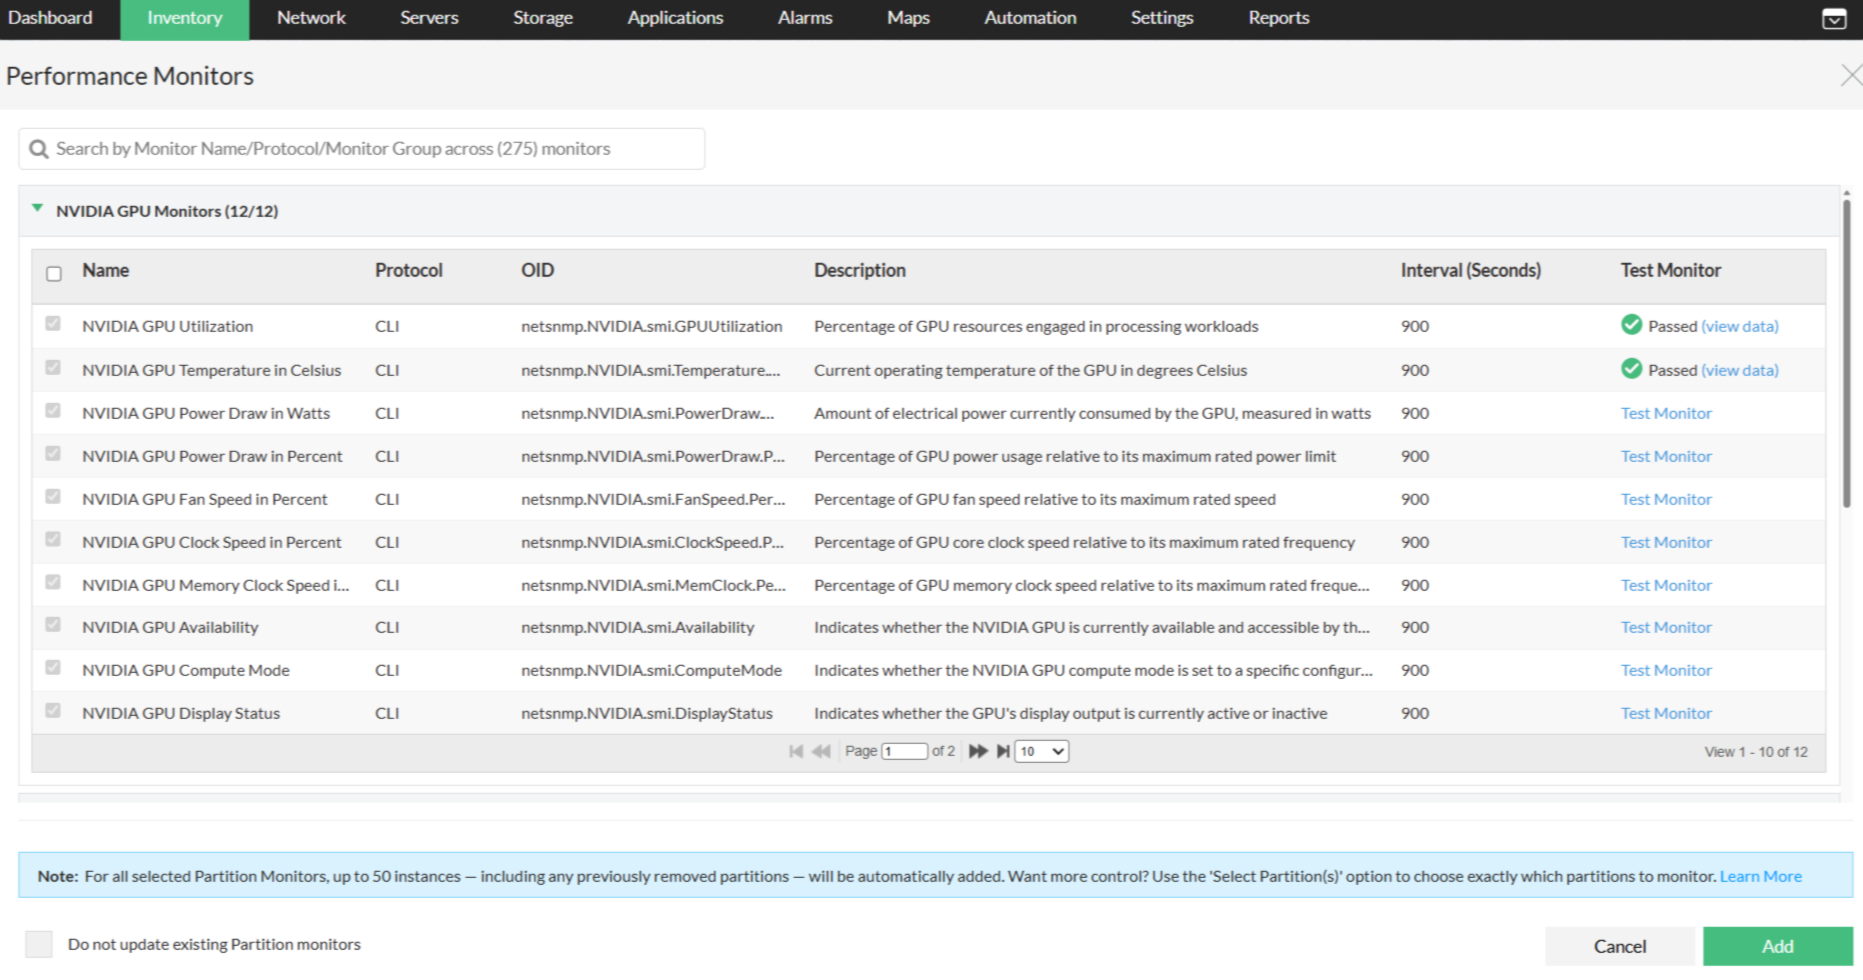
To manually associate the remaining monitors, go to the respective Linux-based device's Snapshot page → Monitors → Performance Monitors → Actions → Add Performance Monitors.
Here, monitors are listed in the "NVIDIA GPU Monitors" section. Select the monitors required, and click on Add.
Viewing GPU Data
From Device Snapshot Page
Once GPU monitors are associated, the collected metrics are available on the device's Snapshot page → GPU tab. Use the filter on the top right to select a specific GPU Instance ID and view its metrics.
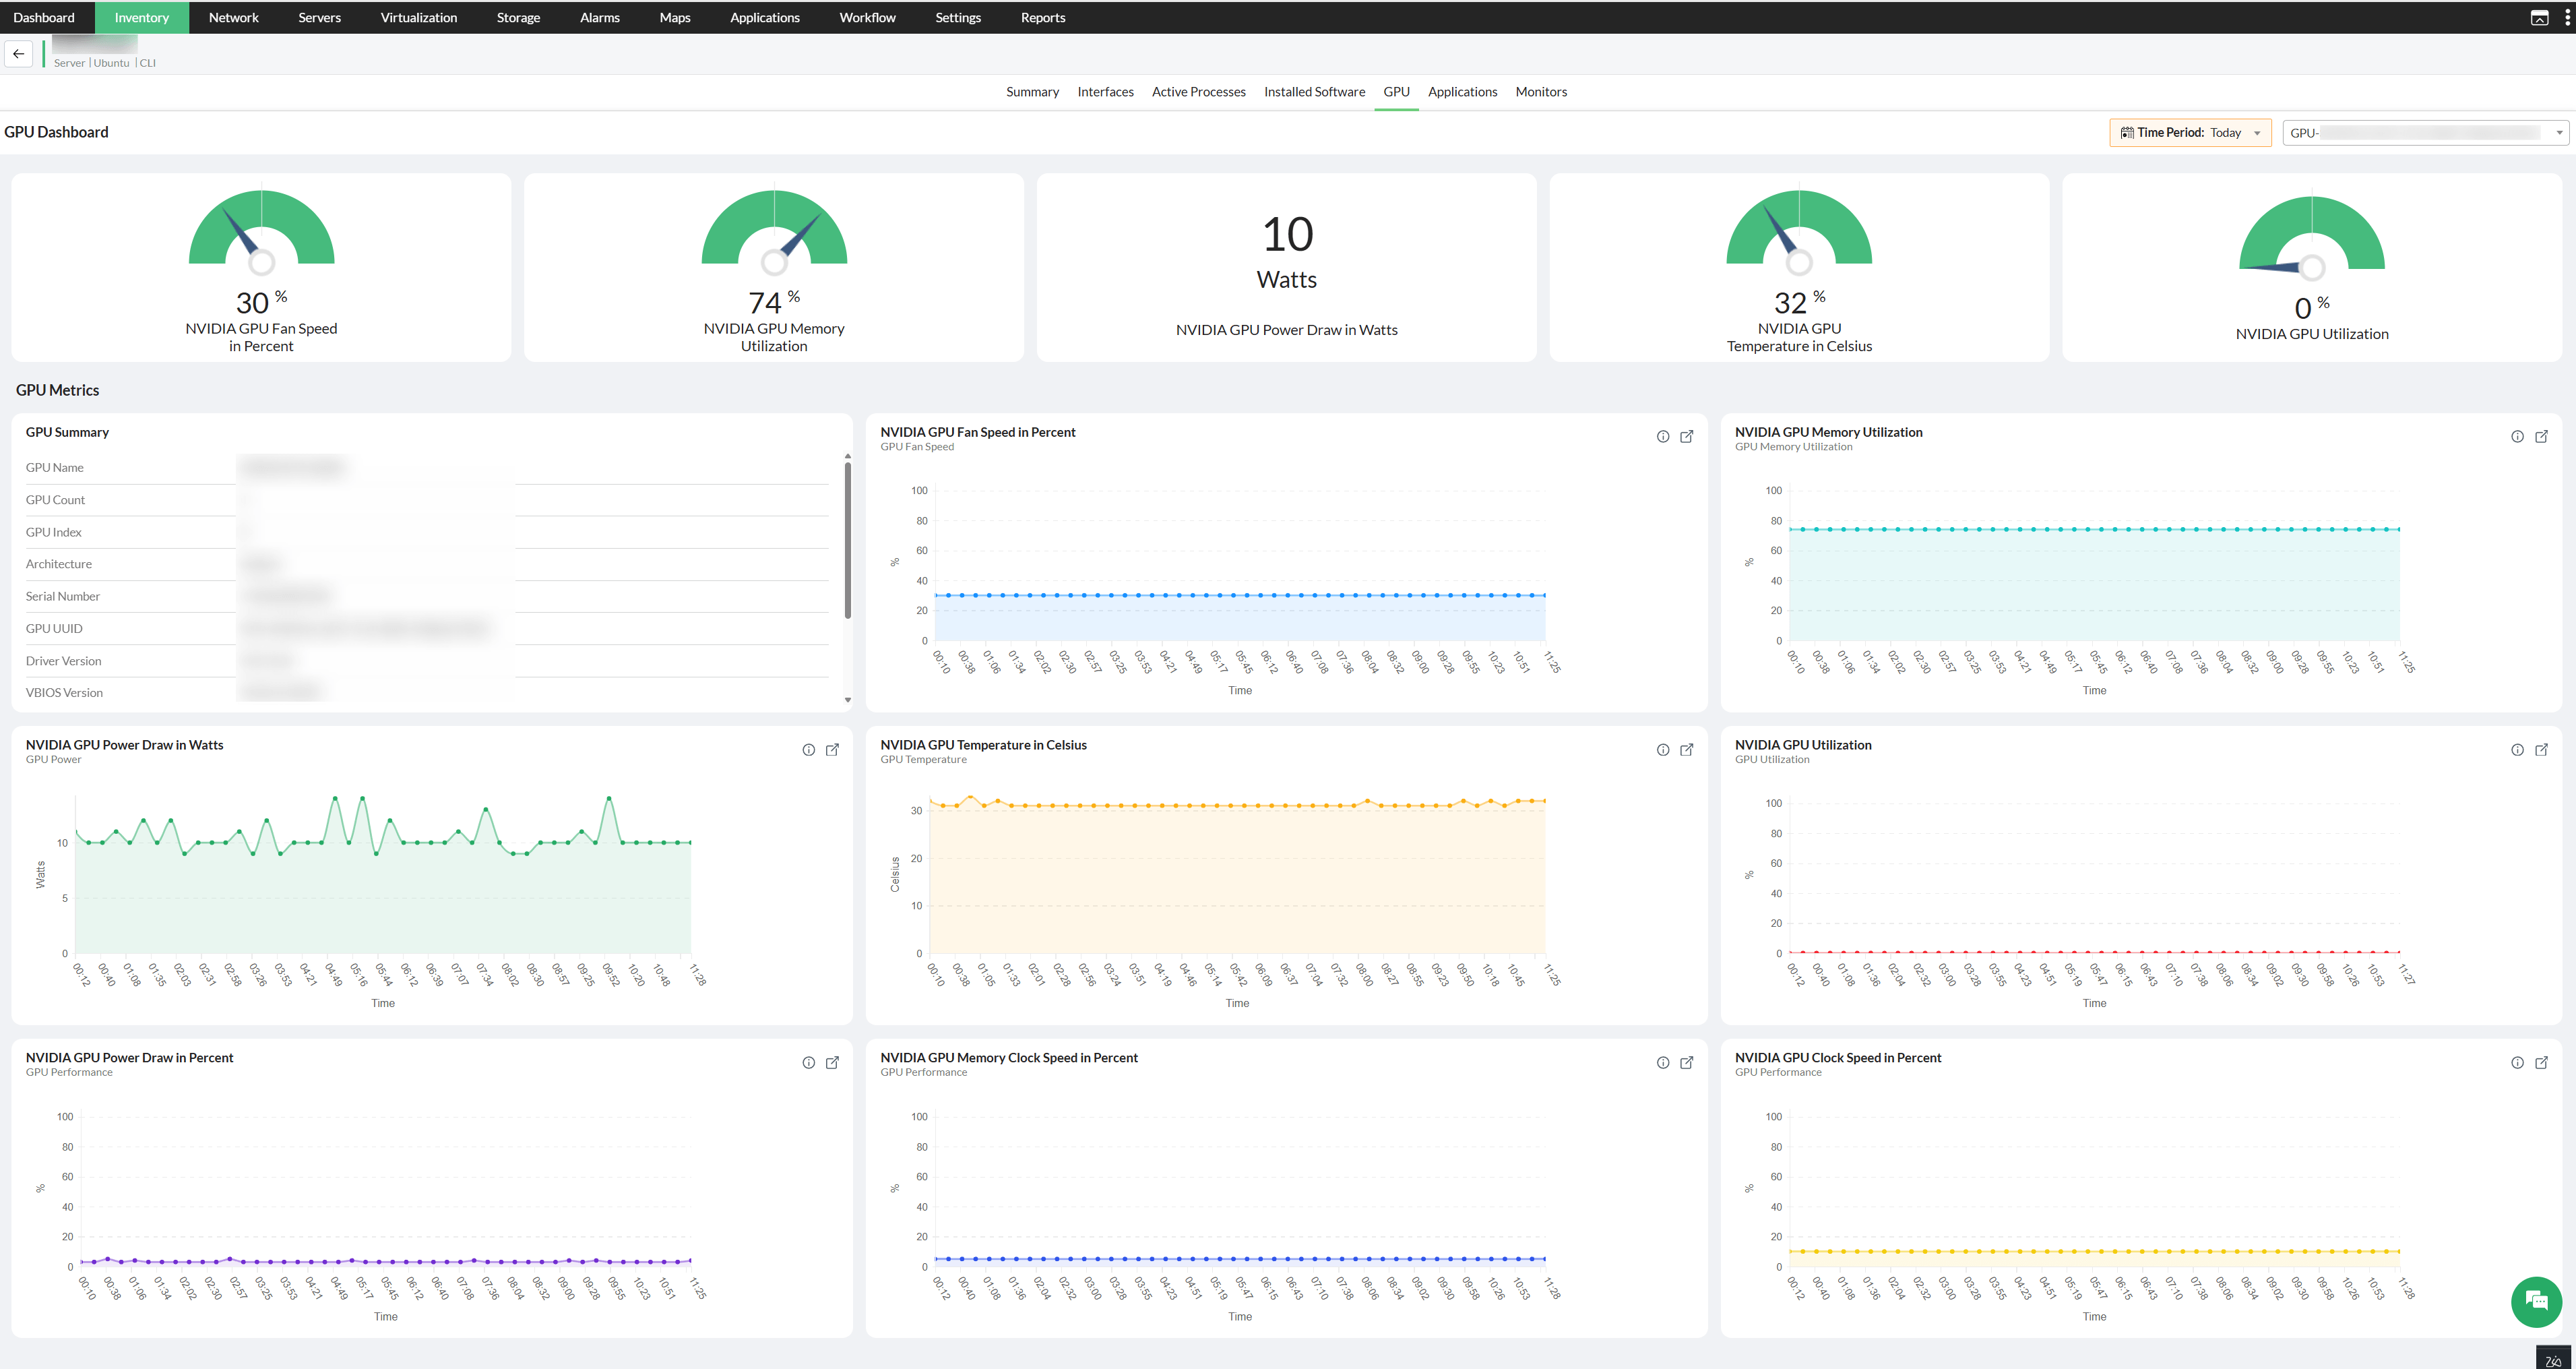
At the top, Gauge Widgets display the latest values for NVIDIA GPU Fan Speed in Percent, NVIDIA GPU Memory Utilization, NVIDIA GPU Power Draw in Watts, NVIDIA GPU Temperature in Celsius, and NVIDIA GPU Utilization. Use the Time Period dropdown to change the duration, and the GPU Instance dropdown on the top right to switch between available GPU instances on the device.
The GPU Metrics section below provides a detailed view of GPU Summary, NVIDIA GPU Fan Speed in Percent, NVIDIA GPU Memory Utilization, NVIDIA GPU Power Draw in Watts, NVIDIA GPU Temperature in Celsius, NVIDIA GPU Utilization, NVIDIA GPU Power Draw in Percent, NVIDIA GPU Memory Clock Speed in Percent, and NVIDIA GPU Clock Speed in Percent.
From Dashboard
GPU utilization data can also be viewed directly from a dashboard using the GPU Summary widget.
- Navigate to Dashboard → Custom Dashboard, or create a new custom dashboard.
- Click Add Widget, and under the Health and Performance category, select GPU Summary – GPU Utilization.
- Add the widget to the dashboard. Hover on the widget to find the Edit option to filter by Category, Group, GPU Metric, Time Period, and Time Window.
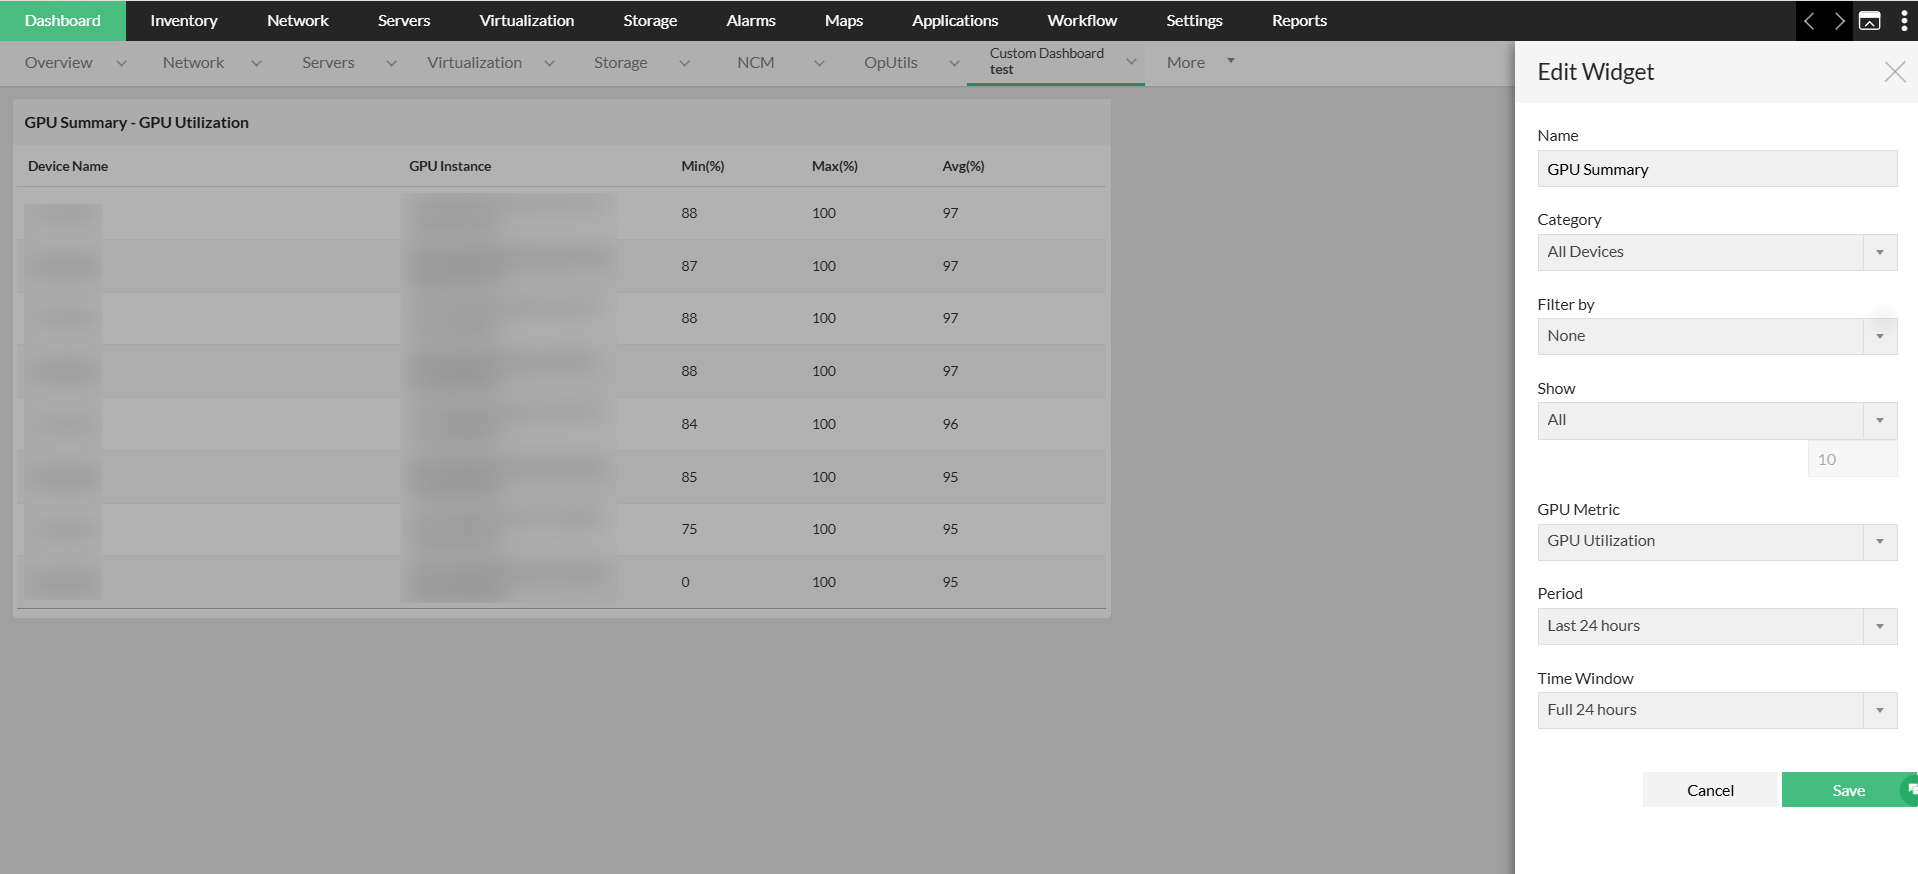
The widget displays a consolidated table of GPU utilization across devices, with columns for Device Name, GPU Instance, Min (%), Max (%), and Avg (%). This allows administrators to compare GPU utilization across multiple devices and GPU instances from a single view, without navigating to individual device snapshot pages.
From Reports
OpManager provides Default Reports and Advanced Reports for GPU monitoring, offering visibility into GPU utilization, memory consumption, temperature, power consumption, and overall health across devices and GPU instances.
To access GPU reports, navigate to Reports → Health and Performance Reports and filter by GPU.
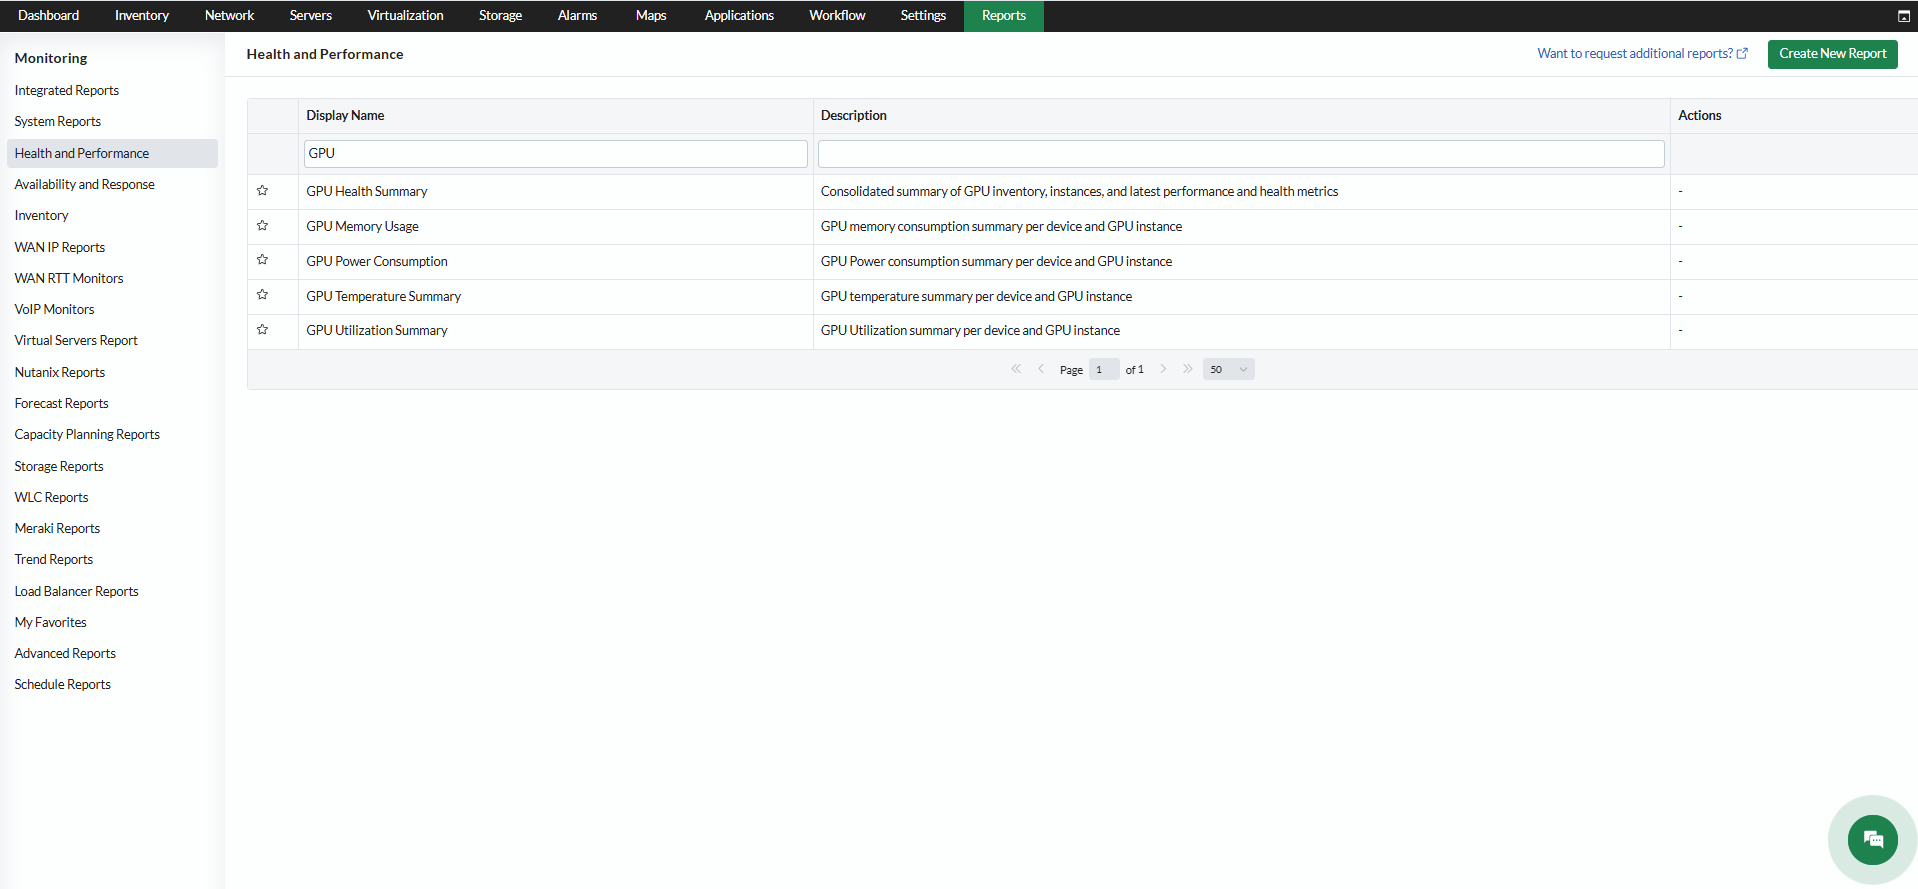
- GPU Health Summary – Provides a consolidated view of GPU inventory, instances, and the latest performance and health metrics, including GPU name, UUID, index, serial number, driver version, architecture, performance state, average utilization, average temperature, average memory utilization, average fan speed, average power draw, and health status.
- GPU Memory Usage – Shows GPU memory consumption per device and GPU instance, with minimum, maximum, and average values.
- GPU Power Consumption – Shows GPU power consumption per device and GPU instance, with minimum, maximum, and average values in watts.
- GPU Temperature Summary – Shows GPU temperature per device and GPU instance, with minimum, maximum, and average values in degrees Celsius.
- GPU Utilization Summary – Shows GPU utilization per device and GPU instance, with minimum, maximum, and average values.
Associating NVIDIA GPU Monitors to Multiple Devices
Performance monitors can be associated to multiple devices in bulk from Settings or through a Device Template. Devices will be associated with the monitors only when the respective CLI credentials are configured for those devices.
Via Settings
- Navigate to Settings → Monitoring → Performance Monitors.
- Click the Associate button at the top right corner of the page.
- In the Associate Monitors panel, locate the Vendors dropdown and select net-snmp. The monitor list refreshes to display monitors available under the net-snmp vendor.
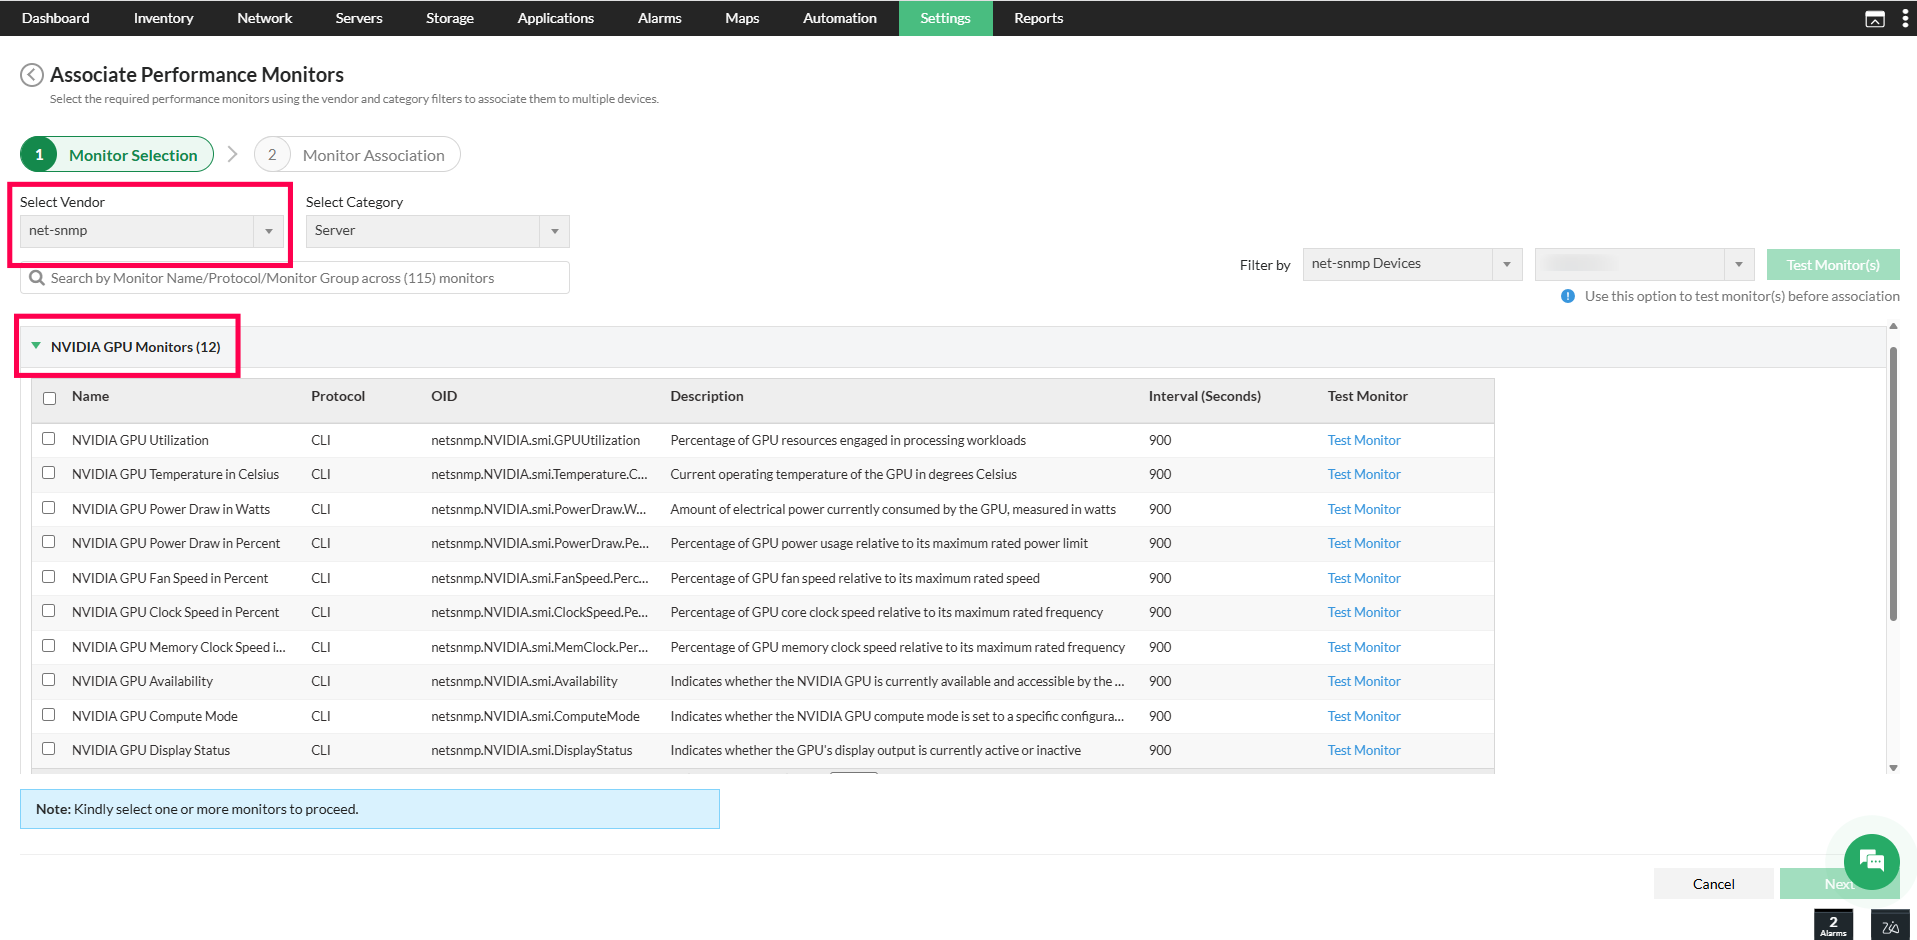
- From the filtered list, select the required monitors from the twelve NVIDIA GPU monitors displayed. To include all 12, select the checkbox at the top of the list and click Next.
- In the Monitor Association panel, browse the available devices and select the devices requiring GPU monitors, and move them to the Selected Devices section.
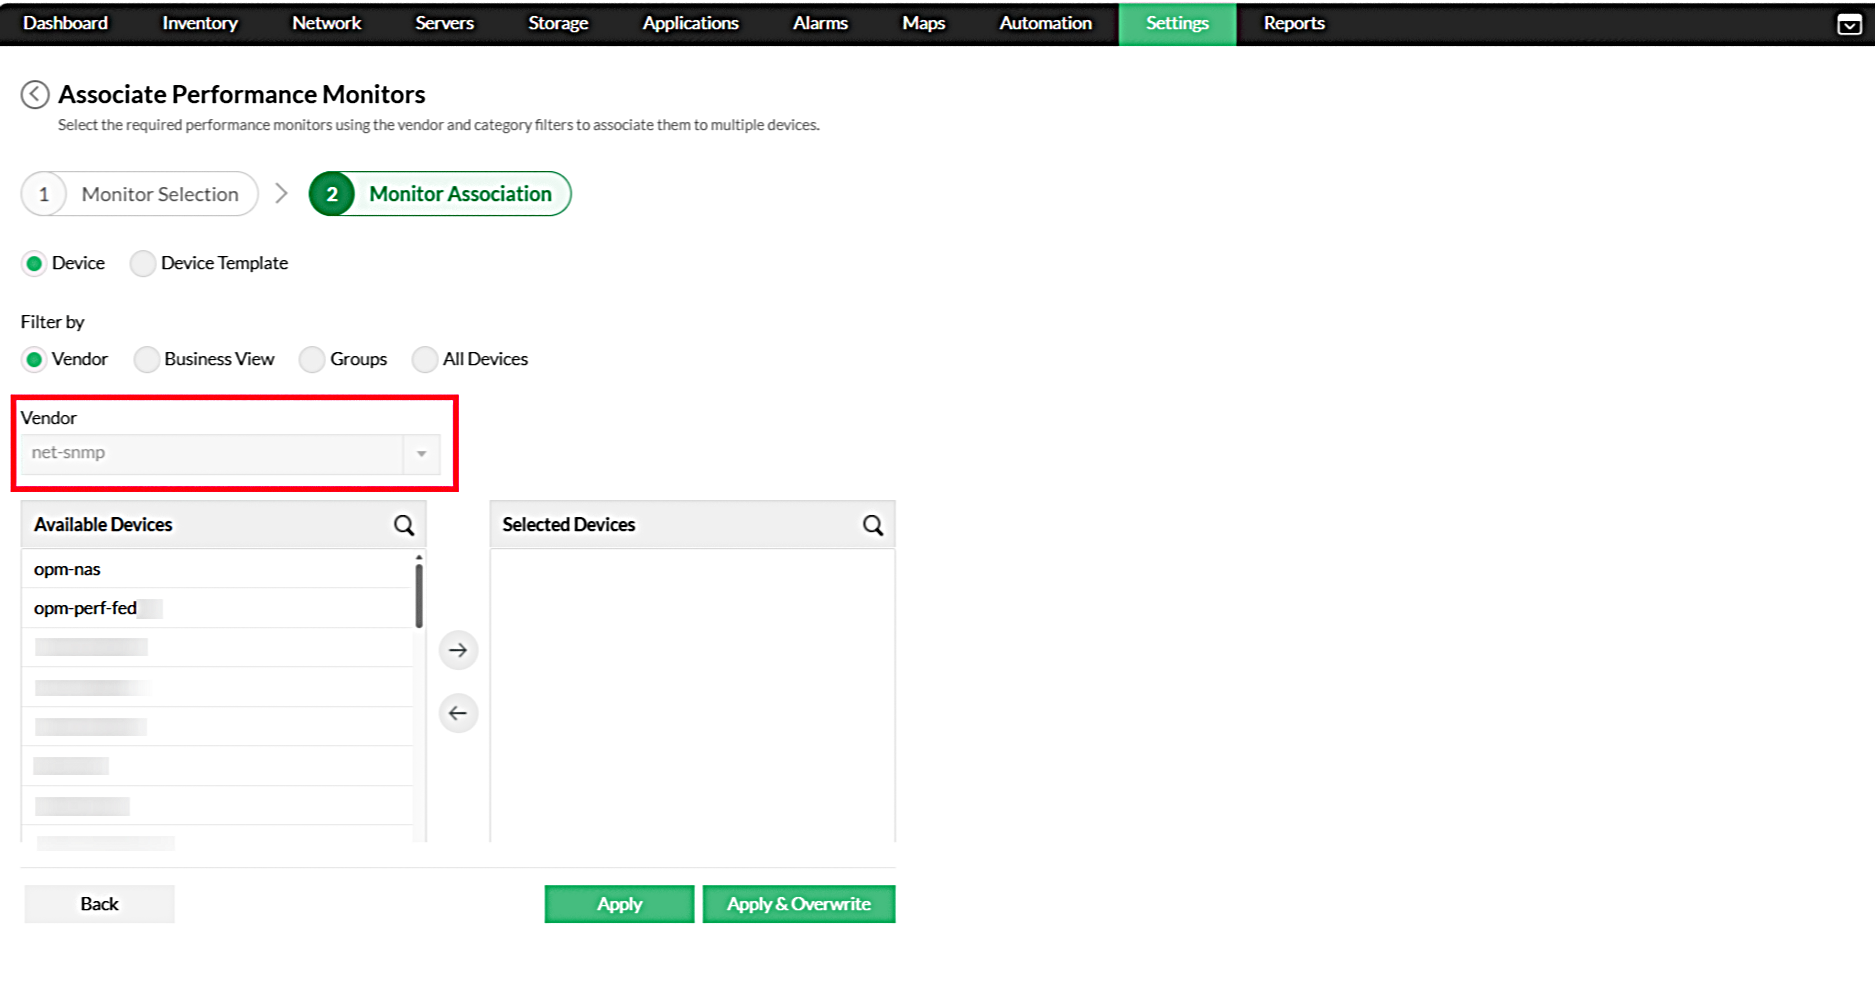
- Click Apply to save the configuration.
Associating NVIDIA GPU monitors to devices through Settings in OpManager enables continuous performance tracking across GPU-enabled hosts from a single configuration point. Once associated, the collected metrics are available on the Device Snapshot page, where thresholds can be configured per device, or at the Settings level to apply uniform threshold values across multiple devices simultaneously.
Via Device Template
Device templates allow GPU monitors to be pre-configured for a specific device type, so that the monitors are automatically associated during discovery without any manual steps per device.
- Navigate to Settings → Configuration → Device Templates.
- Select the relevant template, or create a new one for the target device type.
- Under Associated Monitors, click Add and select the required NVIDIA GPU monitors from the list.
- Save the template.
Once configured, the selected monitors will be automatically associated to all devices that match the template during discovery. This is particularly useful when managing a large number of GPU-enabled hosts of the same type, as it eliminates the need to associate monitors individually after each discovery.
Supported NVIDIA GPU Monitors for Linux
| Category | Monitor | Description |
|---|---|---|
| GPU Performance | NVIDIA GPU Utilization | Percentage of GPU resources engaged in processing workloads |
| NVIDIA GPU Memory Utilization | Percentage of the total GPU memory (VRAM) that is actively allocated and being used by running applications and processes | |
| NVIDIA GPU Clock Speed in Percent | Percentage of GPU core clock speed relative to its maximum rated frequency | |
| NVIDIA GPU Memory Clock Speed in Percent | Percentage of GPU memory clock speed relative to its maximum rated frequency | |
| GPU Status | NVIDIA GPU Availability | Indicates whether the NVIDIA GPU is currently available and accessible by the system |
| NVIDIA GPU Compute Mode | Indicates whether the NVIDIA GPU compute mode is set to a specific configuration | |
| NVIDIA GPU Display Status | Indicates whether the GPU's display output is currently active or inactive | |
| NVIDIA GPU Persistence Mode | Indicates whether NVIDIA GPU Persistence Mode is enabled, allowing the GPU to remain initialized between sessions and reducing initialization delay | |
| GPU Power / Thermal Management | NVIDIA GPU Temperature in Celsius | Current operating temperature of the GPU in degrees Celsius |
| NVIDIA GPU Power Draw in Watts | Amount of electrical power currently consumed by the GPU, measured in watts | |
| NVIDIA GPU Power Draw in Percent | Percentage of GPU power usage relative to its maximum rated power limit | |
| NVIDIA GPU Fan Speed in Percent | Percentage of GPU fan speed relative to its maximum rated speed |