Amazon Analytics Services Monitoring
Amazon Analytics Services are designed for data processing, querying, visualization, and machine learning integration to handle big data workloads efficiently. Monitoring these services ensures performance, cost control, and reliability for data-intensive workloads like those in IT infrastructure analytics.
Applications Manager can help you monitor:
- AWS AppSync
- Amazon Elastic MapReduce (EMR)
- AWS Glue Crawlers
- AWS Glue Jobs
- Amazon Kinesis Video Streams
- Amazon MSK clusters
- Amazon OpenSearch
- Amazon Redshift
AWS AppSync monitoring
AWS AppSync is a fully managed service for building GraphQL and Pub/Sub APIs that connect applications to data sources such as Amazon DynamoDB, AWS Lambda, and HTTP endpoints. Monitoring AppSync helps you maintain reliable API requests, real-time subscriptions, and data access across your applications.
Applications Manager provides visibility into the performance, reliability, and configuration of your AppSync GraphQL APIs. With Applications Manager's AWS AppSync monitor, you can:
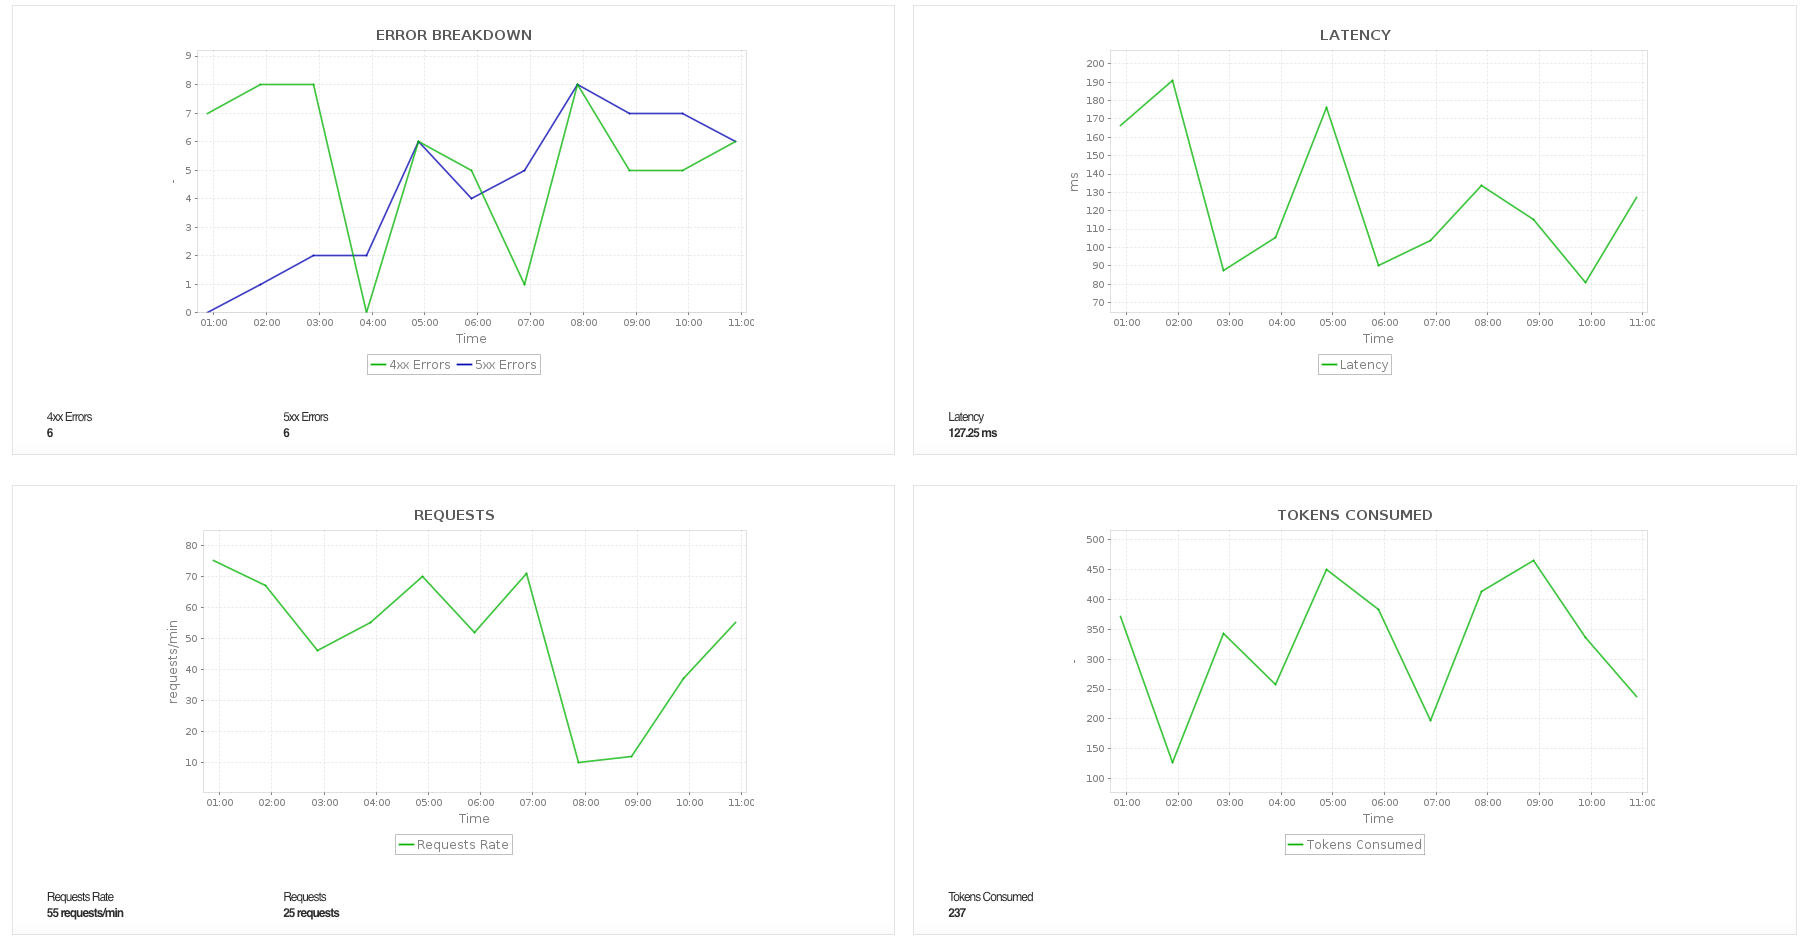
- Track GraphQL API details and request performance, including 4xx and 5xx errors, latency, request rate, request count, and tokens consumed.
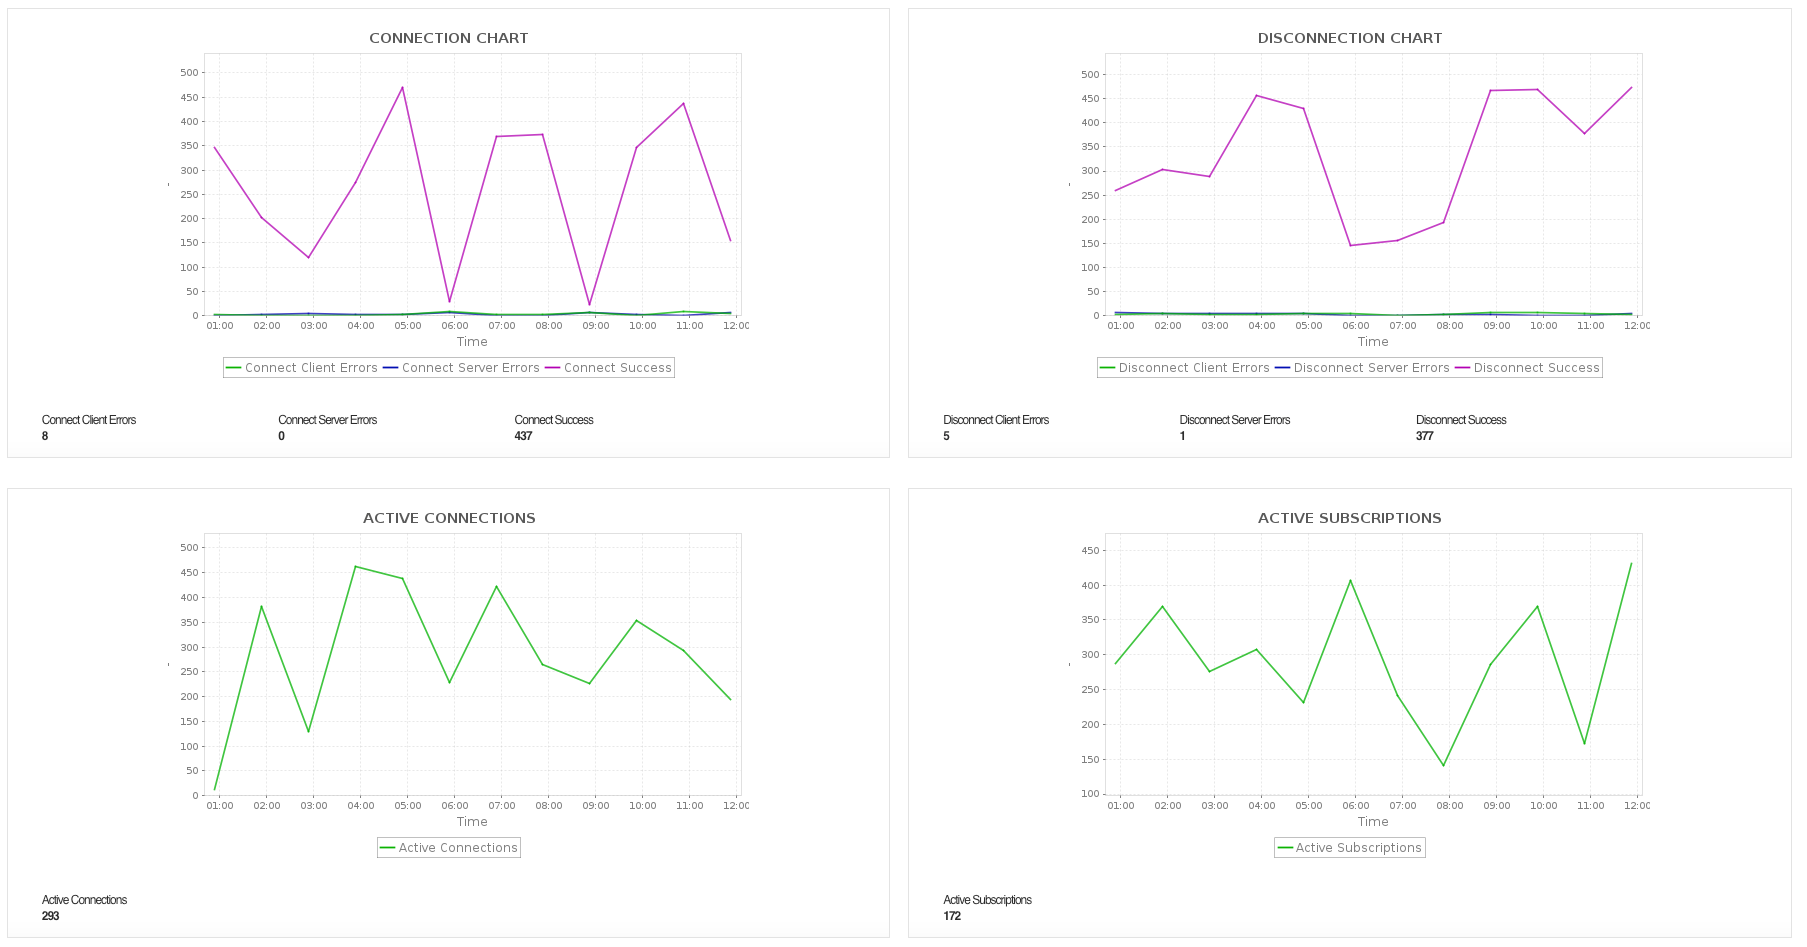
- Monitor WebSocket connection and subscription activity through connect and disconnect success or error counts, active connections, active subscriptions, connection duration, and subscribe or unsubscribe activity.
- Review message and invalidation activity, including inbound message errors, failures, delays, and drops, outbound messages, published data message size, and invalidation request results.
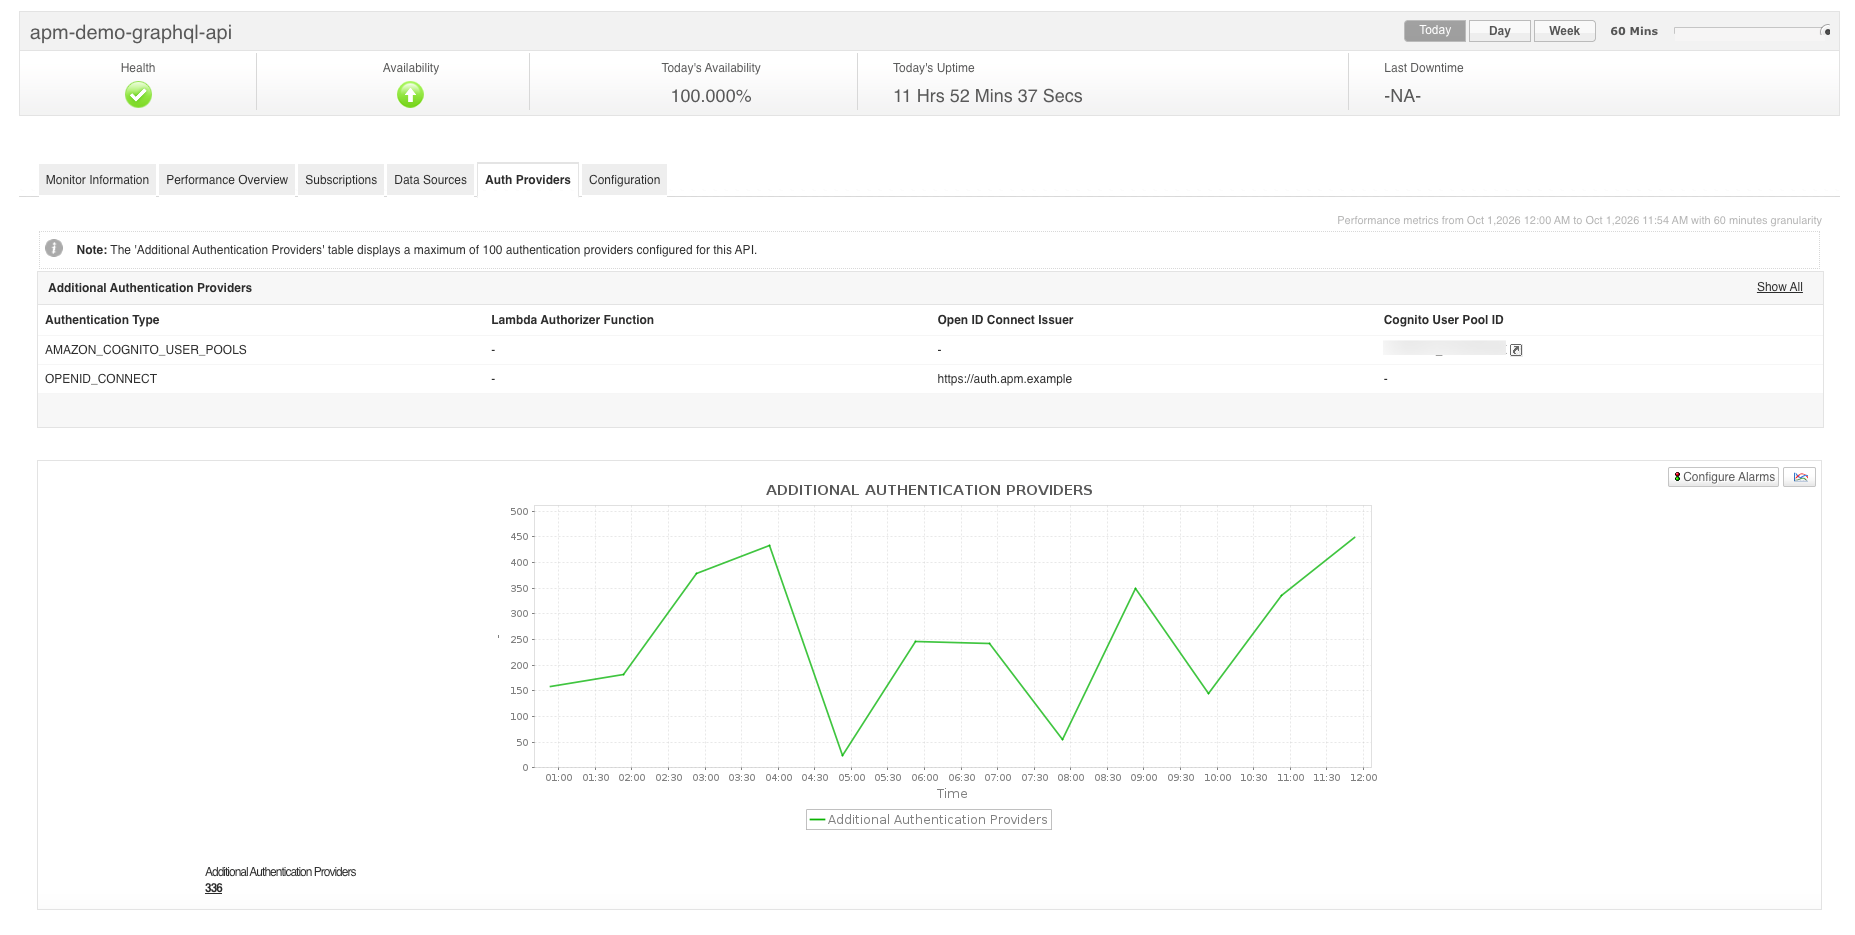
- View data source and additional authentication provider details, including data source type, service role, authentication type, Lambda authorizer, OpenID Connect issuer, and Amazon Cognito user pool.
- Review API, logging, enhanced metrics, and cache configuration for cache-enabled APIs, including API visibility, encryption, query and resolver limits, log settings, cache status, cache type, and cache TTL.
AWS Elastic MapReduce (EMR) monitoring
Amazon Elastic MapReduce (EMR) is a managed big data platform that runs frameworks such as Apache Hadoop, Spark, Hive, and Presto on scalable Amazon EC2 clusters. Monitoring EMR helps you identify cluster capacity pressure, unhealthy nodes, failed processing steps, and data processing bottlenecks.
Applications Manager provides visibility into the health, capacity, workloads, and configuration of your EMR clusters. With Applications Manager's Amazon Elastic MapReduce (EMR) monitor, you can:
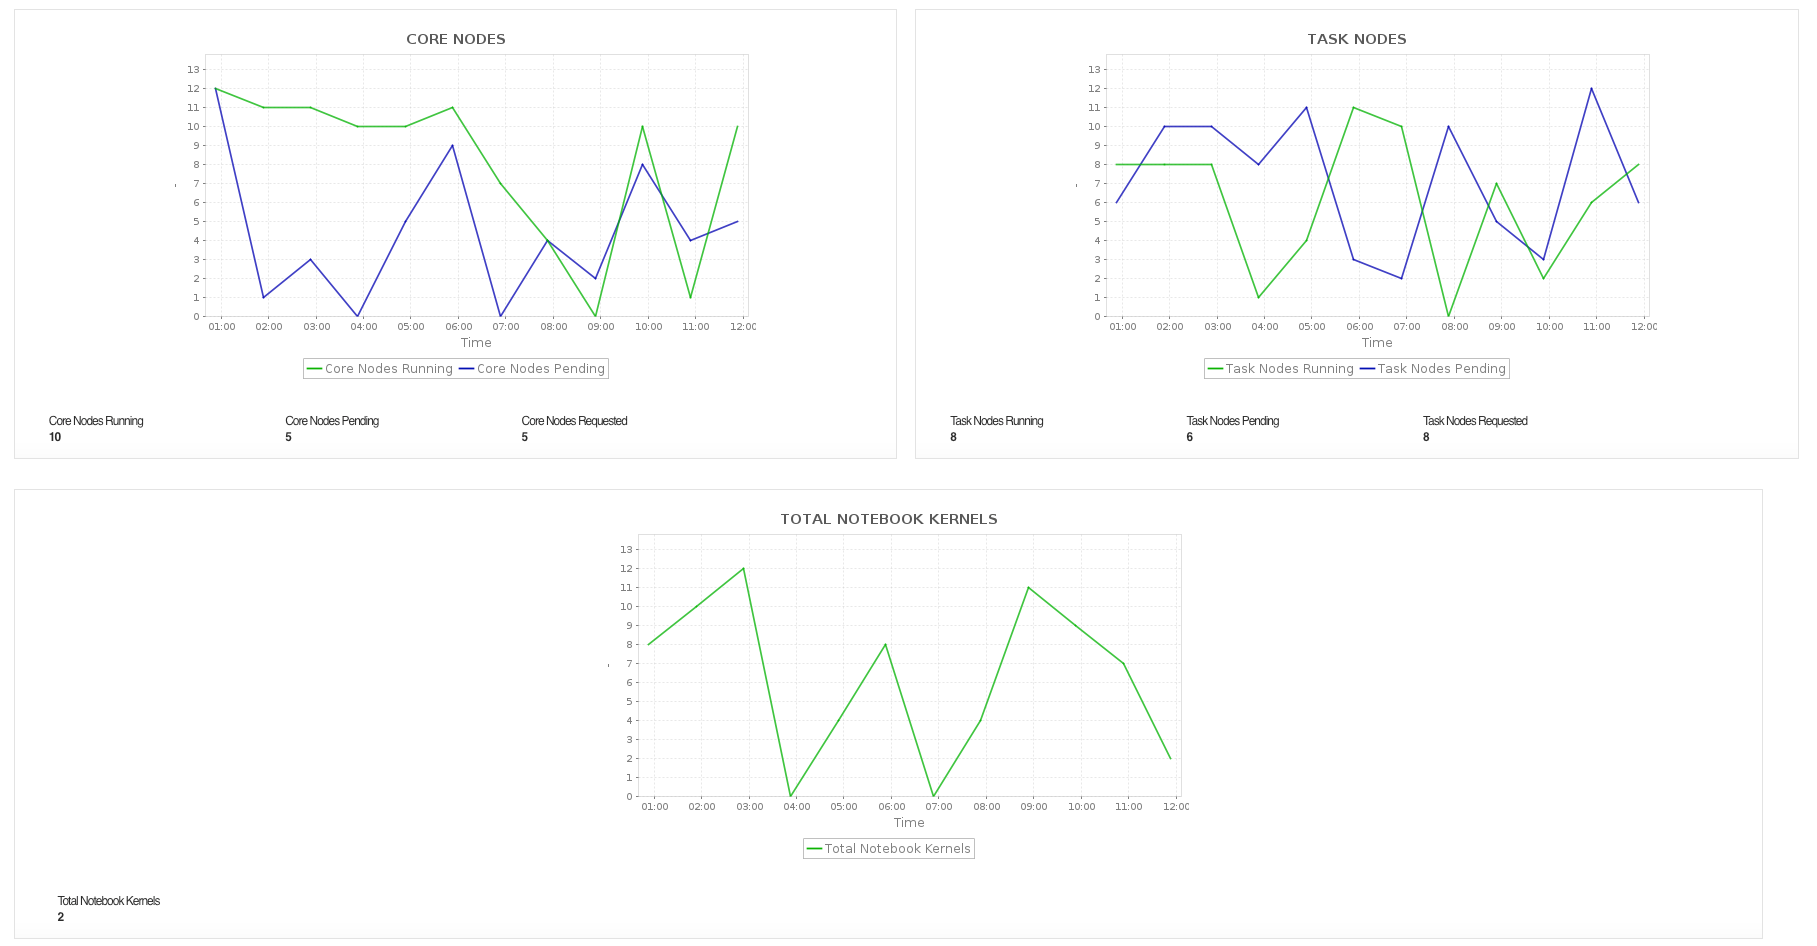
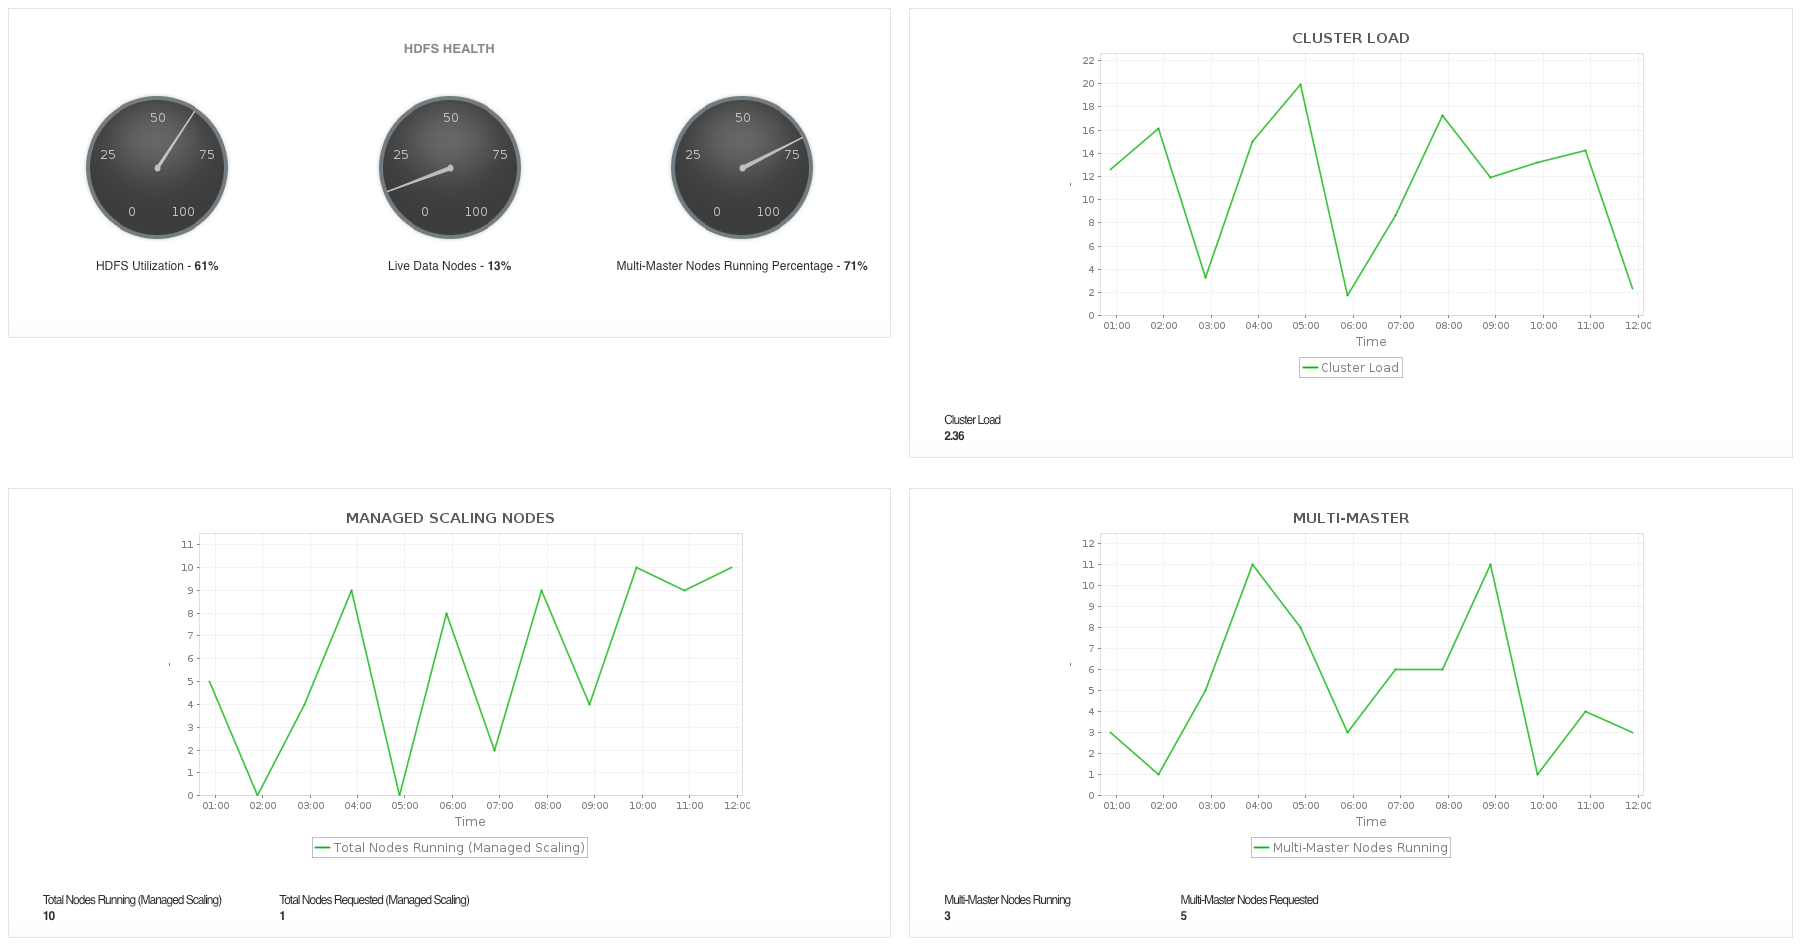
- Track cluster state, state change details, idle and auto-termination status, remaining capacity, core and task node counts, managed scaling, multi-master nodes, and notebook kernels.
- Monitor HDFS health and data movement through HDFS utilization, live data nodes, corrupt or missing blocks, under-replicated blocks, cluster load, HDFS data read and write, and Amazon S3 data read and write metrics.
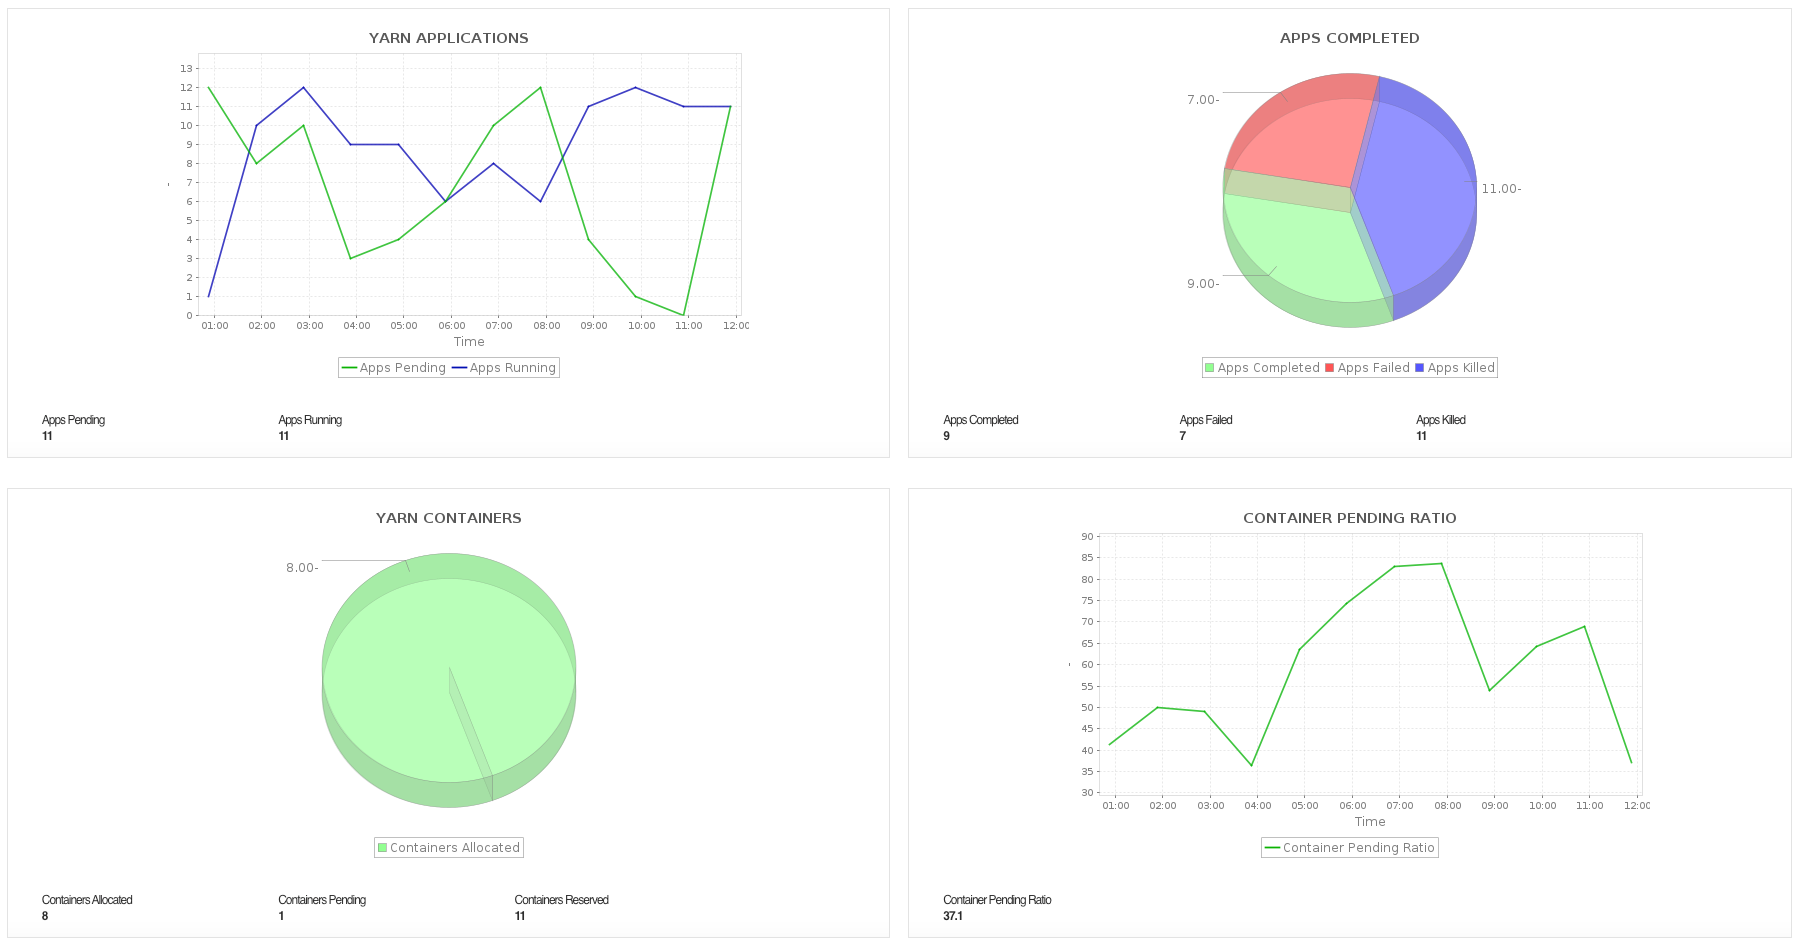
- Review HBase backup status and duration, Hadoop job activity, task tracker health, map and reduce slots and tasks, YARN applications, containers, pending ratios, and memory availability.
- Inspect critical EMR steps and instances, including step state, duration, failure reason, EC2 instance type, instance state, network details, and purchasing option.
- Review cluster and security configuration, including release and application versions, auto-termination, scaling and concurrency settings, IAM roles, security groups, subnets, availability zones, AMI details, and log location.
AWS Glue Crawler monitoring
AWS Glue Crawlers automatically scan your data sources, infer schemas, and populate the AWS Glue Data Catalog, making reliable crawler operation critical for accurate downstream ETL and analytics workflows. Monitoring crawlers helps you catch failed or stalled crawls, catalog inconsistencies, and unusually long runtimes before they delay data availability for reporting and analytics.
Applications Manager tracks the health and performance of your Glue Crawlers with detailed visibility into recent crawl activity and catalog changes. With Applications Manager's AWS Glue Crawler monitor, you can:
- Monitor the last crawl status, start time, and crawl error message, along with failed and stopped run percentages, to quickly spot crawls that failed or were interrupted.
- Track table activity metrics, such as created, updated, and deleted tables, to understand how frequently your Glue Data Catalog is changing.
- Keep an eye on runtime metrics, including last runtime, median runtime, and estimated remaining time for active crawls, to detect performance degradation early.
- Review run state distribution metrics, such as failed, stopped, completed, and total runs, to gauge overall crawler reliability over time.
- Drill down into individual crawl executions, classifiers, and crawler data source targets for granular troubleshooting.


AWS Glue Job monitoring
AWS Glue Jobs run the ETL scripts that extract, transform, and load data across your pipelines, so job failures or slowdowns can directly delay analytics and downstream reporting. Monitoring Glue Jobs helps you identify resource bottlenecks, failed or timed-out runs, and data movement issues before they affect your ETL workflows.
Applications Manager provides executor-level visibility into your Glue Job runs to help you pinpoint performance issues quickly. With Applications Manager's AWS Glue Job monitor, you can:
- Track system load and JVM heap usage across executors and the driver node to identify resource contention affecting job performance.
- Monitor ETL data movement metrics, such as S3 data read/write rates and shuffle data read/write rates across executors, to understand data throughput and inter-executor transfer overhead.
- Keep tabs on task activity, including failed, killed, and completed tasks and stages, along with data and record read rates, to catch processing issues early.
- Review job run state distribution and job run percentages, covering completed, failed, waiting, canceled, error, and timeout runs, to assess overall job reliability.
- Analyze individual job run details, triggers, and job configuration, including worker type, DPU allocation, and retry settings, for deeper troubleshooting and capacity planning.


AWS Kinesis Video Streams monitoring
Amazon Kinesis Video Streams securely ingests, stores, and indexes video, audio, and other time-encoded data from connected devices for playback, analytics, and machine learning. Monitoring Kinesis Video Streams helps you detect ingestion failures, playback latency, connection errors, and clip export issues across video pipelines.
Applications Manager provides visibility into stream health, media ingestion, playback, and export activity. With Applications Manager's Amazon Kinesis Video Streams monitor, you can:
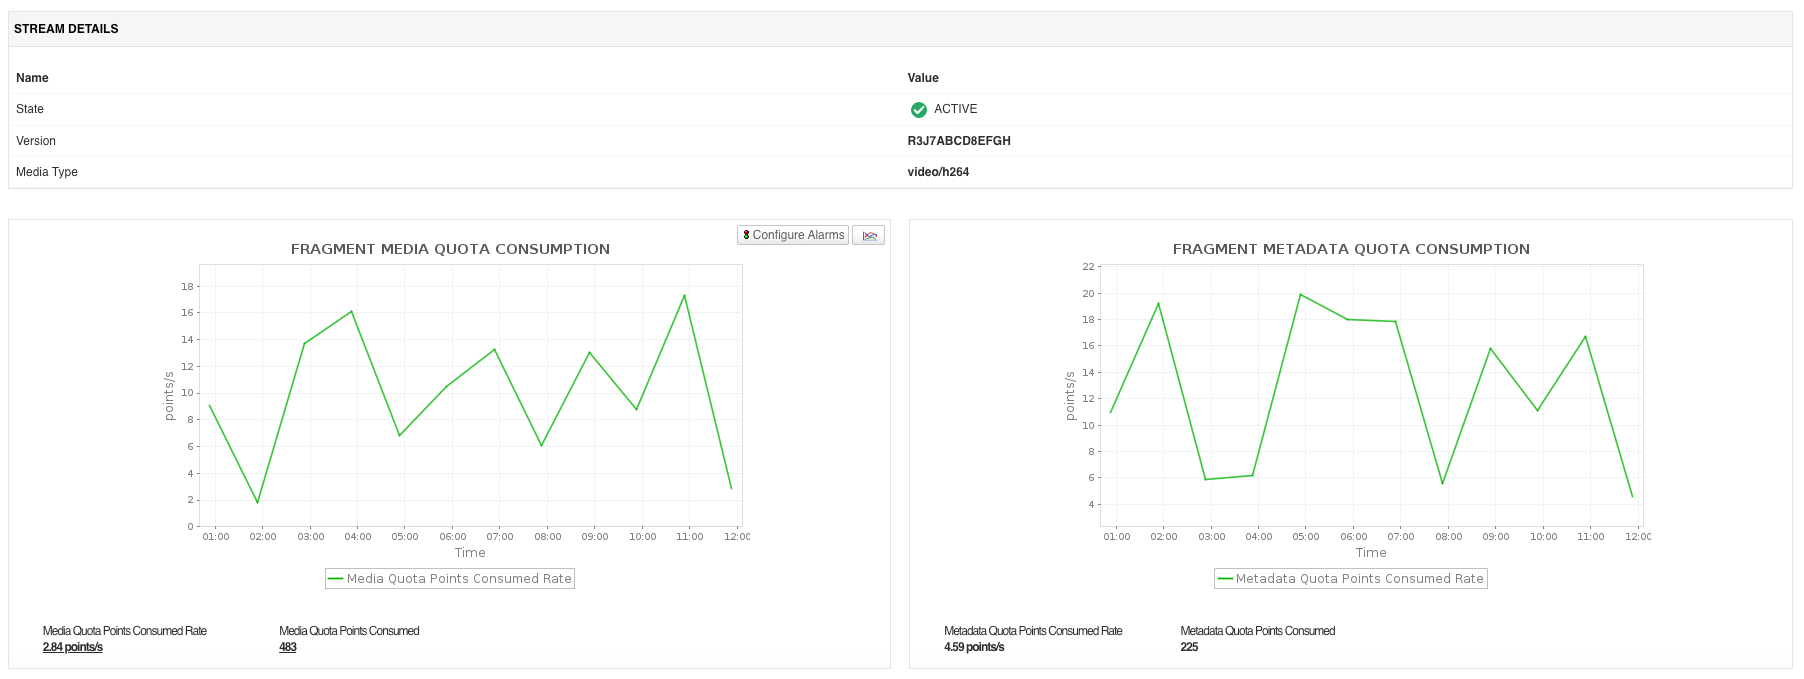
- Monitor stream state, version, media type, and fragment media or metadata quota consumption.
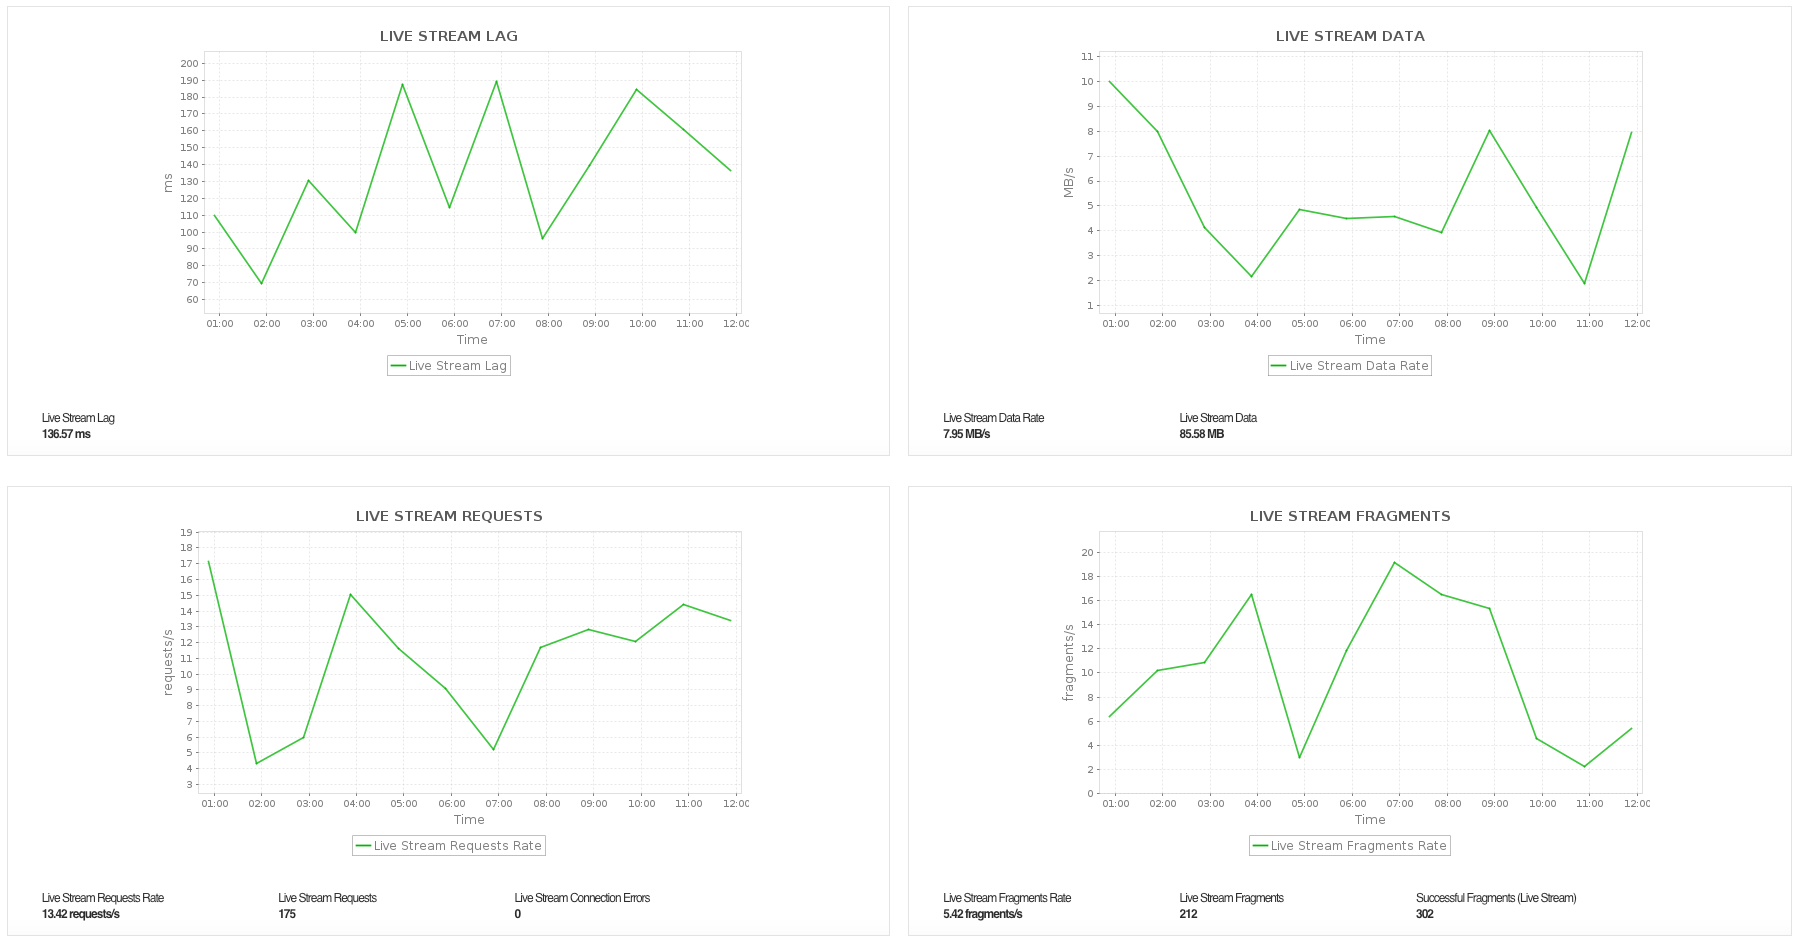
- Track media ingestion latency, active connections, connection errors, data and request rates, fragment and frame counts, successful fragments, error acknowledgments, and buffering, received, and persisted acknowledgment latency.
- Monitor live and archived media playback through stream lag, data and request rates, connection errors, fragment and frame activity, fragment listing latency, and archived media transfer metrics.
- Track HLS, MP4, TS, and DASH playback latency, session or playlist requests, media or fragment data, and successful playback requests.
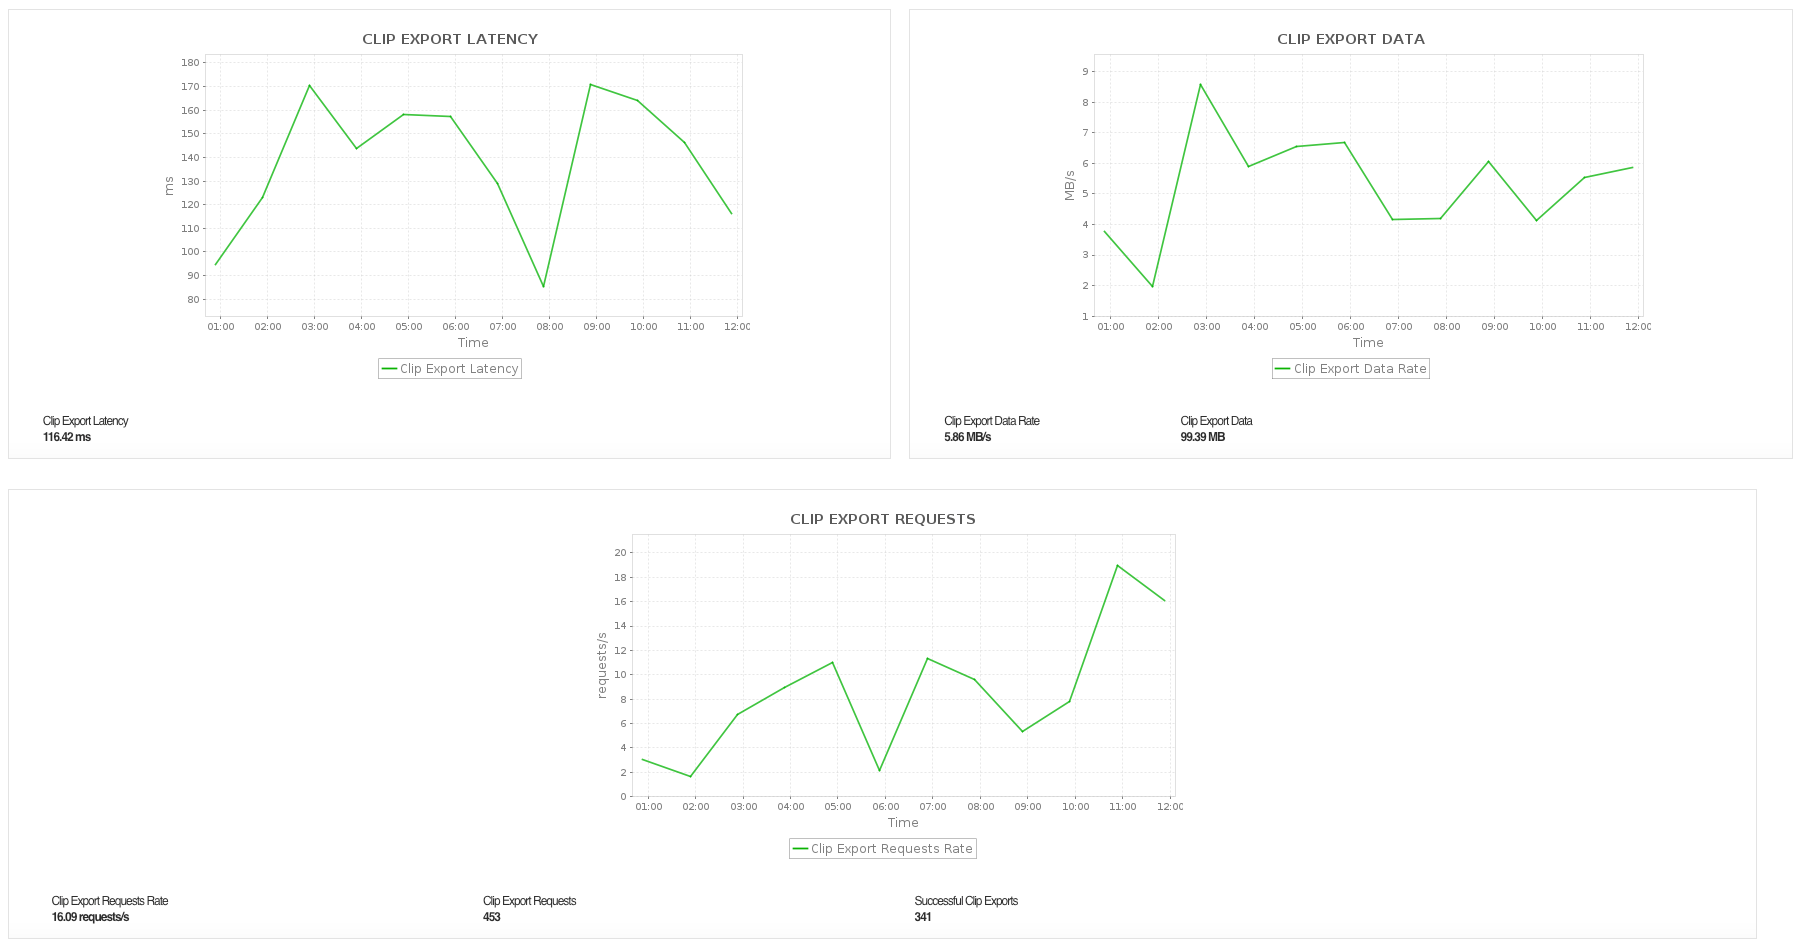
- Monitor clip export latency, data transfer, request counts, and successful exports, along with retention period, device, KMS key, and stream creation details.
Amazon MSK cluster monitoring
Amazon MSK clusters require monitoring to ensure high availability, performance, and reliability in streaming data workloads. Proactive monitoring helps you detect issues like high latency, broker failures, or resource exhaustion before they impact your applications. You can address key operational challenges like unexpected scaling limitations, maintenance disruptions, and hidden costs in production environments.
Applications Manager gives visibility into cluster health, enabling quick identification of potential performance bottlenecks and operational anomalies.
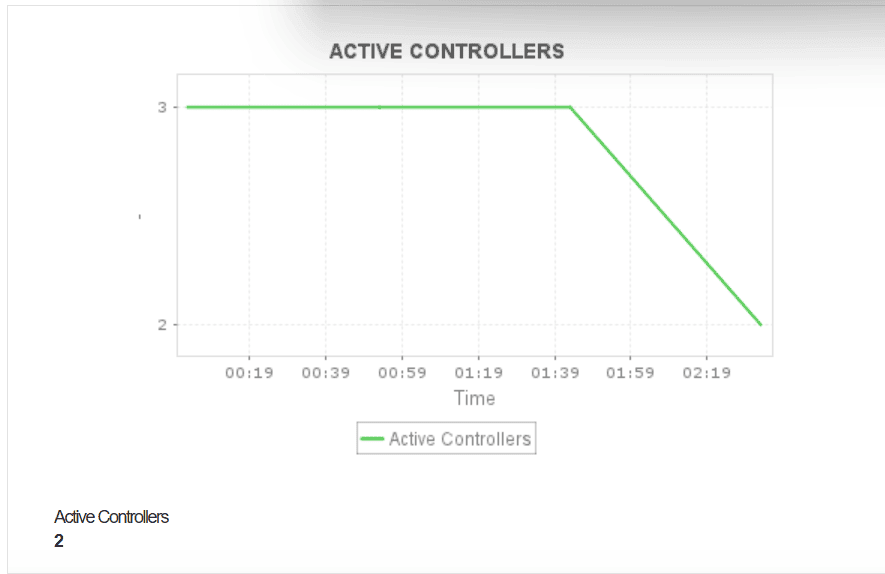
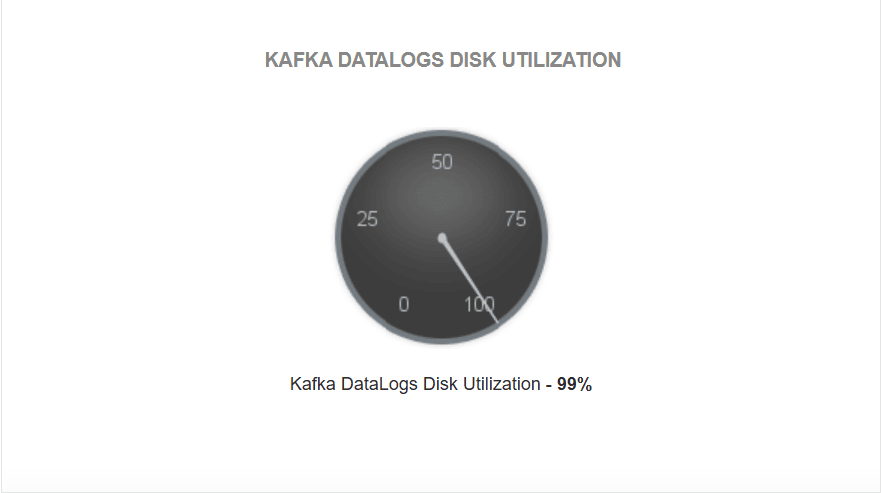
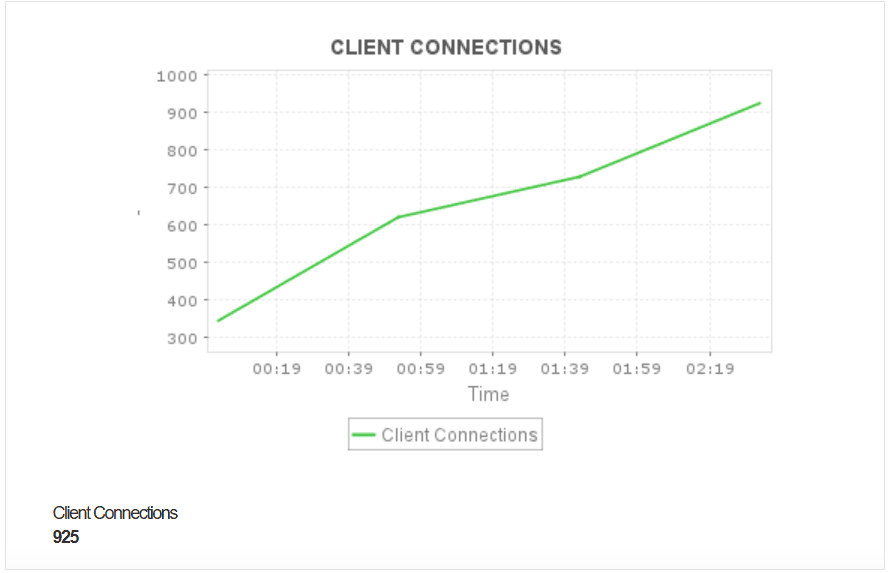
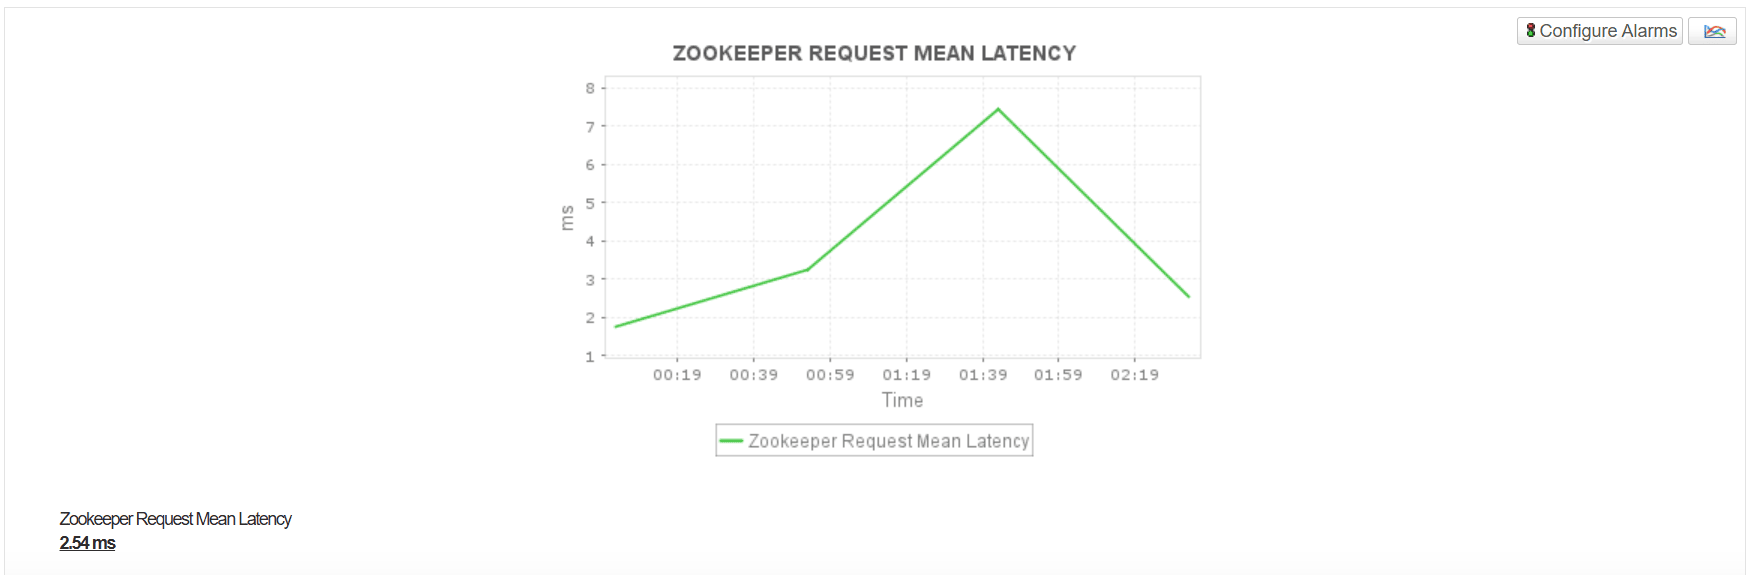
- Track overall cluster availability and operational state with metrics such as cluster state, number of brokers, active controllers, zookeeper session state, etc. Monitor key resource utilization metrics including Kafka Datalogs Disk Utilization, Express Storage Utilization, and ZooKeeper Request Mean Latency to track high performance storage usage, support effective capacity planning, and prevent storage related performance issues.
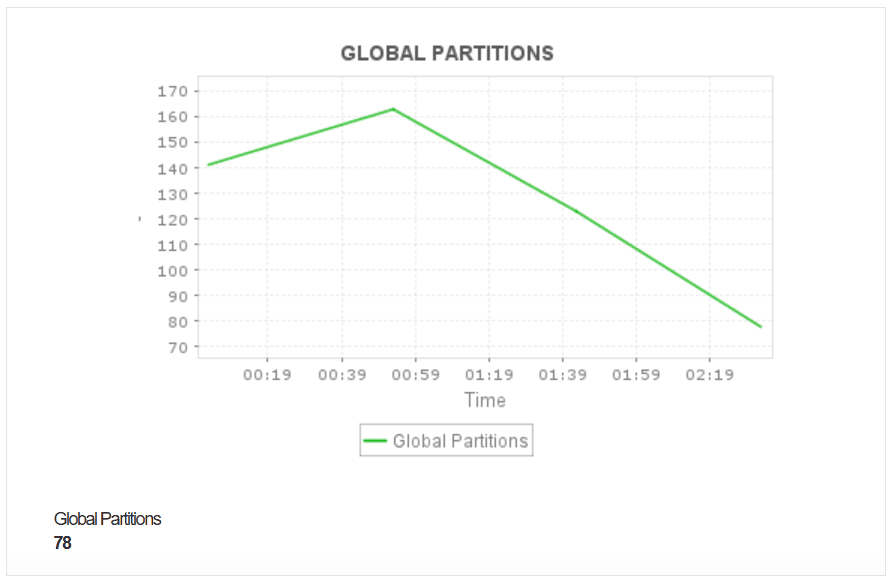
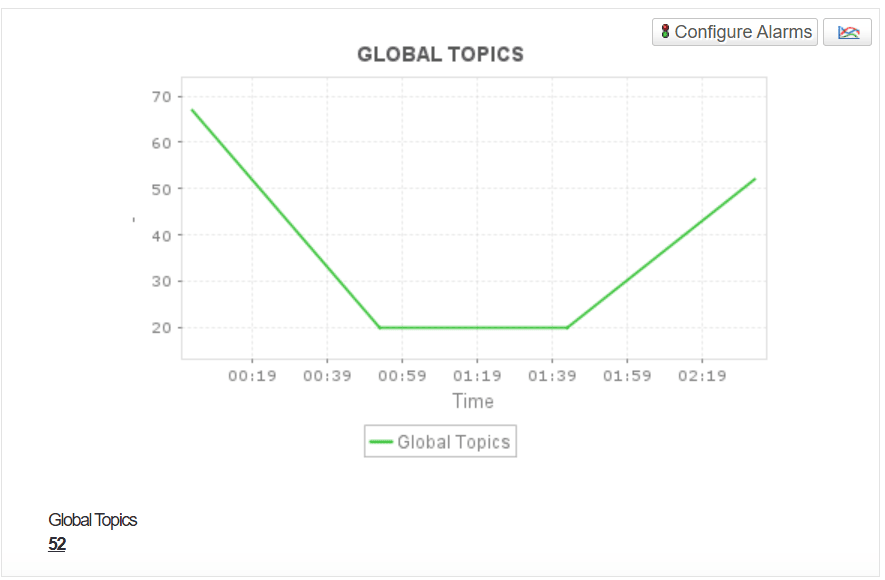
- Keep tabs on data and partition metrics to assess data integrity and distribution. These metrics include offline partitions, global partitions, and global topics.
- Track configuration attributes including security, storage, network configuration to ensure optimal performance, compliance, and early detection of misconfigurations that could lead to instability or inefficiencies.
Amazon OpenSearch monitoring
Amazon OpenSearch Service provides managed clusters for log analytics, application search, and observability workloads. Monitoring OpenSearch helps you maintain cluster health, search and indexing performance, storage capacity, and the availability of advanced cluster features.
Applications Manager provides visibility into OpenSearch cluster, node, domain, and workload performance. With Applications Manager's Amazon OpenSearch monitor, you can:
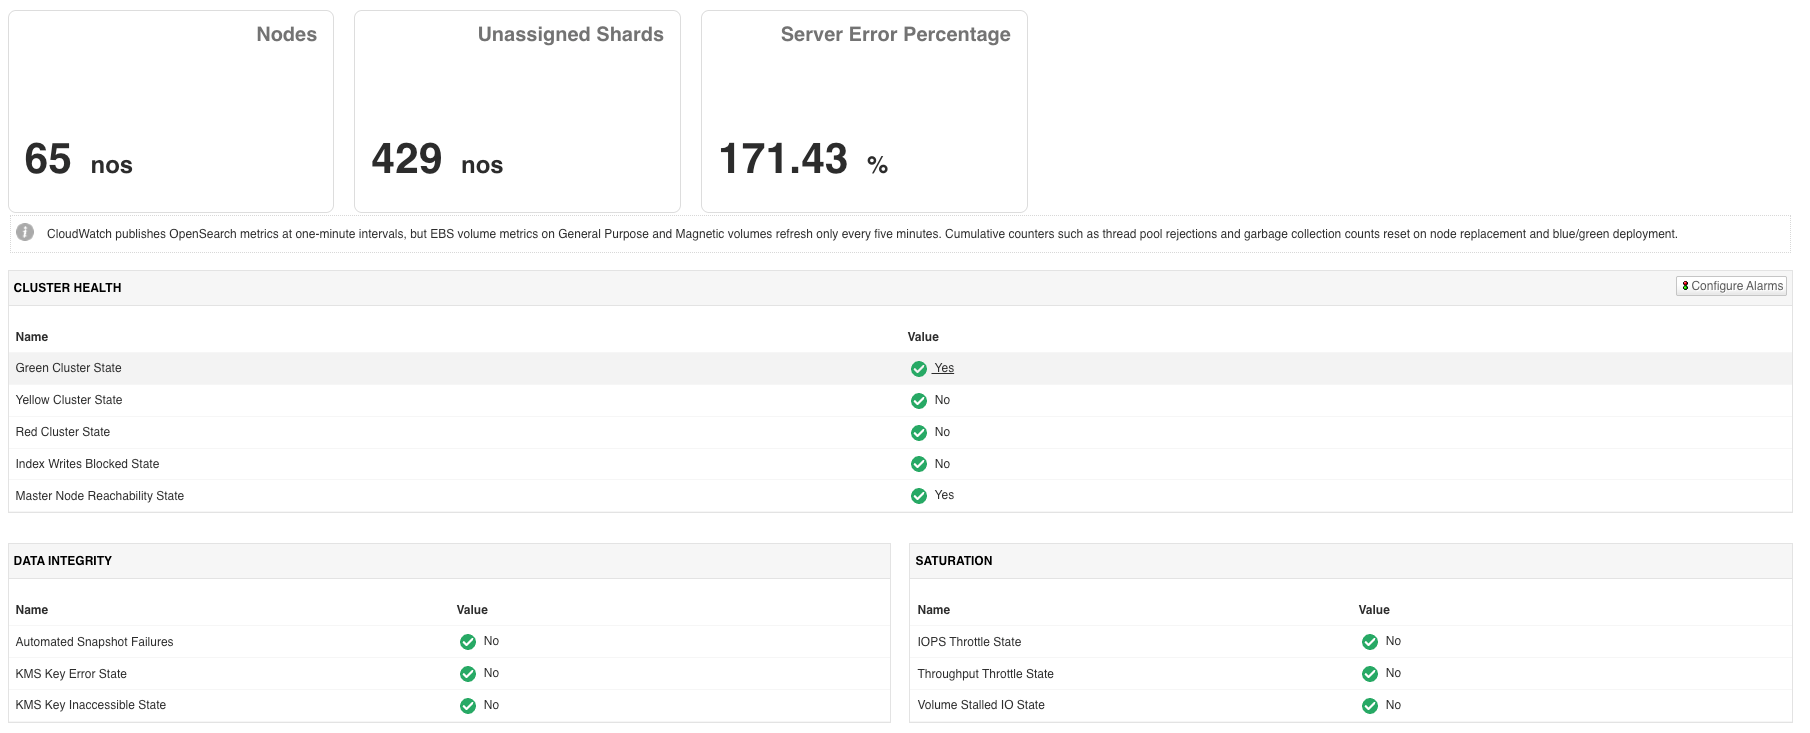
- Track cluster health and data integrity through cluster state, blocked writes, master node reachability, automated snapshot failures, KMS key status, IOPS and throughput throttling, and stalled volume I/O.
- Monitor resource and storage utilization, including CPU, JVM and system memory, cluster storage, node count, unassigned shards, dedicated master node health, and OpenSearch request volume.
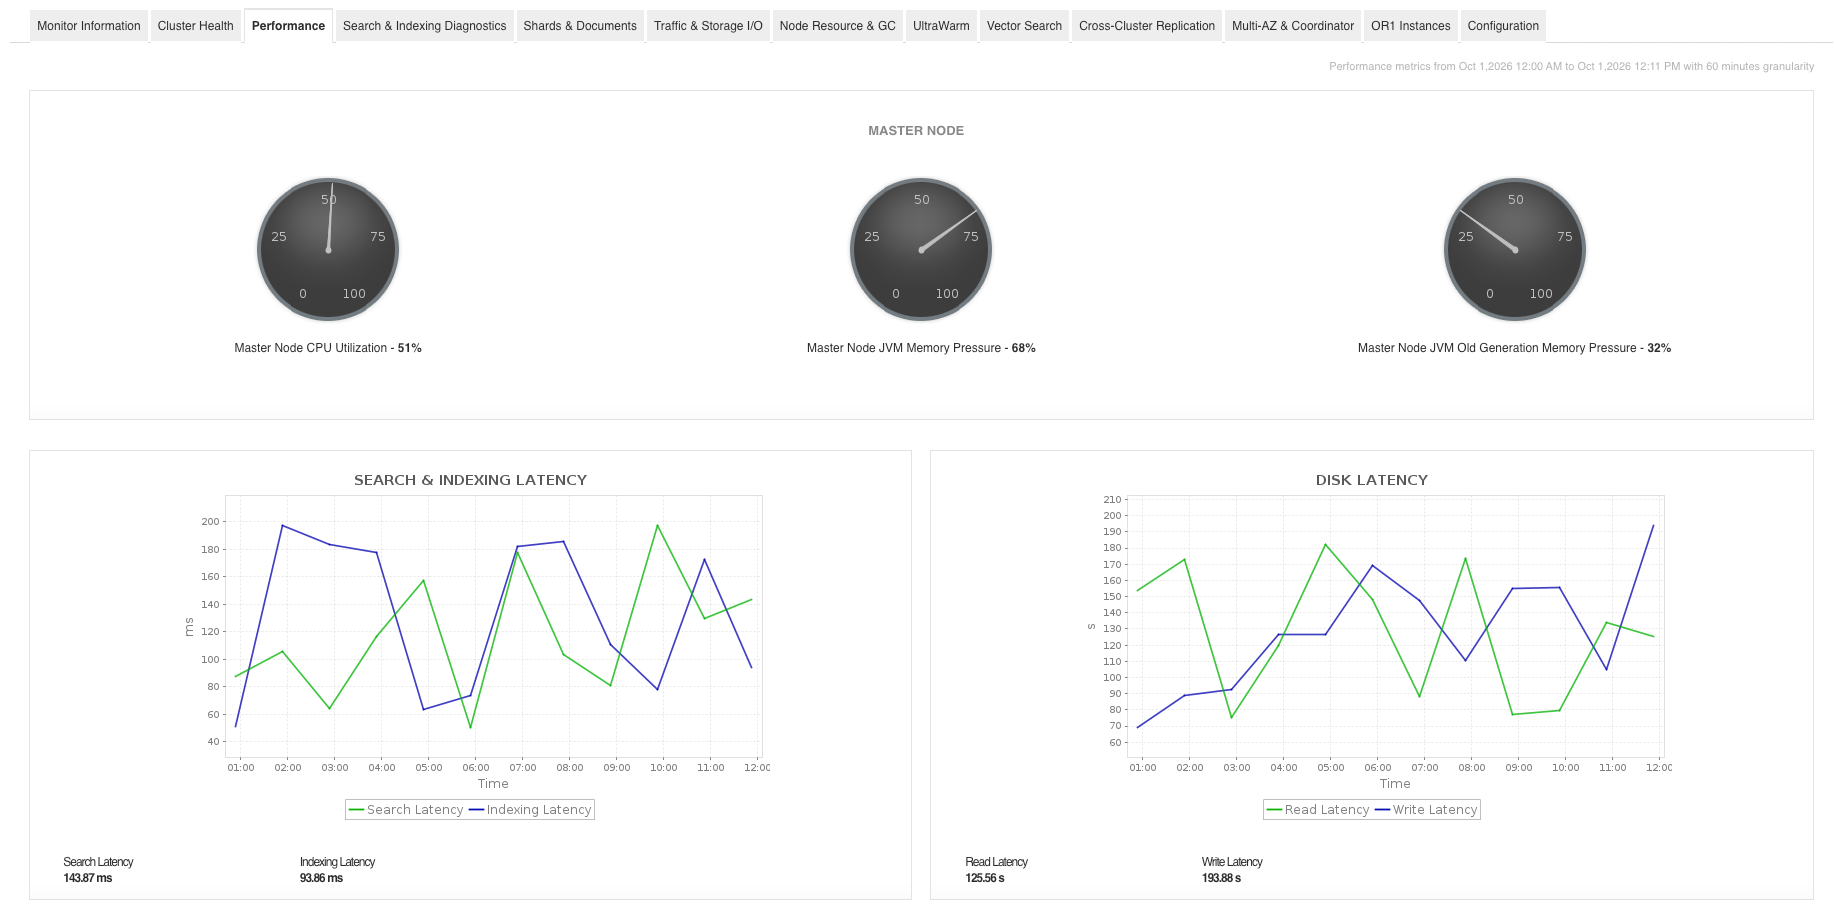
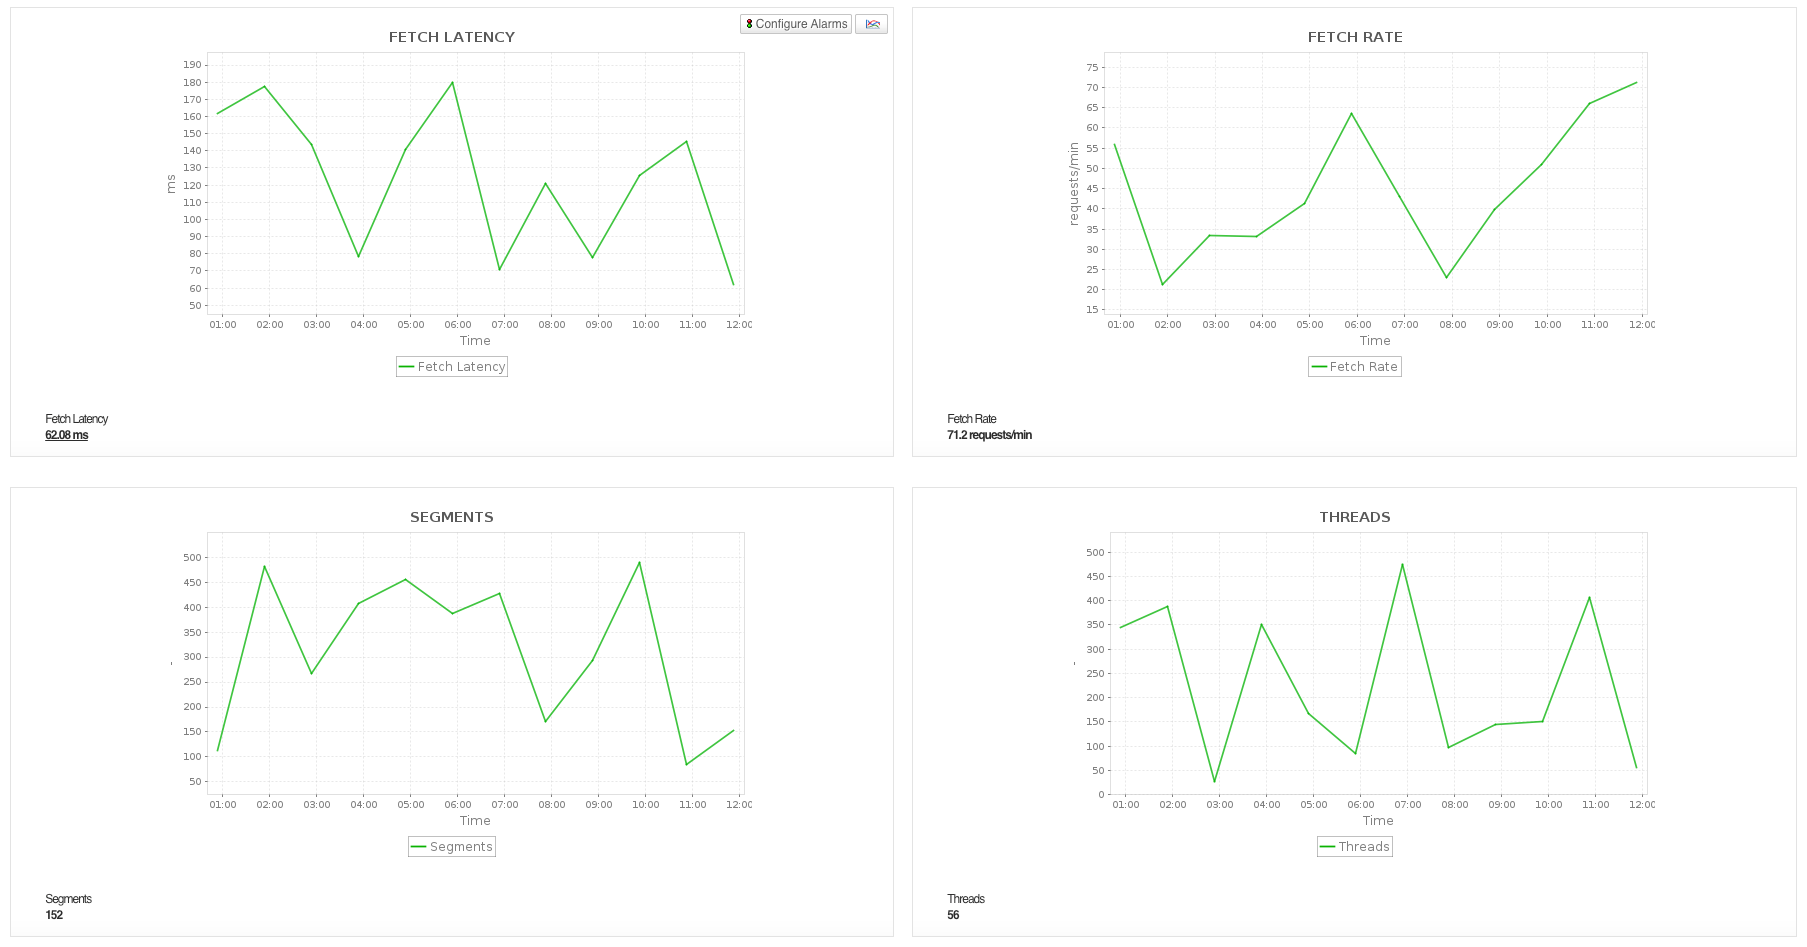
- Analyze search and indexing performance through search and indexing latency and rates, HTTP response classes, fetch activity, segments, disk latency and queue depth, garbage collection, thread pool queues, and rejections.
- Review shards and documents, EBS volume metrics for EBS-backed domains including throughput, IOPS, micro-bursting and burst balance, OpenSearch Dashboards health, and UltraWarm storage, search, thread pool, and tier migration metrics.
- Monitor vector search and cross-cluster replication, including k-NN cache and query metrics, replication status and lag, and Multi-AZ with Standby, coordinator node, and OR1 metrics.
- Review domain, cluster, storage, security, and network configuration, including engine version, instance and volume details, encryption, authentication, Availability Zones, security groups, subnets, VPC, and Region.
Amazon Redshift monitoring
Gain comprehensive visibility into the health and performance of Amazon Redshift clusters and prevent slowdowns, timeouts, and downtime that can disrupt analytics and business operations.
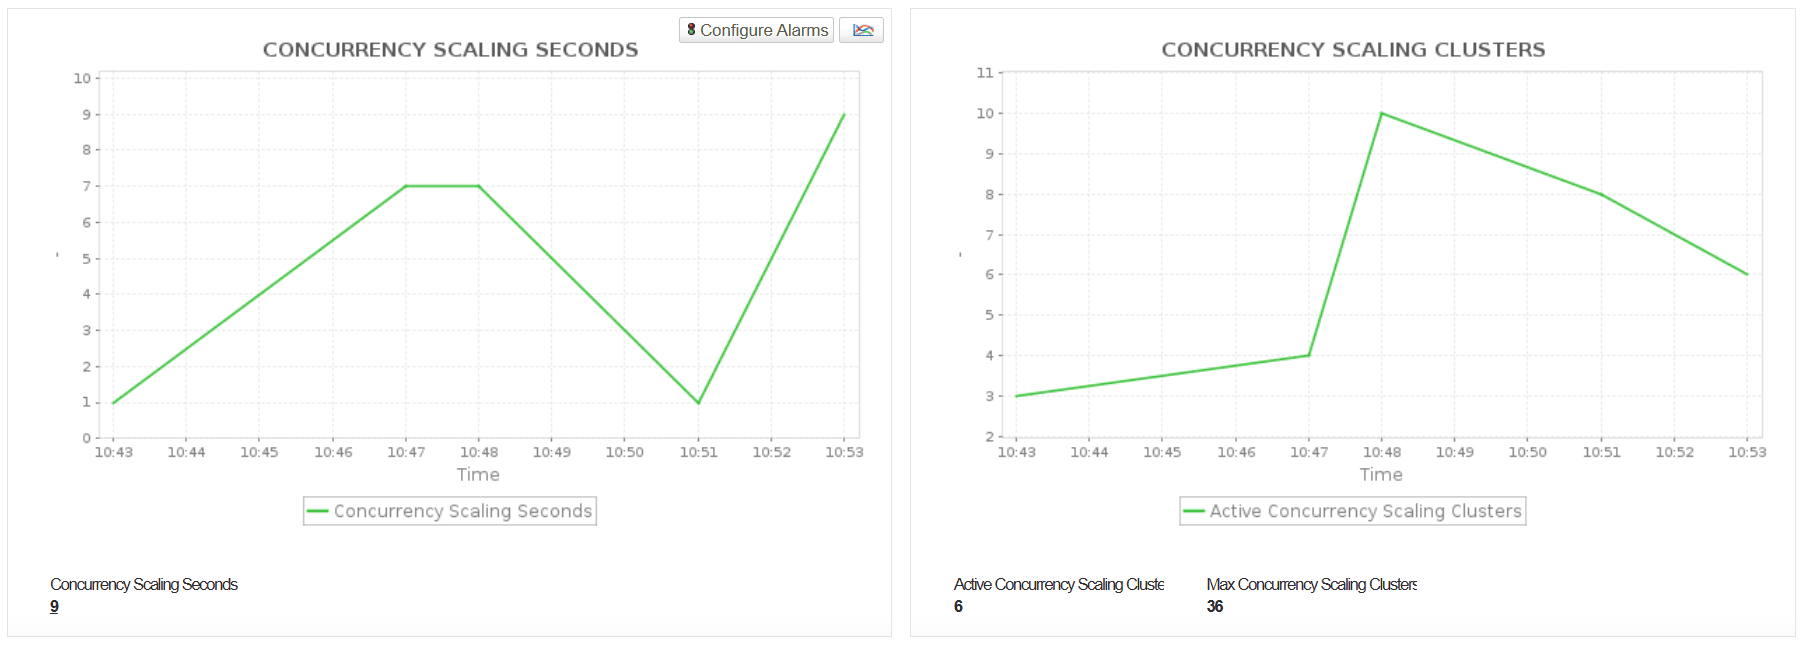
Applications Manager collects a broad set of performance metrics, such as resource utilization (CPU, disk, database connections), network throughput, and storage health, for both leader and compute nodes, enabling proactive detection of issues before they affect users or escalate costs. You can also track detailed query performance data, including query duration, throughput, lifecycle phase times (like planning, waiting, and commit times), and various execution stages. Additionally, you can monitor concurrency scaling metrics to understand how often and how long extra clusters are launched, aiding in optimizing cluster sizing and cost efficiency.

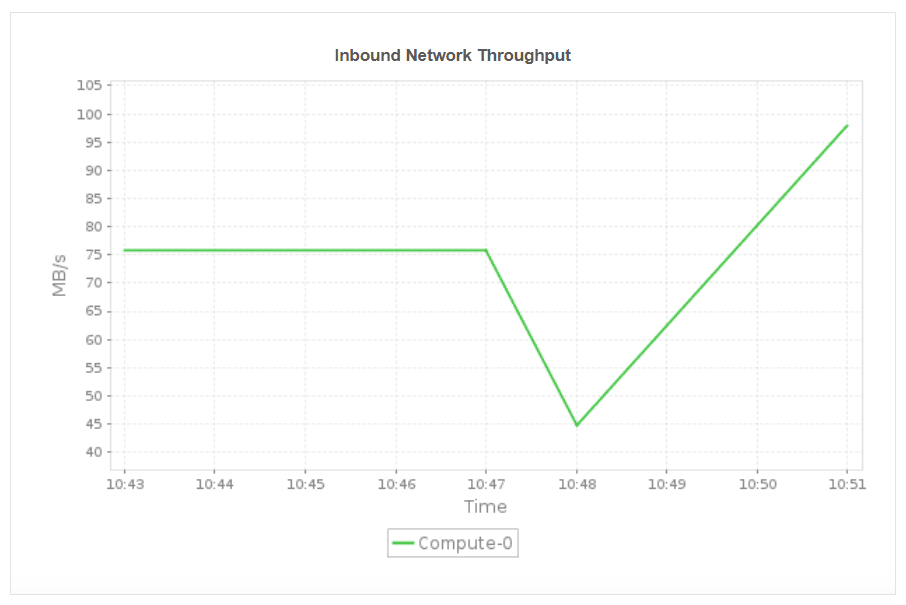
At the cluster and node level, Applications Manager helps identify bottlenecks, uneven workload distribution, and potential resource contention by tracking throughput, inbound/outbound network traffic, and disk activity. Real-time visibility into cluster state, connection health, and network performance ensures reliable operations and quicker troubleshooting.
Learn more about Amazon Redshift monitoring.
Get started with Amazon Analytics Services monitoring in minutes!
Get started with AWS Analytics Services monitoring in minutes using Applications Manager by simply connecting your AWS account and auto-discovering analytics services. Download a 30-day free trial and explore real-time performance, availability, and resource monitoring from a unified dashboard.
Do more with Applications Manager's AWS monitoring capabilities: