AWS performance monitoring: Building proactive observability at scale
Category: Cloud monitoring
Published on: October 11, 2025
7 minutes
Performance monitoring in AWS is not merely about collecting metrics. At scale, it is about constructing an integrated observability framework that captures the behavior of distributed systems, isolates performance bottlenecks, and provides actionable intelligence for optimization. In modern cloud-native environments, reactive monitoring is insufficient. Instead, teams must adopt proactive, data-driven approaches that combine AWS-native services, distributed tracing, workload profiling, and advanced anomaly detection.
This blog explores AWS performance monitoring in detail—what it entails, where the key challenges lie, and how enterprises can design systems that remain performant under unpredictable workloads.
The strategic imperative of performance monitoring
For organizations running critical workloads on AWS, performance monitoring directly influences customer experience, operational resilience, and cost efficiency. A microservice that responds in 300 ms versus 3 seconds can be the difference between retaining and losing customers. Similarly, a database query that consumes 5× more IOPS than expected may inflate monthly bills without immediate visibility.
Performance monitoring serves three strategic objectives:
- Reliability - Detecting service degradation before it cascades into outages.
- Scalability - Ensuring workloads adapt gracefully to dynamic traffic patterns.
- Efficiency - Identifying underutilized or misconfigured resources to optimize spend.
Without systematic performance visibility, AWS’s elasticity can mask inefficiencies until they become systemic.
Core dimensions of AWS performance monitoring
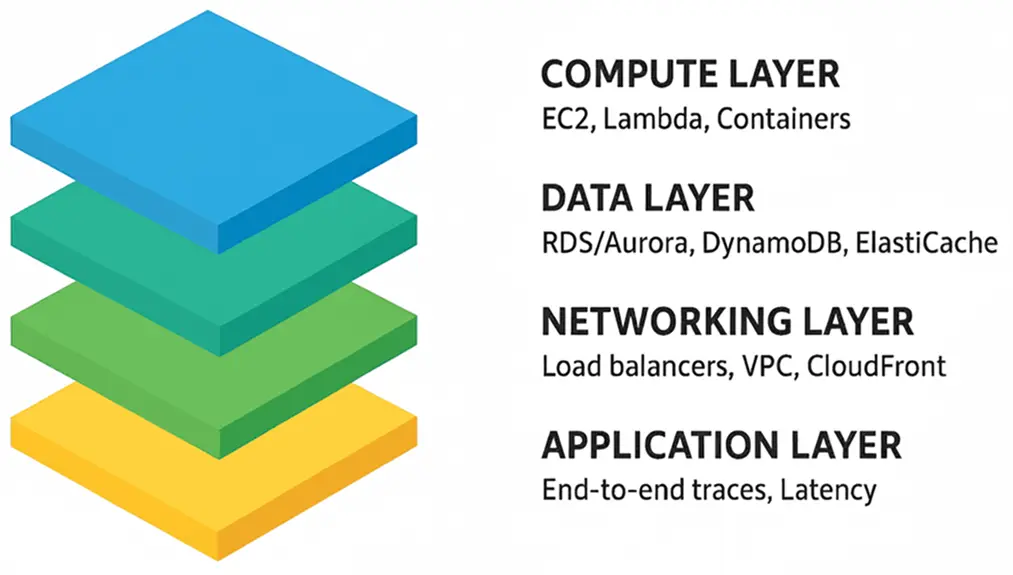
Effective AWS monitoring spans multiple layers of the stack, each requiring specialized instrumentation.

1. Compute layer
- EC2: CPU credits (for burstable instances), memory utilization (via CloudWatch agent), and disk throughput.
- Lambda: Cold start latency, execution duration, and concurrency utilization.
- Containers (ECS/EKS): Pod resource requests vs. actual usage, node autoscaling latency, and container restarts.
2. Data layer
- RDS/Aurora: Query execution plans, replication lag, and buffer cache hit ratios.
- DynamoDB: Throttled requests, partition-level hot spotting, and consumed read/write capacity units.
- ElastiCache: Cache hit rate, eviction rate, and replication latency.
3. Networking Layer
- Load balancers (ALB/NLB): Request count, target response times, and 5xx error rates.
- VPC networking: NAT gateway throughput, packet drops, and cross-AZ latency.
- CloudFront: Cache hit ratio, edge latency, and origin fetch errors.
4. Application layer
- End-to-end request traces via AWS X-Ray.
- Error distribution across services and regions.
- Latency breakdown per microservice.
Performance monitoring requires unifying these dimensions rather than analyzing them in silos.
Tools and services for performance monitoring
AWS provides a broad set of monitoring primitives. The challenge lies in orchestrating them coherently.
- Amazon CloudWatch: The foundational telemetry system for metrics, logs, and alarms. Enhanced with Container Insights, Contributor Insights, and Anomaly Detection.
- AWS X-Ray: Essential for tracing distributed workloads, particularly serverless and microservice architectures.
- Amazon CloudTrail: While primarily a security/audit service, CloudTrail data can also expose performance-impacting configuration changes.
- Amazon DevOps Guru: Applies ML-based insights to detect performance anomalies.
- Third-party and hybrid tools: Many enterprises extend beyond AWS-native tooling with solutions like ManageEngine Applications Manager to unify observability across hybrid/multi-cloud setups.
Each tool provides value, but holistic observability requires correlation across telemetry sources.
Methodologies for detecting performance bottlenecks
Performance monitoring is only as useful as the methodologies applied. Key techniques include:
1. Baseline establishment
- Define expected performance thresholds for each service.
- Use historical data to differentiate between normal workload variance and genuine anomalies.
2. Profiling and tracing
- Profile database queries (RDS Performance Insights, DynamoDB auto-scaling metrics).
- Trace end-to-end user requests to isolate microservice-level delays.
3. Synthetic monitoring
- Use CloudWatch Synthetics or third-party probes to simulate user interactions. Alternatively, you can also make use of synthetic monitoring capabilities from Applications Manager to track user simulations.
- Detect issues that internal metrics may not capture (e.g., DNS misconfigurations).
4. Correlation and root cause analysis
- Avoid analyzing metrics in isolation; correlate CPU spikes with query patterns or API request surges.
- Leverage X-Ray service maps or dependency graphs to visualize bottlenecks.
5. Anomaly detection and forecasting
- Implement ML-based detectors (CloudWatch Anomaly Detection, DevOps Guru).
- Forecast capacity needs to prevent resource saturation during predictable spikes (eg: Seasonal traffic).
Common performance pitfalls in AWS
Even advanced teams encounter recurring issues in AWS environments:
- Under-provisioned auto scaling policies: Scaling too conservatively can lead to throttling under peak load.
- Database hot partitions: DynamoDB workloads frequently hit partition limits, causing throttled reads/writes.
- Lambda cold starts: Large deployment packages or VPC-attached functions can add significant latency.
- Misconfigured load balancers: Idle timeout mismatches between ALBs and downstream services introduce connection resets.
- Unobserved cross-region latency: Multi-region architectures often degrade due to overlooked replication delays.
Identifying these requires visibility not just at the component level but across service interactions.
Best practices for AWS performance monitoring
- Instrument early: Bake monitoring into infrastructure-as-code templates (CloudFormation, Terraform).
- Centralize observability: Use cross-account dashboards or a unified observability platform to eliminate fragmented visibility.
- Automate remediation: Implement runbooks or Lambda functions to auto-resolve predictable issues.
- Apply the “golden signals”: Focus on latency, traffic, errors, and saturation as first-class monitoring dimensions.
- Continuously evolve baselines: As workloads scale and architectures shift, recalibrate performance expectations.
The future of performance monitoring in AWS
The shift toward event-driven and serverless architectures introduces new observability challenges: ephemeral workloads, distributed state, and complex event chains. Future-ready monitoring will increasingly rely on:
- OpenTelemetry standardization: Vendor-neutral instrumentation across cloud, hybrid, and edge.
- Predictive observability: ML-driven forecasting rather than reactive alerting.
- Automated remediation at scale: Integrating monitoring with infrastructure automation pipelines.
Organizations that adopt these practices will transform monitoring from a cost center into a strategic enabler of resilience.
Making it easier with Applications Manager
Monitoring AWS performance doesn’t have to feel like a juggling act. The raw tools are there—CloudWatch, X-Ray, CloudTrail—but stitching them together into something coherent takes effort. You can spend weeks building dashboards and still miss critical signals when it matters most.
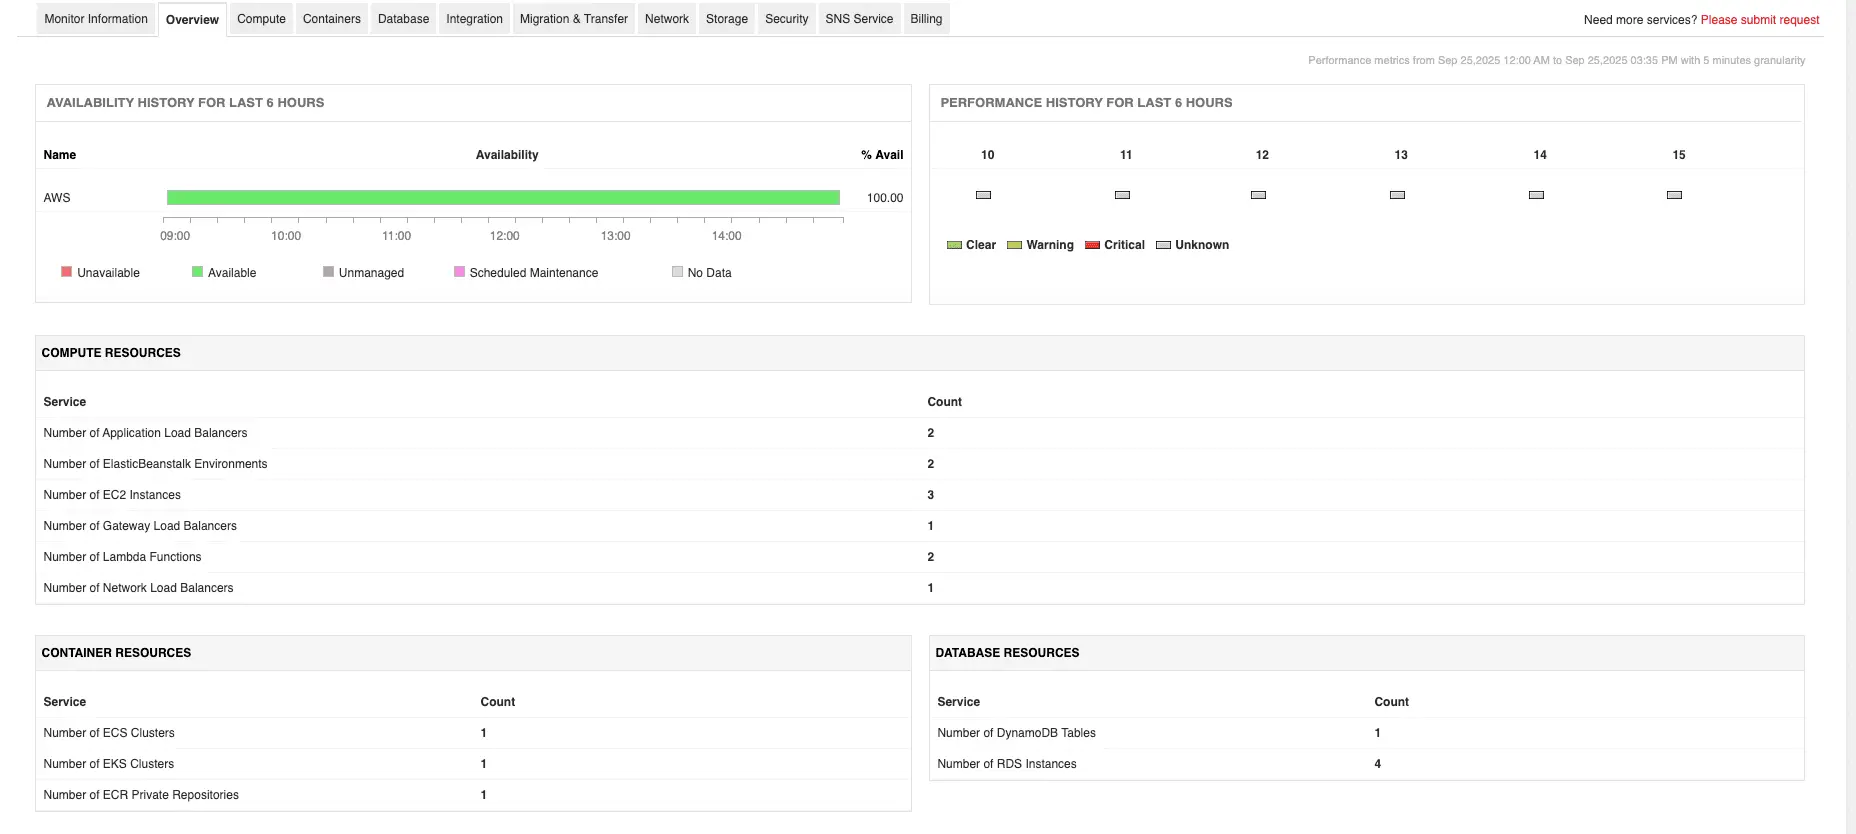
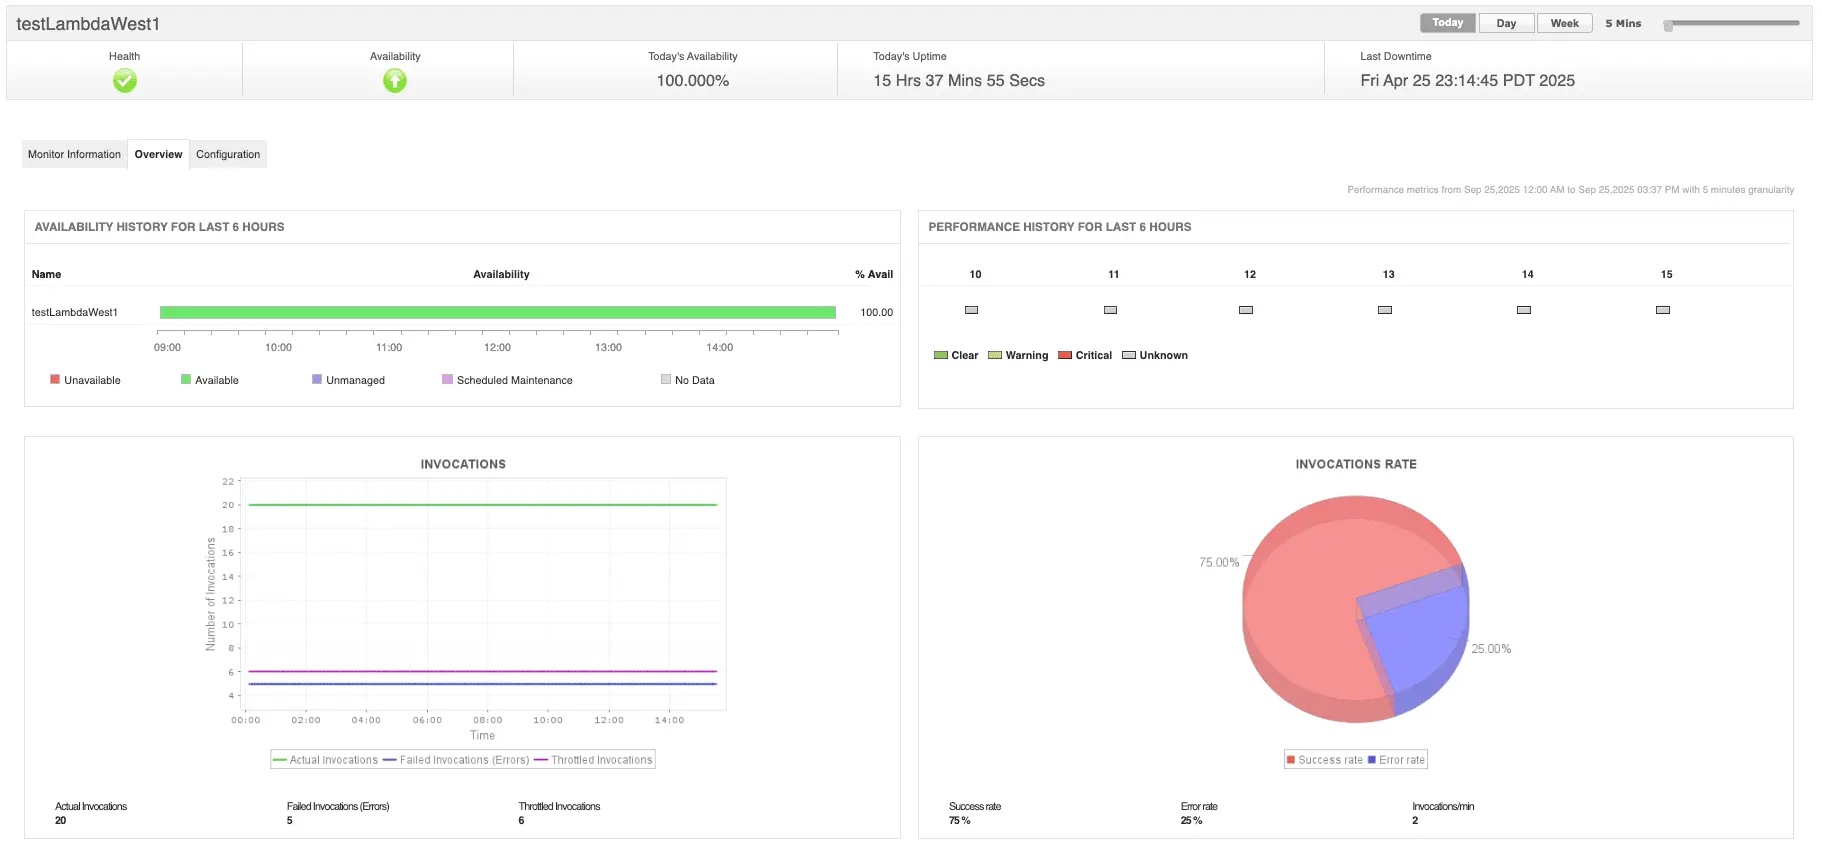
That’s why many teams adopt AWS monitoring solutions like Applications Manager, which pull all the pieces together. Instead of hopping between services, you get unified visibility into infrastructure metrics, uptime checks, cost signals, and application traces—all in one place. That means faster troubleshooting, fewer blind spots, and a chance to focus on building systems instead of constantly firefighting them.


Want to see it in action? You can schedule a personalized demo or download a 30-day free trial and experience what unified monitoring feels like.

