The complete guide to Azure monitoring: Features, best practices, and set-up
Category: Azure monitoring
Published on: October 27, 2025
15 minutes
Summary
Azure is known for its ability to operate important workload applications on virtual machines, databases, and app services; yet is also characterized by some degree of challenge to scale and manage. Teams could face the risk of downtime, runaway costs and security loopholes without proper monitoring solutions in place. Monitoring Azure cloud in real time will guarantee performance, cost management and adhering to compliance; thereby enhancing the end user experience.
A strong monitoring solution should track real-time metrics like CPU, memory, I/O, and latency, centralize logs for faster troubleshooting, provide intelligent alerts, and support automated remediation. It should also deliver cost insights, root cause analysis, and integration with ITSM and DevOps pipelines. While Azure Monitor and Application Insights offer robust native visibility, they focus mainly on Azure workloads.
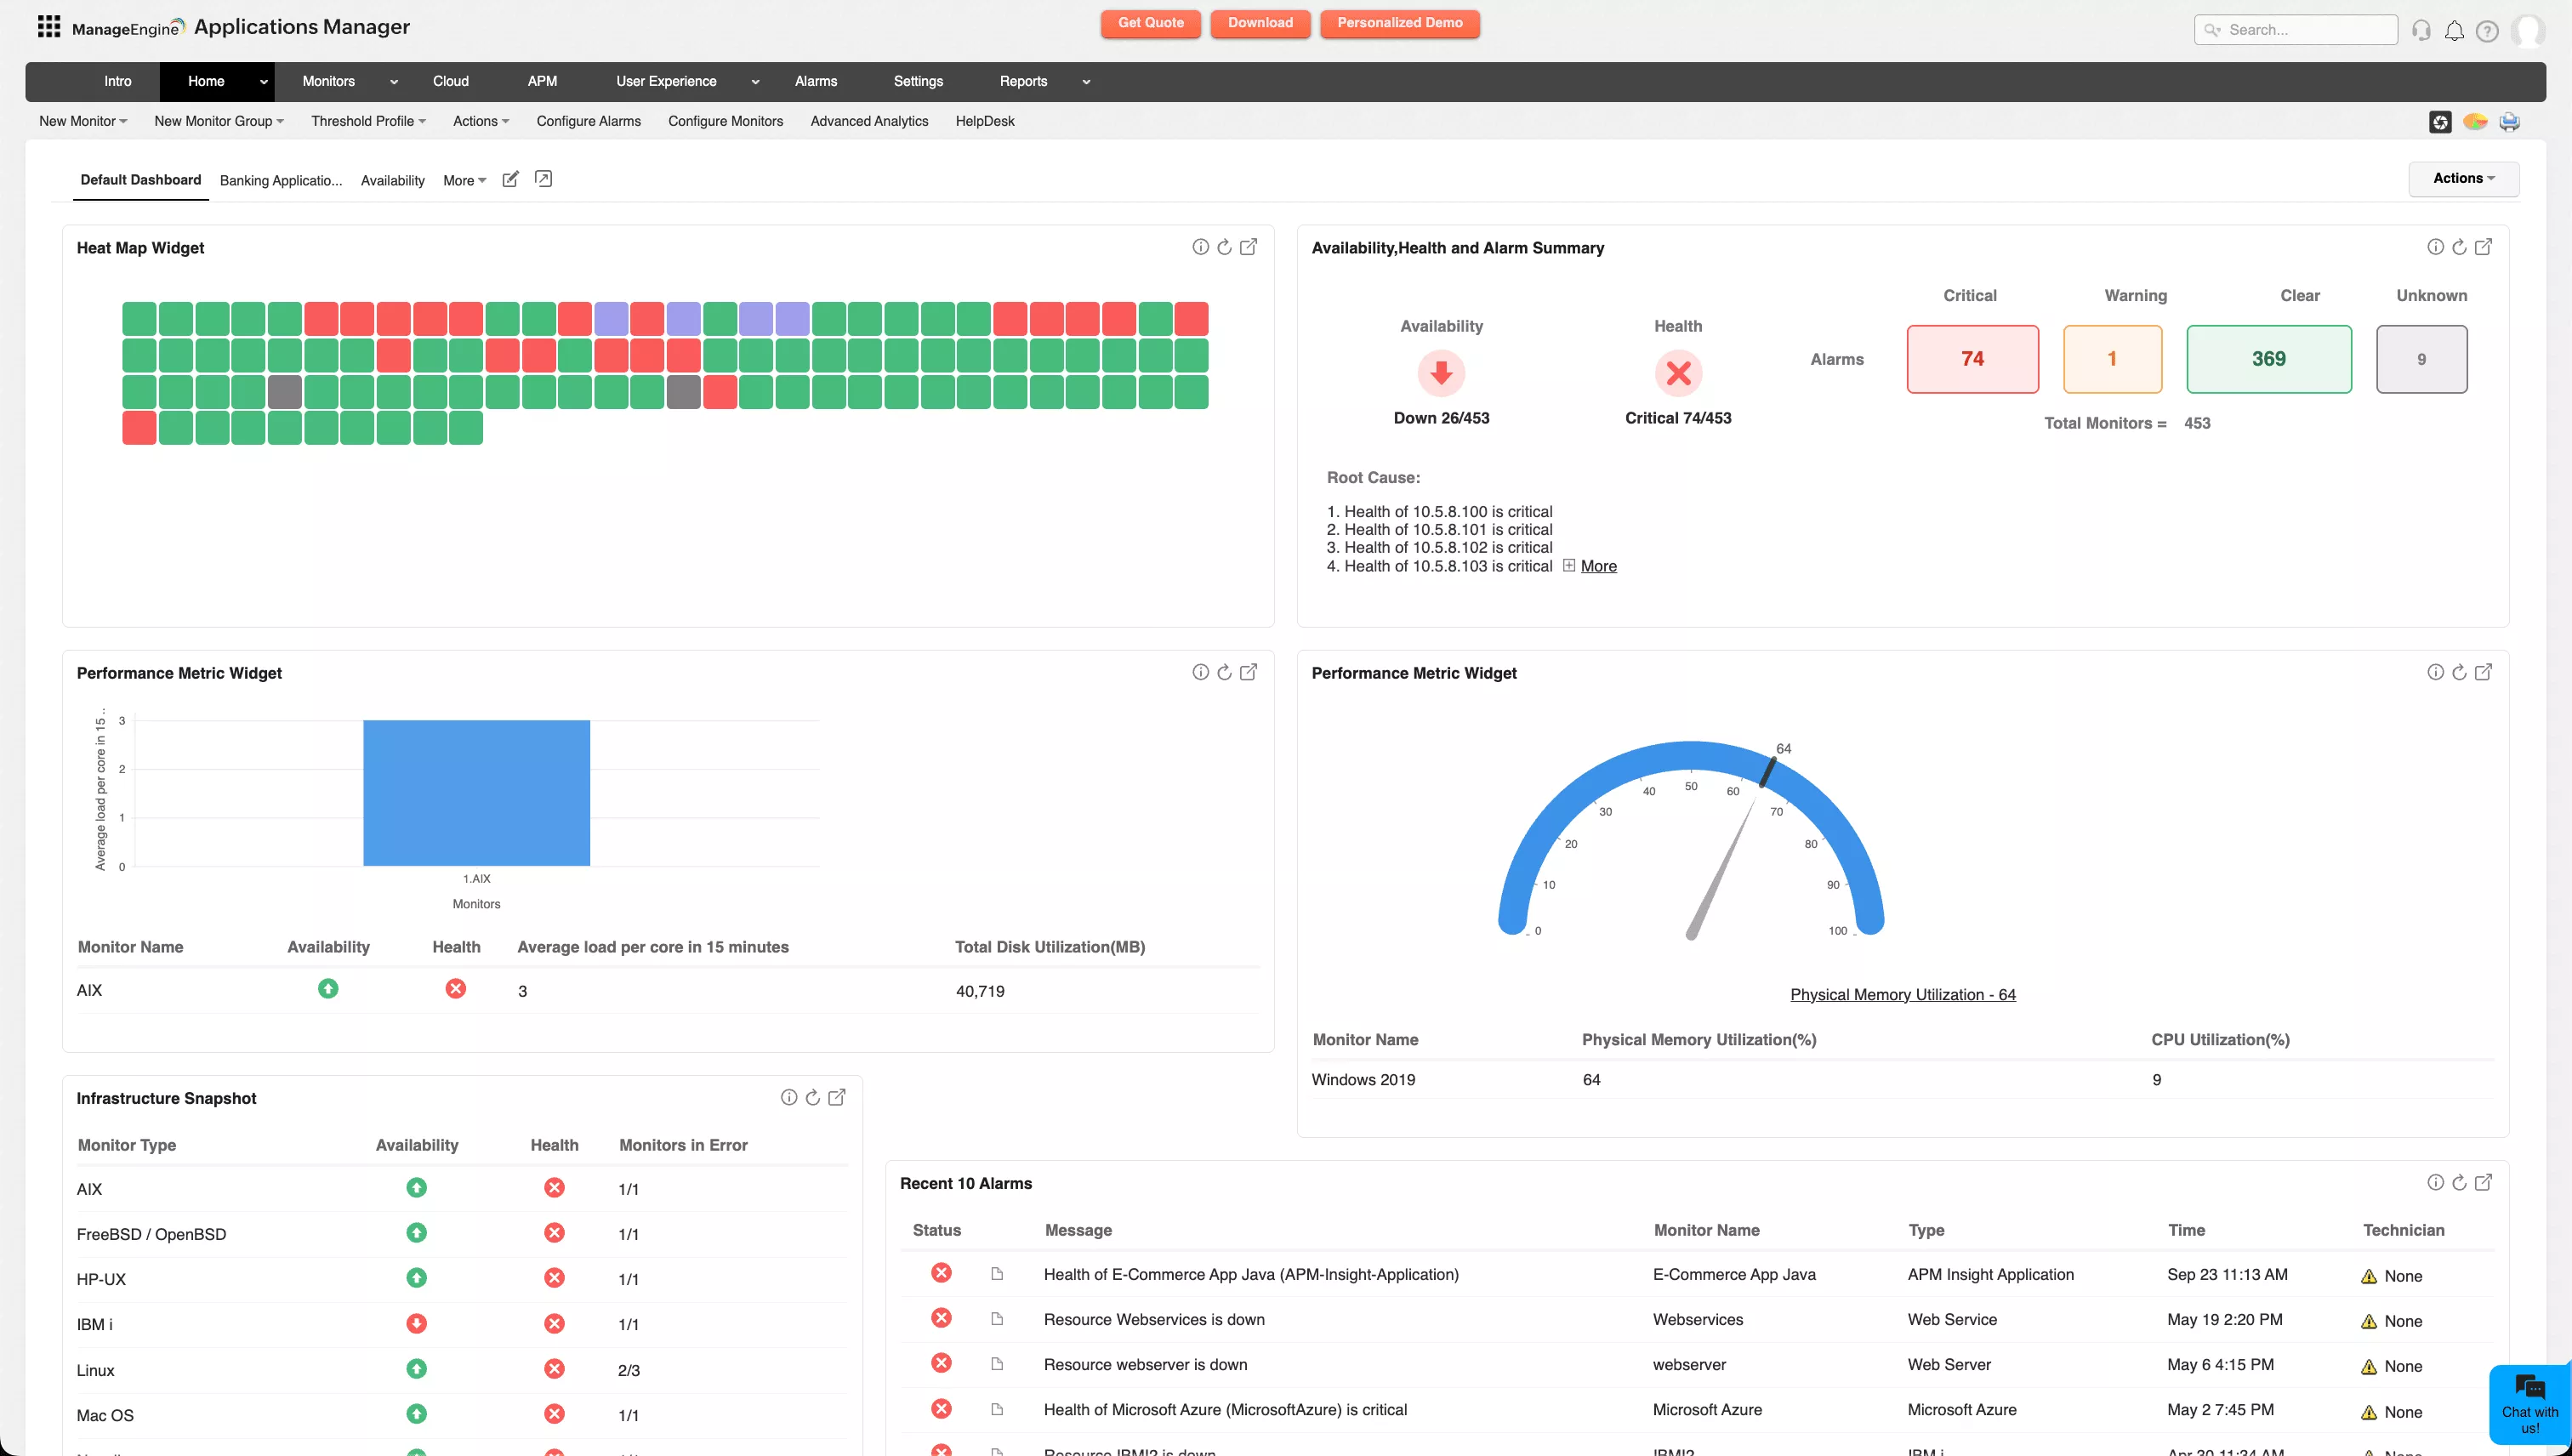
ManageEngine Applications Manager supports monitoring for more than 50 Azure services and 150+ technologies among hybrid and multi-cloud environments. It allows IT teams to operate their Azure environments more effectively and with increased confidence with unified dashboards, anomaly detection, and end-to-end visibility, which allow them to perform proactive performance management, quick root cause analysis, faster resolution and precise cost optimization.

In today’s cloud-first world, Microsoft Azure isn’t just a platform. It’s the backbone for modern digital operations. From virtual machines to serverless functions, Azure offers businesses unmatched scalability and flexibility. But with great power comes a challenge: keeping every service performing optimally while controlling costs and staying secure. That’s where Azure monitoring becomes essential.
Monitoring isn’t just a nice-to-have; it’s your visibility lifeline. Without it, IT teams operate in the dark, risking downtime and overall cloud performance. This guide walks you through why Azure monitoring matters, the features to prioritize, and how a solution like ManageEngine Applications Manager can transform your cloud strategy.
What makes Azure monitoring a non-negotiable practice?
Azure environments are dynamic, constantly scaling up or down to meet user demands. Traditional monitoring tools often struggle to keep pace, leaving gaps that can impact performance, security, and cost control. Effective Azure monitoring bridges this gap by giving administrators clear visibility into infrastructure health and application performance.
Here’s how proactive monitoring adds value:
- Performance and availability: Azure resources are robust, but not infallible. High CPU usage, memory leaks, or network issues can slow applications. Monitoring catches anomalies in real time, keeping your services available around the clock.
- Cost efficiency: Over-provisioning is easy without oversight. Monitoring reveals usage patterns, idle resources, and scaling opportunities; so you pay only for what you actually need.
- Proactive problem detection: Waiting for user complaints is reactive. With alerts and anomaly detection, issues are addressed before they affect end-users.
- Security and compliance: Monitoring access, configurations, and logs helps detect unauthorized activity and ensures adherence to standards like GDPR or HIPAA.
- Capacity planning: Historical data highlights trends and future requirements, helping IT teams scale with confidence.
- User experience: High cloud performance and uptime translate directly into satisfied, productive users.
Key features of an effective Azure monitoring solution
A good Azure monitoring tool delivers actionable insights that enable IT teams to manage cloud performance and costs proactively. A robust Azure monitoring solution should enhance visibility, automate routine tasks, support proactive monitoring, and transform raw data into meaningful operational decisions.
Here's what you should look for in an ideal Azure cloud monitoring solution:
Broad service coverage
An effective Azure performance monitoring solution must support the full spectrum of Azure resources. This includes Virtual Machines (VMs), App Services, Kubernetes Service (AKS), Functions, Storage Accounts, and Load Balancers. Comprehensive coverage ensures that every layer of your cloud environment is monitored: from compute and applications to networking and storage. This allows IT teams to understand interdependencies and detect issues early and ease.

Real-time metrics
Real-time visibility is crucial for proactive cloud management. Monitoring tools should capture key Azure monitoring metrics like CPU usage, memory consumption, disk I/O, network throughput, latency, error rates, and other critical metrics continuously. Such real-time data enables IT teams to spot anomalies immediately, prevent performance degradation, and maintain uninterrupted service delivery, ensuring end-users experience consistent reliability.
Centralized log analytics
A centralized log analytics feature integrates Azure cloud activity, diagnostic, and application logs into a single interface, allowing teams to search, filter, and analyze patterns effectively. This simplifies root cause investigation, enhances quick problem resolution, and helps IT admins with security audits by helping identify unauthorized access, configuration changes, or recurring errors.
Smart alerting
Intelligent alerts promote proactive monitoring. Efficient Azure monitoring tools provide threshold-based alerts, anomaly detection, and predictive alerts to forecast potential performance or capacity issues. Multi-channel notifications, including email, SMS, Slack, and webhooks, ensure the right people are informed immediately. With actionable context, alerts help teams respond quickly, reducing downtime and preventing minor issues from escalating.
Custom dashboards & reports
Customizable dashboards allow IT teams to visualize metrics in a meaningful way, combining operational and managerial perspectives. Trend reports track critical Azure cloud monitoring data like historical performance, resource utilization, and availability, providing insights for capacity planning and strategic decisions. Such comprehensive visibility keeps both technical teams and leadership on the same page.

Root cause analysis
Identifying the root cause of issues is critical for minimizing impact and preventing recurrence. Advanced monitoring tools correlate metrics, logs, and traces, helping IT teams pinpoint exactly where performance degradation or outages originate. This correlation reduces guesswork, speeds up resolution, and enables teams to implement long-term fixes rather than temporary workarounds.
Cost insights
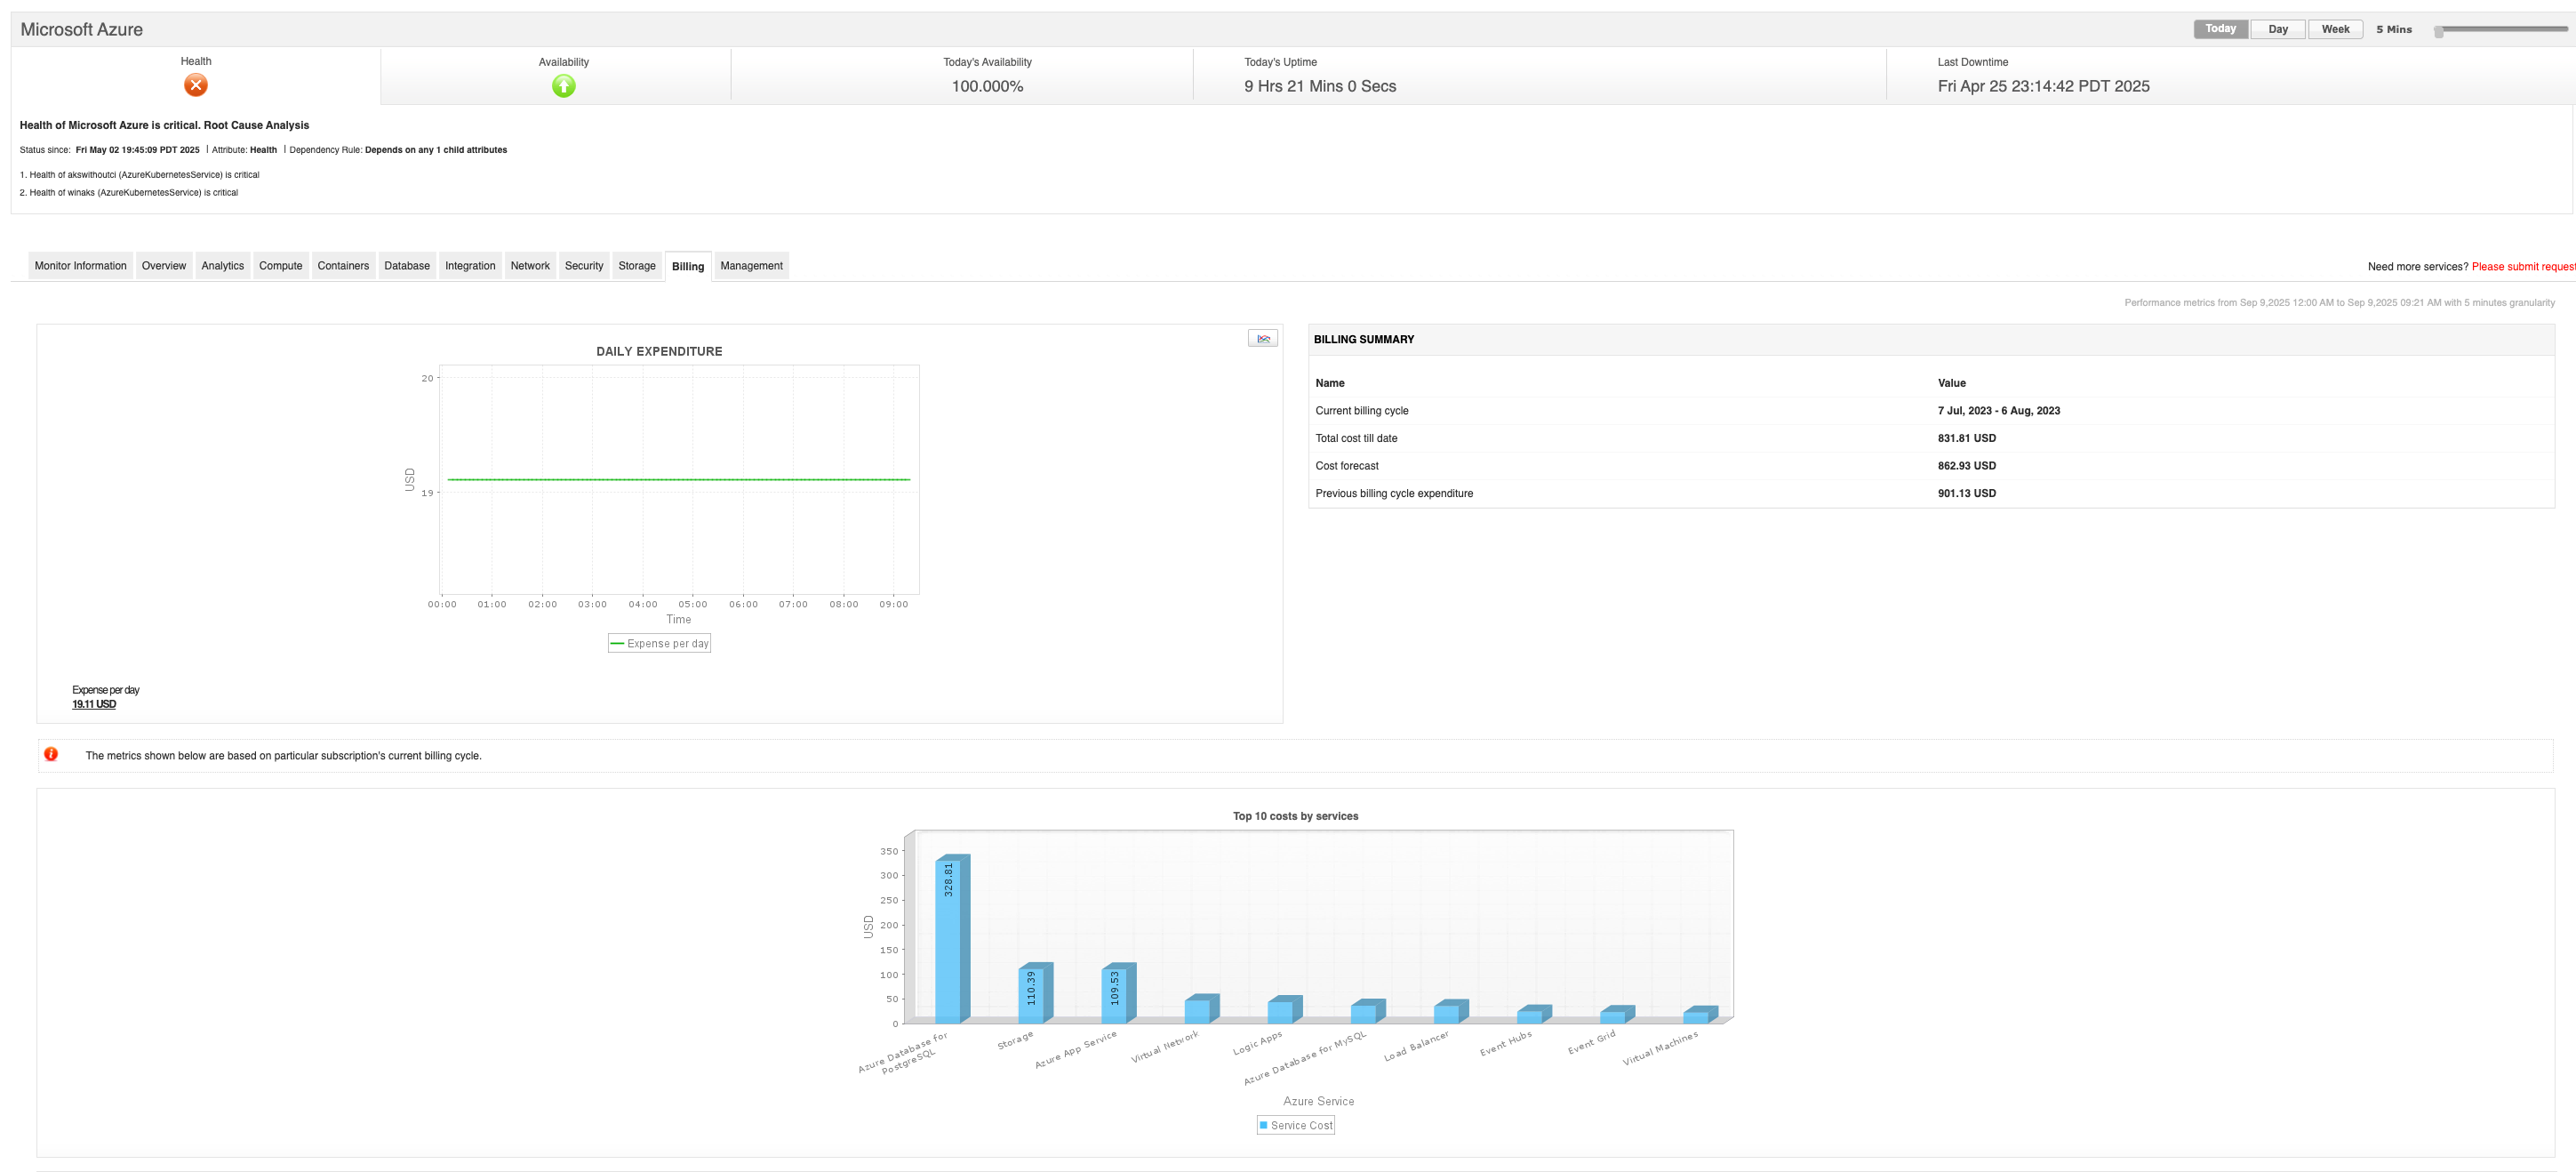
Azure cloud spend can quickly spiral without visibility. Employing Azure cloud monitoring solutions that provide cost insights helps identify idle or underutilized resources and optimize provisioning. By correlating performance with cost and forecasting future usage, organizations can right-size resources and cut down cloud costs effectively.
Automated remediation
Automating recurring tasks reduces manual effort and speeds issue fixes. Azure performance monitoring solutions that can trigger scripts or actions automatically in response to specific alerts, addressing common issues like restarting services or scaling resources. This ensures faster incident resolution and less operational disruption.
Integration
A modern monitoring tool must fit seamlessly into your broader IT ecosystem. Integration with ITSM platforms, DevOps pipelines, and other IT operations tools enables a unified view of infrastructure, supports streamlined workflows, and ensures monitoring insights drive actionable decisions across teams.
What are the critical Azure performance metrics you need to keep track of?
To monitor Azure effectively, it’s crucial to focus on the metrics that reveal real performance, health, and efficiency insights across your resources.
Azure Virtual Machines (VMs)
VMs form the backbone of most workloads, so keeping them healthy is critical. Track these core metrics to prevent resource bottlenecks and maintain performance:
- CPU Utilization: Percentage of CPU in use; high values may indicate undersized VMs or inefficient apps.
- Memory Available / % Used: Low memory can trigger swapping and slow performance.
- Disk I/O Operations (IOPS): Read/write operations per second; high IOPS can signal storage issues.
- Disk Throughput: Data read/write per second.
- Network In/Out: Traffic volume; spikes may indicate heavy workloads or potential attacks.
Azure Databases
Databases drive application responsiveness. Monitoring these metrics ensures smooth data operations and prevents slowdowns:
- DTU/vCore Usage: Database resource consumption.
- Log and Data I/O Percentage: Measures throughput for logs and data.
- Connections: Number of concurrent connections.
- Deadlocks: Count of deadlocks occurring.
- Latency: Average query execution time.
Azure App Services (Web, API, Mobile Apps)
Your applications’ health depends on server and app performance. Key metrics reveal user experience and potential issues:
- HTTP Server Errors: Count of 5xx errors indicating server or app problems.
- Average Response Time: Time taken to respond to requests.
- Requests: Number of incoming requests.
- CPU Time: Total CPU consumed by the app.
- Memory Working Set: Memory used by the application.
Azure Networking (Virtual Networks, Load Balancers, Gateways)
Network performance affects availability and reliability. Track these to spot bottlenecks or connectivity issues:
- Network Latency: Time for data to travel between points.
- Bytes In/Out: Volume of data transmitted.
- Packet Loss: Percentage of lost packets.
- Connection Count: Active connections on load balancers or gateways.
Azure Storage (Blob, File, Table, Queue)
Storage performance impacts application efficiency and scalability. Keep these metrics in view:
- Transactions: Number of storage requests.
- Availability: Percentage of successful requests.
- Latency: Average time for storage operations.
- Used Capacity: Total storage consumed.
Best practices for implementing Azure monitoring:
Define clear monitoring goals:
Identify what you need to monitor: performance, cost, security, or a combination; and clarify how the data will affect action.
Use case: Setting clear monitoring goals helps you prioritize tracking VM CPU utilization and memory usage to avoid resource bottlenecks. By focusing on these KPIs, you can detect when workloads are overconsuming resources and right-size them before performance degrades.
Centralize your cloud monitoring interface:
Use Azure Monitor, Log Analytics, and Application Insights for core insights. For complex environments, integrate a platform like ManageEngine Applications Manager to enhance visibility, enable cross-platform correlation, and apply advanced analytics across Azure, on-premises, and other cloud resources.
Use case: Centralizing cloud monitoring helps you correlate an Azure App Service slowdown with a spike in SQL Database latency. With a single interface, you can trace the root cause across services quickly instead of switching between multiple dashboards.
Establish strict baselines:
Track normal KPI behavior to establish meaningful thresholds. This helps identify anomalies from regular fluctuations and reduces alert noise.
Use case: Establishing baselines helps you detect when disk I/O on a storage account suddenly doubles compared to normal usage. This deviation highlights potential performance issues or abnormal activity, prompting investigation before it impacts dependent applications.
Automate Monitoring and Remediation:
Collect metrics and logs automatically and trigger remediation where possible. Automation reduces manual effort and enhances quicker problem resolution, keeping your Azure cloud efficient and healthy.
Use case: Automation helps you handle high CPU usage on an Azure VM by automatically triggering a scale-out action. This ensures workloads continue running smoothly without manual intervention, reducing downtime and performance risks.
How does Azure Monitor work?
Azure Monitor turns raw telemetry into clarity by following a straightforward progression:
- Collect: It gathers metrics, logs, and traces from Azure resources, applications, and virtual machines.
- Ingest and store: It routes metrics to the Metrics database, logs to Log Analytics, and application traces to Application Insights.
- Analyze and correlate: With KQL queries, analytics, and dependency maps, signals are connected so issues don’t stay hidden in silos.
- Visualize: Dashboards, charts, and workbooks make trends, anomalies, and performance patterns easy to see.
- Act: Smart alerts trigger notifications or automated responses, scaling resources, running scripts, or kicking off playbooks.
Azure Monitor runs on a continuous cycle: collect, analyze, visualize, act; giving teams the visibility and control they need to keep Azure workloads healthy and reliable.
How is Applications Manager different from Azure Monitor?
Azure Monitor is Microsoft’s native solution for tracking the health and performance of Azure workloads. It provides admin teams with real-time visibility into infrastructure, applications, and networks running in Azure. With deep integration, advanced telemetry, custom alerts, and analytics, it’s best suited for organizations operating heavily within Azure who want maximum uptime and reliability without leaving the platform.
| Azure Monitor | ManageEngine Applications Manager |
|---|---|
| Microsoft’s native solution for tracking the health and performance of Azure workloads. | Built for hybrid and multi-cloud monitoring across 150+ technologies including Azure, AWS, GCP, and on-premises systems. |
| Provides real-time visibility into Azure infrastructure, applications, and networks. | Provides unified visibility across cloud and on-premises environments with advanced dashboards and reporting. |
| Deep Azure integration with native telemetry, analytics, and alerts. | Offers code-level insights through APM Insight and advanced root cause analysis across distributed systems. |
| Best suited for Azure-centric enterprises focused on uptime and reliability within the Microsoft ecosystem. | Ideal for enterprises managing complex, hybrid, or multi-cloud environments that need holistic observability. |
| Limited to Azure Application Insights for application performance and telemetry. | Includes synthetic monitoring, real user monitoring, and end-user experience monitoring for complete digital experience visibility. |
| Pricing varies with number of alerts and configured actions. | Pricing varies with number of monitors. |
While Azure Monitor gives deep, native visibility into Azure workloads, it’s designed primarily for organizations that operate within the Microsoft ecosystem. ManageEngine Applications Manager, on the other hand, extends monitoring across hybrid and multi-cloud environments; bringing in-depth insights, intelligent automation, and user experience visibility under one unified platform.
Azure Monitor gives unmatched depth inside Azure, but Applications Manager delivers broader coverage across diverse cloud and application stacks; making it the smarter choice for Azure performance monitoring in environments where Azure is only one part of the IT ecosystem.
How ManageEngine Applications Manager elevates Azure performance monitoring
ManageEngine Applications Manager provides end-to-end Azure performance monitoring with real-time insights, custom dashboards, and automated issue resolution; helping teams optimize overall cloud performance. Here's how:
Comprehensive service coverage:
Monitor over 50 Azure cloud services that include VMs, App Services, databases, AKS, Functions, storage, networking, load balancers, messaging services, Cosmos DB, and Redis Cache.
Real-time performance checks:
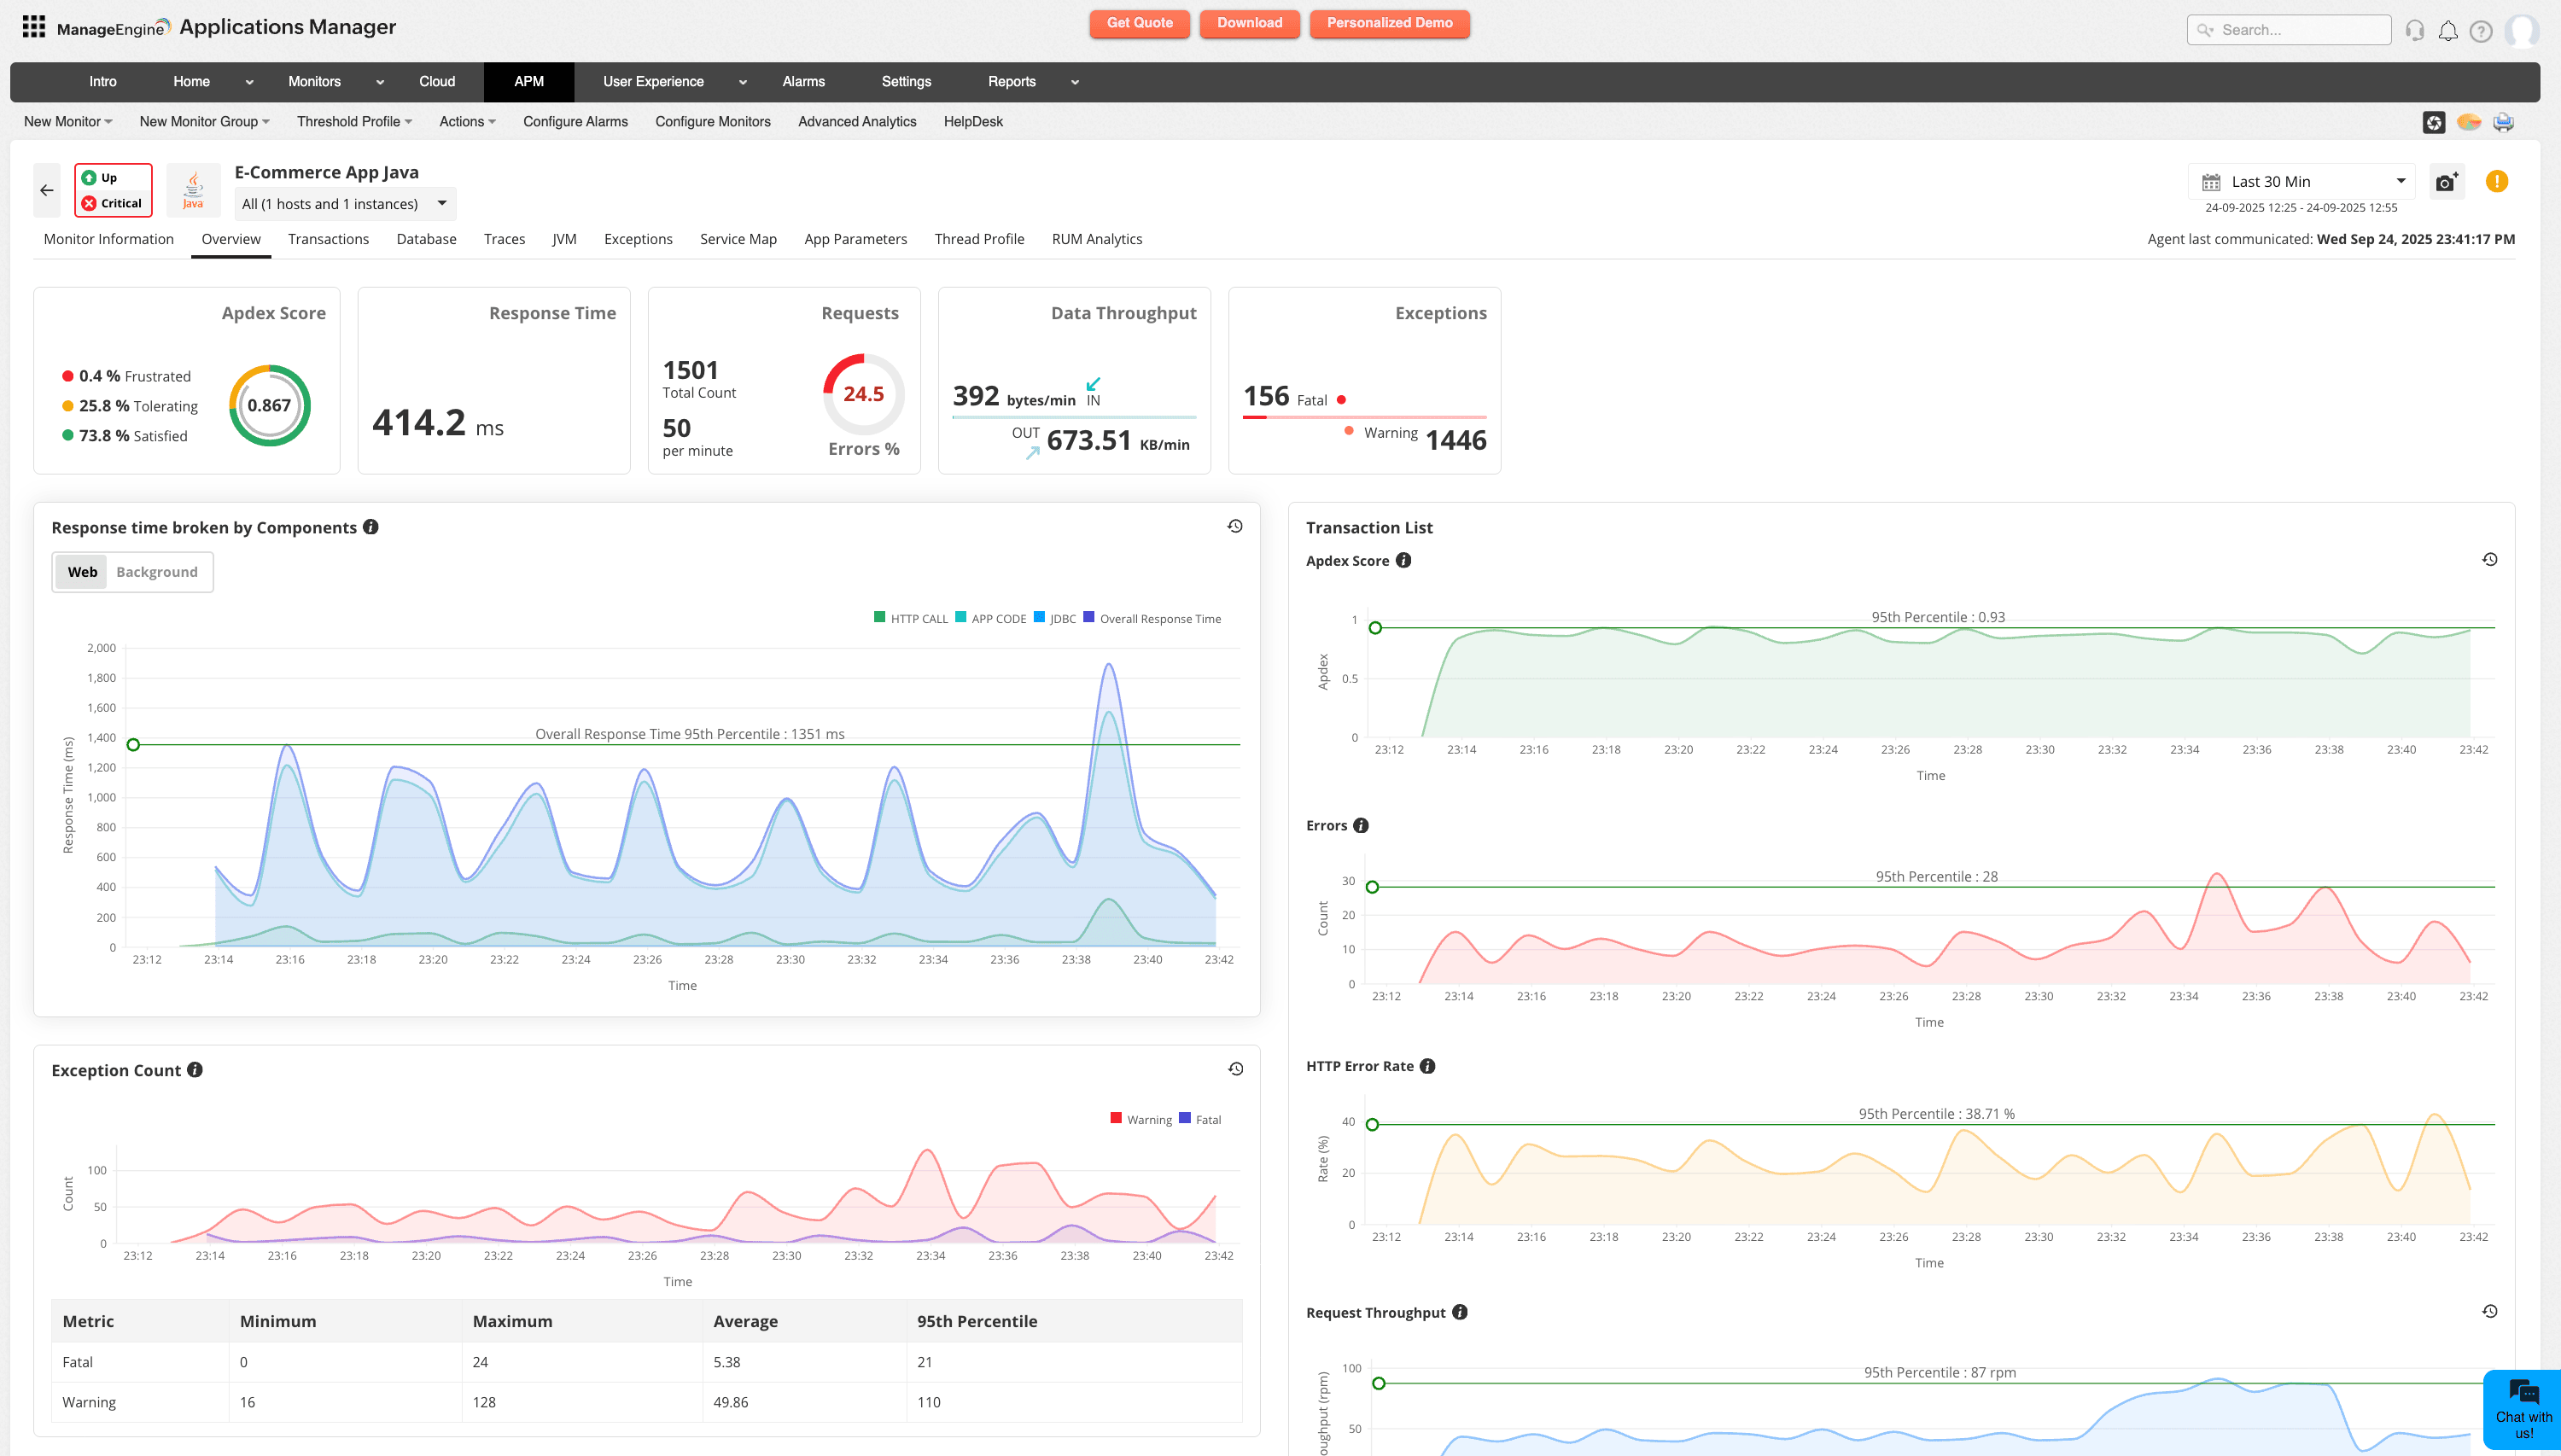
Track CPU, memory, disk, network, response times, requests, errors, and dependencies.
Intelligent alerting:
Threshold- and anomaly-based alerts with notifications via email, SMS, Slack, Teams, or ITSM tools.
Custom dashboards & reports:
Visualize cross-environment metrics for capacity planning and executive reporting.
Cost optimization:
Identify idle or underused resources and right-size workloads to cut spend. Beyond this, newly introduced Azure subscription-level monitoring features such as Subscription Quota usage tracking and Client Secret expiry monitoring help teams enhance cost control, avoid service disruptions, and prevent unexpected budget overruns.

Root cause analysis & automation:
Correlate metrics, logs, and traces with automated remediation for faster issue resolution.

Scalability:
Applications Manager also adapts to growing Azure environments; extending monitoring to AWS, GCP, and on-premises resources; and ensuring unified visibility as workloads scale dynamically.
Moreover, ManageEngine Applications Manager goes beyond standard Azure monitoring by pairing deep visibility with AI-driven intelligence. Unlike generic dashboards, it helps predict issues, analyze anomalies, and guide faster resolutions.
It’s also cost-efficient; not just in optimizing Azure spend but in offering a monitoring tool that doesn’t carry the premium price tag of competitors.
While scalability is steady, what truly sets it apart is expert support, with dedicated premium, regional, and enterprise-level assistance that ensures customers are never left guessing when critical workloads need attention.
Setting up Azure monitoring
Getting started with Azure performance monitoring with Applications Manager is pretty straightforward:
- Deploy Applications Manager on-prem or in an Azure VM.
- Connect to your Azure subscription with the right credentials.
- Automatically discover Azure resources.
- Select the services to monitor, and metrics start streaming immediately.
- Configure alerts, dashboards, and reports to suit your operations.
Take control of your Azure cloud environment
Azure runs the backbone of your business, which means Azure monitoring can’t be an afterthought. Native tools get you started, but ManageEngine Applications Manager turns monitoring into a proactive strength. From end-to-end visibility and smarter alerts to cost control and performance insights, it gives your team everything in one place. The result—control over your cloud, fewer blind spots, and the confidence that your Azure setup is running at its best.

