If I were the IT lead for Black Friday:
Assembling my monitoring strategy
Category: General, Digital Experience monitoring
Published on: Nov 21, 2025
9 minutes
If I'm going to prevent the scenarios discussed in part 1 of my "If I were an IT lead during Black Friday" series, I need visibility into every layer of the system. Monitoring after the fact is a failure; my priority is preparing for bottlenecks before they occur and drastically reducing any potential downtime for our customers.
5 mandatory monitoring layers to beat Murphy's law
If anything can go wrong during the Black Friday peak, it absolutely will go wrong. That’s just Murphy's Law applying maximum pressure to your high-stakes infrastructure. Since we can't eliminate risk, our only choice is to build a monitoring fortress.
Here are the five mandatory layers of full-stack visibility that will allow you to anticipate and resolve issues before they turn into catastrophic, seven-figure revenue failures, and hopefully neutralize the chaos:
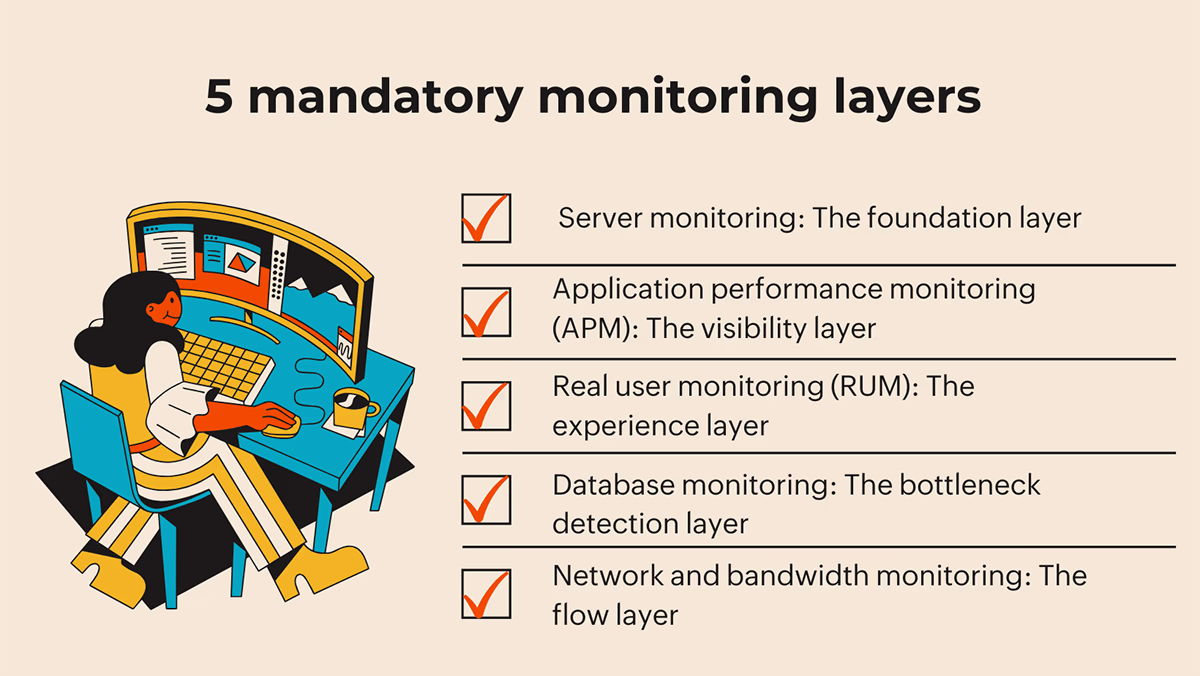
1. Server monitoring: The foundation layer
To begin with, I'd implement comprehensive server monitoring that tracks CPU utilization, memory usage, disk I/O, and network activity in real-time. If CPU usage on my web servers exceeds 85% during peak traffic, I know I need to scale horizontally. If memory is consistently above 90%, I know I have a memory leak or insufficient capacity.
The key metrics I'd monitor:
- CPU utilization: This metric would show me how much processing power is in use. Sustained high CPU usage indicates performance issues are imminent.
- Memory usage: I'd monitor the available and consumed memory to prevent crashes due to memory leaks or excessive load.
- Disk I/O performance: The read/write speeds helps detect storage failures or bottlenecks that degrade application performance.
- Network I/O: The incoming and outgoing network traffic helps detect bandwidth saturation.
But here's the critical part: I won't just monitor these metrics passively. I'd set up automated alerting that notifies my team the moment any metric approaches dangerous levels, and more importantly, I'd configure predictive auto-scaling that automatically allocates additional resources before the metrics become problematic.
Why would I do that?
A 2022 study on predictive autoscaling for e-commerce workloads demonstrated that predictive autoscaling achieved 94% forecasting accuracy and slashed response-time delays compared with reactive scaling. The e-commerce site sustained double its normal traffic without a single outage. That's the kind of proactive approach that separates successful Black Friday deployments from disasters.
2. Application performance monitoring (APM): The visibility layer
APM gives me what server monitoring cannot: visibility into what's actually happening within my applications. I would track transaction flows to identify where requests are getting stuck, and understand which code paths are performing poorly under load.
The critical APM metrics I'd focus on:
- Response time: This is the time from when a user initiates a request to when they start receiving data. If my average response time is 200ms during normal traffic and jumps to 5 seconds during Black Friday peak, I know something is wrong. I'd set a baseline response time SLO (Service Level Objective) and alert if actual performance drops below it.
- Error rates: How frequently errors occur, both application errors and HTTP errors (5xx, 4xx). If the error rates jump from 0.1% to 5%, that's a catastrophic signal. I'd be notified immediately and could investigate whether it's a code issue, a dependency failure, or resource exhaustion.
- Throughput: This measures how many transactions my system is processing per second. During Black Friday peaks, I'd expect this to match historical patterns. If throughput suddenly drops while traffic is increasing, that's a red flag indicating a bottleneck somewhere in the system.
- Transaction trace analysis: This is where APM becomes truly valuable. I can trace individual customer transactions end-to-end, seeing which components they hit, how long each component takes, and where the slowdowns occur. If I notice that 50% of customers are experiencing long delays during checkout, I can drill down into transaction traces and see if it's the database, the payment processor, the inventory system, or something else entirely.
3. Real user monitoring (RUM): The experience layer
RUM tells me what actual customers are experiencing, not what my synthetic tests show. A 0.1-second improvement in page load time leads to an 8.4% increase in conversions with retail consumers, with customer orders increasing by 9.2% on average. This means that even small performance degradations have massive business impact.
The RUM metrics I'd track:
- Page load time: How long does it take for a web page to fully load and become interactive? For e-commerce, the benchmark is 2 seconds. If page load times exceed 4 seconds, users start abandoning. My goal would be to maintain sub-2-second load times even during peak traffic.
- Session analysis: I'd analyze user sessions to identify where customers are getting stuck or abandoning. If I notice that 30% of users abandon during the product page loading stage, I know that's where I need to focus optimization efforts.
- JavaScript errors: High JavaScript error rates are silent revenue killers. I'd capture and analyze these front-end errors immediately, as they often break interactive forms and checkout logic without generating a server-side alert.
- Resource and dependency health: To get a clear picture, I divide all resources into three essential groups and monitor the loading speed and success rate for each one individually.:
- First-party: I'd ensure my own scripts, images, and CSS are flawless, as failures here impact virtually all users.
- Third-party: A slow or failed external plugin (for payments, reviews, or ads) can single-handedly break a critical page and that's exactly why I need to watch them closely.
- CDN assets: And to ensure static content is served optimally, and guarantee global speed, I'd track cache hit rates and latency across different regions.
4. Database performance monitoring: The bottleneck detection layer
Databases are often the silent killers in e-commerce platforms. A single inefficient query can consume all available database resources, making the entire platform crawl. I need to monitor database performance continuously.
The critical database metrics:
- Query execution time: I'd track how long queries take to execute. If queries that normally execute in 100ms suddenly take 2-3 seconds during peak load, I know the database is under stress or there's a query optimization opportunity.
- Index utilization: I'd ensure that frequently accessed queries are using optimal indexes. Missing indexes force the database to perform full table scans, which consume enormous resources under high load.
- Connection pool utilization: Databases have a limited number of connections they can accept. If connections are maxed out during peak traffic, new connection requests will fail. I'd monitor how close connection pools are to their limits and scale accordingly.
- Lock contention: High lock contention indicates that multiple queries are trying to access the same data simultaneously, creating delays. This often signals the need for query optimization or database schema adjustments.
- Slow query logs: I'd continuously monitor slow query logs to identify queries that should be optimized. During peak Black Friday traffic, every millisecond matters.
5. Network and bandwidth monitoring: The flow layer
Even if my servers and applications are healthy, insufficient network capacity or misconfigured network components can create bottlenecks.
The network metrics I'd track:
- Bandwidth utilization: I'd monitor inbound and outbound bandwidth to ensure I'm not hitting capacity limits. If bandwidth utilization exceeds 85% during peak traffic, I know I need additional capacity or optimization.
- Network latency: I'd monitor latency to my critical infrastructure components (databases, caches, external APIs). High latency can make even healthy systems feel slow.
- DNS performance: DNS resolution is often overlooked, but slow DNS lookups can add 100+ milliseconds to every request. I'd monitor DNS response times and ensure they're optimal.
- CDN performance: If I'm using a Content Delivery Network (CDN), I'd monitor cache hit rates and response times from edge locations. Cloudflare's 2023 e-commerce deployment documented how integrating a CDN reduced page-load times by 40% and improved uptime to 99.99% during Black Friday.
The critical metrics that make or break Black Friday
As an IT professional, I need to understand which metrics actually predict success or failure. Here are the key metrics I'd focus on:
Uptime and availability metrics
Uptime measures the percentage of time a service is available and functioning correctly. However, uptime is a binary metric- either the service is up or down. What I really care about is availability, which factors in how quickly I can recover from failures.
The formula is: Availability = MTBF / (MTBF + MTTR)
Where MTBF is Mean Time Between Failures and MTTR is Mean Time To Repair. If my system fails once every 720 hours (MTBF) and takes 5 minutes to repair (MTTR), my availability is 99.99%. But if I can reduce MTTR to 1 minute, my availability jumps to 99.9986%. This is why rapid detection and response are critical, and through monitoring and automation I can reduce both my MTBF and MTTR.
For Black Friday, I'd aim for an SLA of at least 99.9% uptime, which means I can tolerate only 43.2 minutes of downtime per month. Given that a single hour of downtime costs retailers $100,000 to $300,000+ according to industry surveys, that SLA target isn't ambitious.
Response time and latency metrics
Average response time measures how quickly my servers respond to requests. For e-commerce transactions during Black Friday peak, I'd aim for response times under 500 milliseconds. If response times exceed 1 second, users perceive the system as slow, engagement drops, and conversion rates decline.
Latency to critical infrastructure components (databases, caches, payment processors) should be monitored separately. High latency to the database is a classic bottleneck: if every request takes an extra 200ms just to communicate with the database, I'm already approaching the threshold where users perceive slowness.
Error rates and transaction success
Error rate is typically calculated as the percentage of responses that result in errors. For production systems, error rates below 0.1% is good. During Black Friday, as long as error rates stay below 0.5%, I'd say it acceptable. If they spike to 5% or higher, that's a critical issue requiring immediate investigation.
Transaction success rate is the percentage of customer actions that complete successfully. In e-commerce, the most critical transaction is checkout. If my checkout success rate drops below 95%, I'm losing significant revenue. This is something I'd monitor continuously and set up critical alerts if it drops below my target threshold.
Capacity utilization metrics
CPU, memory, and disk utilization tell me how close I am to resource exhaustion. My target thresholds would be:
- CPU, memory, and disk utilization tell me how close I am to resource exhaustion. My target thresholds would be:
- Memory utilization: Alert at 80%, Critical at 90%
- Disk utilization: Alert at 80%, Critical at 90%
These thresholds trigger automatic scaling actions before the resources become exhausted.
SLA metrics
These are targets I would assign for SLA to ensure the reliability and performance of the application during all periods, especially high-stress retail events.
- Uptime: 99.9% (43.2 minutes of acceptable downtime per month)
- Average response time: <500ms during peak traffic
- Error rate: <0.5% during peak traffic
- Availability: 99.99% (calculated from MTBF and MTTR)
Tactical snaps I’d have ready (short actionable scripts)
The goal of superior monitoring isn't just to generate alerts; it’s to give your team the immediate context and confidence to execute pre-approved fixes (runbooks). When an alert fires during the rush, there’s no time for deliberation.
Here are a few actionable scripts a monitoring system should be ready to facilitate:
Scenario A: Critical checkout failure
| Trigger | Immediate response |
|---|---|
| Checkout Error Rate Spikes > 1% (SLO Failure) |
|
Scenario B: Severe latency degradation
| Trigger | Immediate response |
|---|---|
| P99 Latency > 3x Baseline (Severe Performance Hit) |
|
Scenario C: Database exhaustion
| Trigger | Immediate response |
|---|---|
| Database Connection Pool Exhausted |
|
Scenario D: CDN origin overload
| Trigger | Immediate response |
|---|---|
| CDN Origin Requests Spike (Potential DDoS/Cache Misses) |
|
Now that I have assembled my strategy, let's look at part 3 of my series "If I were an IT lead during Black Friday" — Implementing proactive DEX monitoring timelines: My Black Friday playbook.