Top Azure monitoring tools (2025): Ensuring peak Azure performance
Category: Azure monitoring
Published on: October 14, 2025
5 minutes
Azure powers critical workloads across industries. But deploying resources is only half the job. Keeping them available and cost-efficient requires effective Azure monitoring. Without it, you risk downtime, degraded user experience, and spiraling cloud bills.
This guide breaks down what Azure monitoring tools do, the leading options in 2025, and best practices to get the most out of them.
What are Azure monitoring tools?
Azure monitoring tools are specialized platforms and services that collect, process, and analyze telemetry data across your Azure environment. They provide visibility into three core areas of Azure monitoring:
- Metrics: Performance signals like CPU utilization, memory usage, request latency, and disk I/O.
- Logs: System, application, and platform-level events that reveal operational health and anomalies.
- Traces: Distributed transaction flows that track how requests move across microservices, APIs, and containers.
Within the Azure performance monitoring ecosystem, Microsoft offers native services like Azure Monitor, Application Insights, Log Analytics, and Network Watcher. These services integrate directly with Azure Resource Manager (ARM) and give out-of-the-box monitoring for App Services, VMs, AKS clusters, serverless Functions, SQL Databases, and networking resources. They also tie into Azure Security Center and Azure Policy, making monitoring a part of compliance and governance.
But Azure-native monitoring isn’t always enough to monitor complex Azure hybrid cloud infrastructure. Enterprises running on hybrid-cloud or multi-cloud workloads often need extended visibility. This is where third-party Azure monitoring tools; such as Datadog, Dynatrace, New Relic, LogicMonitor, and ManageEngine Applications Manager; add value. They bring advanced capabilities like AI-powered anomaly detection, hybrid infrastructure coverage, end-user experience tracking, and predictive cost modeling.
The goal of Microsoft Azure monitoring tools is not just raw data collection but actionable insight:
- Detect bottlenecks before they trigger downtime.
- Forecast demand to optimize Azure resource costs.
- Correlate metrics, logs, and traces for faster root cause analysis.
- Maintain compliance with auditable logs and retention policies.
In practice, effective Azure monitoring bridges the gap between cloud telemetry and operational intelligence; ensuring high performance, resilience, and cost-efficiency across IaaS, PaaS, and serverless deployments.
Top Azure monitoring tools
When it comes to Azure cloud monitoring, no single tool fits every enterprise. Each option has strengths, trade-offs, and pricing nuances that make it better suited for certain teams. Here’s a list of the best Azure monitoring tools in the market at the moment:
Azure Monitor
Microsoft’s native monitoring platform for Azure resources. It integrates directly with VMs, databases, storage accounts, and applications.
Pricing: Pay-as-you-go. Metrics are free, logs start at ~$2.76/GB ingested (can add up with heavy logging).
Pros: Tight Azure integration, powerful KQL log analytics, relatively cost-friendly at entry level.
Cons: Complexity rises for cross-resource queries, limited visibility outside Azure.
Best for: Teams running mostly or entirely on Azure who want monitoring without the overhead of third-party tools.
Datadog
A SaaS observability platform with strong AI-driven analytics across Azure and multi-cloud workloads.
Pricing: Starts at ~$15 per host/month. Logs and APM add-ons can escalate costs quickly at scale.
Pros: Excellent distributed tracing, intuitive dashboards, strong ecosystem integrations.
Cons: Costs can balloon with scale, dashboards may overwhelm smaller teams.
Best for: Cloud-native organizations needing cross-cloud visibility and rich APM in one place.
ManageEngine Applications Manager
Unified platform that covers Azure workloads, hybrid infrastructure, and APM. Comes with dashboards, proactive alerts, and automated remediation.
Pricing: Starts at ~$395/year (perpetual license available). Scales from SMBs to large-scale enterprises efficiently.
Pros: End-to-end visibility across Azure and hybrid, built-in cost optimization, proactive monitoring.
Cons: Advanced setups may take time to fine-tune.
Best for: Enterprises juggling Azure, on-prem, and hybrid workloads that need centralized monitoring at a predictable cost.
Dynatrace
Full-stack observability platform with its OneAgent for automated discovery and monitoring of Azure workloads.
Pricing: Starts at ~$21 per host/month. Premium modules (Davis AI, business analytics) add more.
Pros: Automated root cause detection, strong APM with deep dependency mapping.
Cons: Very expensive, requires training for new teams.
Best for: Enterprises ready to invest in advanced AI-driven observability for large-scale Azure environments.
New Relic
Unified observability covering metrics, logs, traces, and events in a single pane.
Pricing: Free tier (100 GB ingest/month). Paid plans start ~$49/user/month. Costs rise with ingest volume.
Pros: Rich APM, customizable dashboards, developer-friendly tool-chain integrations.
Cons: Expensive at scale, many advanced features gated behind higher tiers.
Best for: Engineering-heavy teams that want flexibility and hands-on control over monitoring data.
LogicMonitor
Built for hybrid environments; auto-discovers resources and reveals blind spots before they impact performance.
Pricing: Quote-based, typically ~$20–$25 per device/month.
Pros: Agentless monitoring, strong hybrid support, reliable alerting.
Cons: UI feels dated, customization requires effort.
Best for: IT-heavy organizations running hybrid or multi-vendor setups where agentless monitoring is valuable.
Best practices for Azure monitoring

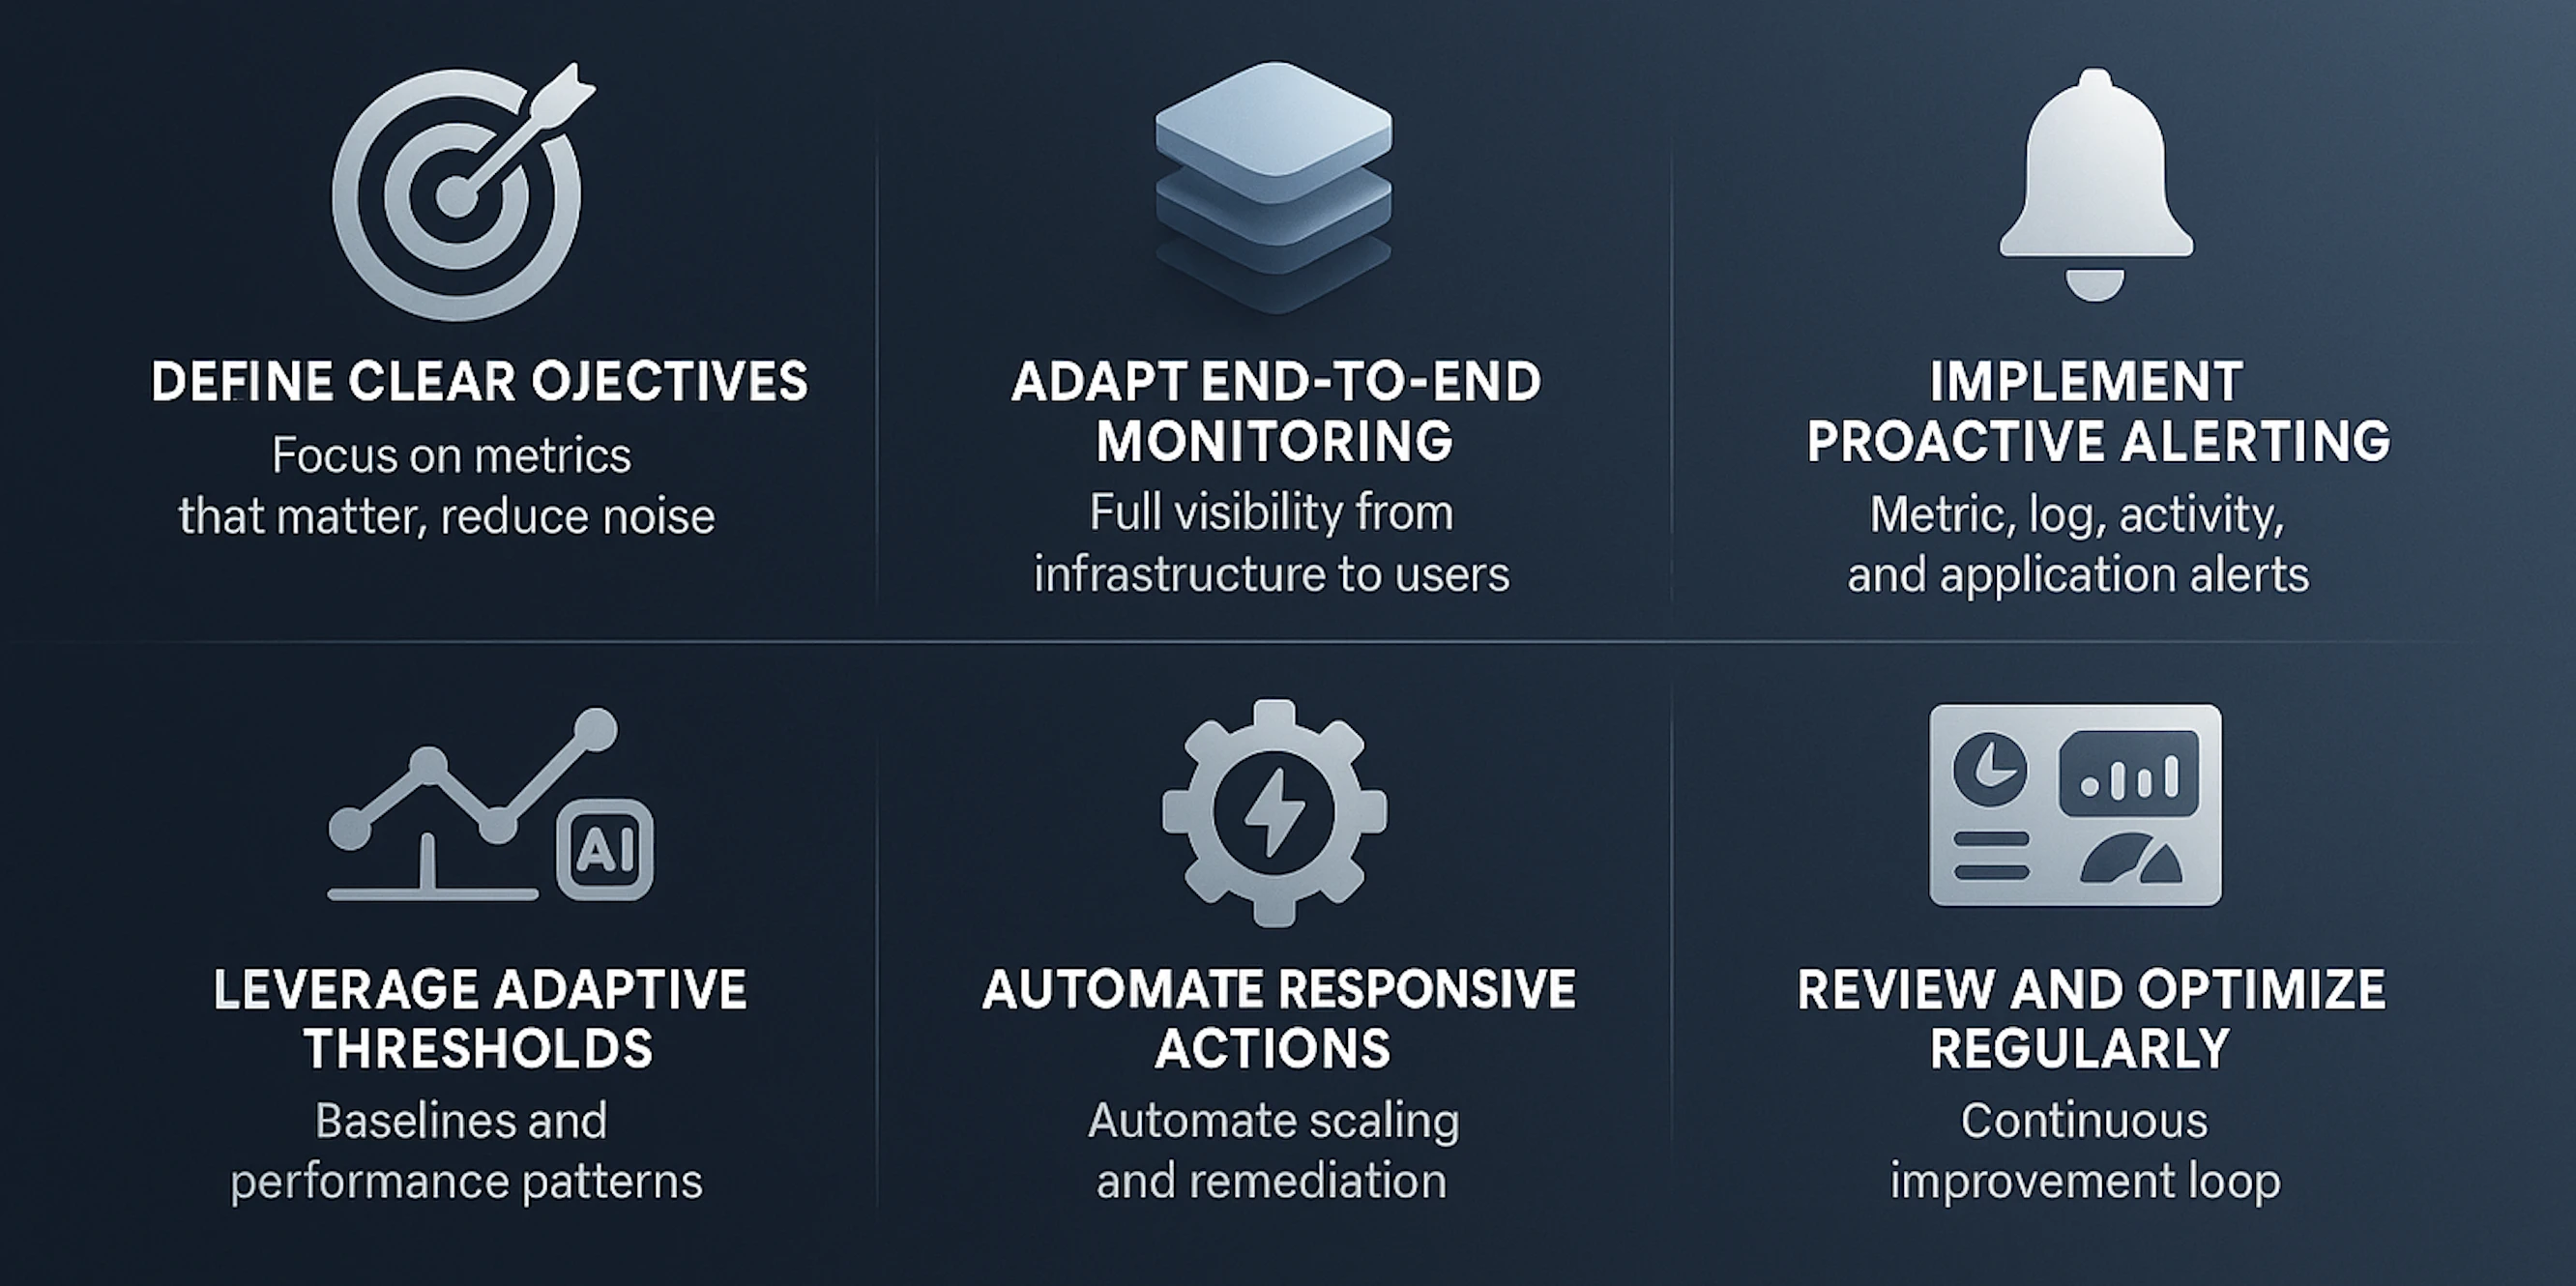
Define clear objectives
Before deploying any monitoring solution, be explicit about what you want to achieve. Identify whether your focus is on application performance, infrastructure health, security, compliance, or cost optimization. Clear objectives ensure monitoring focuses on the metrics that matter most to the business. But on their own, they don’t silence the noise. To tackle alert fatigue, objectives need backup from smart baselines, contextual thresholds, and correlation that filters signals from clutter.
Adapt end-to-end monitoring
Azure monitoring is most effective when it spans the full stack: from infrastructure and networking to applications and end-user experience. Covering VMs, App Services, databases, storage, and external dependencies ensures no blind spots exist. End-to-end visibility enables you to correlate issues across layers and address the root cause, not just symptoms.
Implement proactive alerting
Reactive monitoring slows recovery. To stay ahead, configure proactive alerts that flag issues before they affect users. In Azure monitoring, alerts typically fall into these categories:
- Metric alerts: These are triggered when performance counters like CPU, memory, disk latency, or network throughput cross defined thresholds.
Example: CPU usage > 85% for 5 minutes. You configure these in Azure Monitor by selecting the resource, defining the metric, setting conditions, and choosing an action group. - Log alerts:These alerts are generated from queries in Log Analytics.
Example: Repeated authentication failures in the last 10 minutes. You configure these by writing KQL queries and scheduling them to run at defined intervals. - Activity log alerts: These are triggered by management operations such as VM creation, resource deletion, or policy violations. You configure these by selecting the activity log signal type and applying filters.
- Application insights alerts: These are alerts about failed requests, dependency failures, or slow response times. You configure these within Application Insights with thresholds or anomaly detection.
Once alerts are created, route notifications through action groups like Teams, Slack, email, SMS, or webhook integrations to ensure the right team gets notified instantly.
Proactive alerting keeps applications available, prevents small issues from snowballing, and ensures user experience stays smooth even under pressure.
Leverage adaptive thresholds
Establish normal operating ranges for all key metrics to identify deviations quickly. Historical performance data helps detect trends, seasonal spikes, slow components, or gradual degradation. Baselines turn raw metrics into actionable insights, so IT teams can prioritize real issues over expected fluctuations.
Automate responsive actions
Integrate monitoring with automation to handle repetitive tasks and immediate remediation. Actions like scaling App Service Plans, restarting services, escalations, or executing scripts in response to alerts minimize downtime and reduce manual intervention. Automation ensures consistent and timely responses, maintaining performance during peak loads.
Review and optimize regularly
Monitoring isn’t a one-time task. Continuously analyze dashboards, reports, and alert histories to refine thresholds, and identify cost-saving opportunities. Regular reviews improve efficiency, enhance resource utilization, and ensure that your Azure monitoring setup evolves with your growing cloud environment.
ManageEngine Applications Manager: A deeper look
Unified visibility
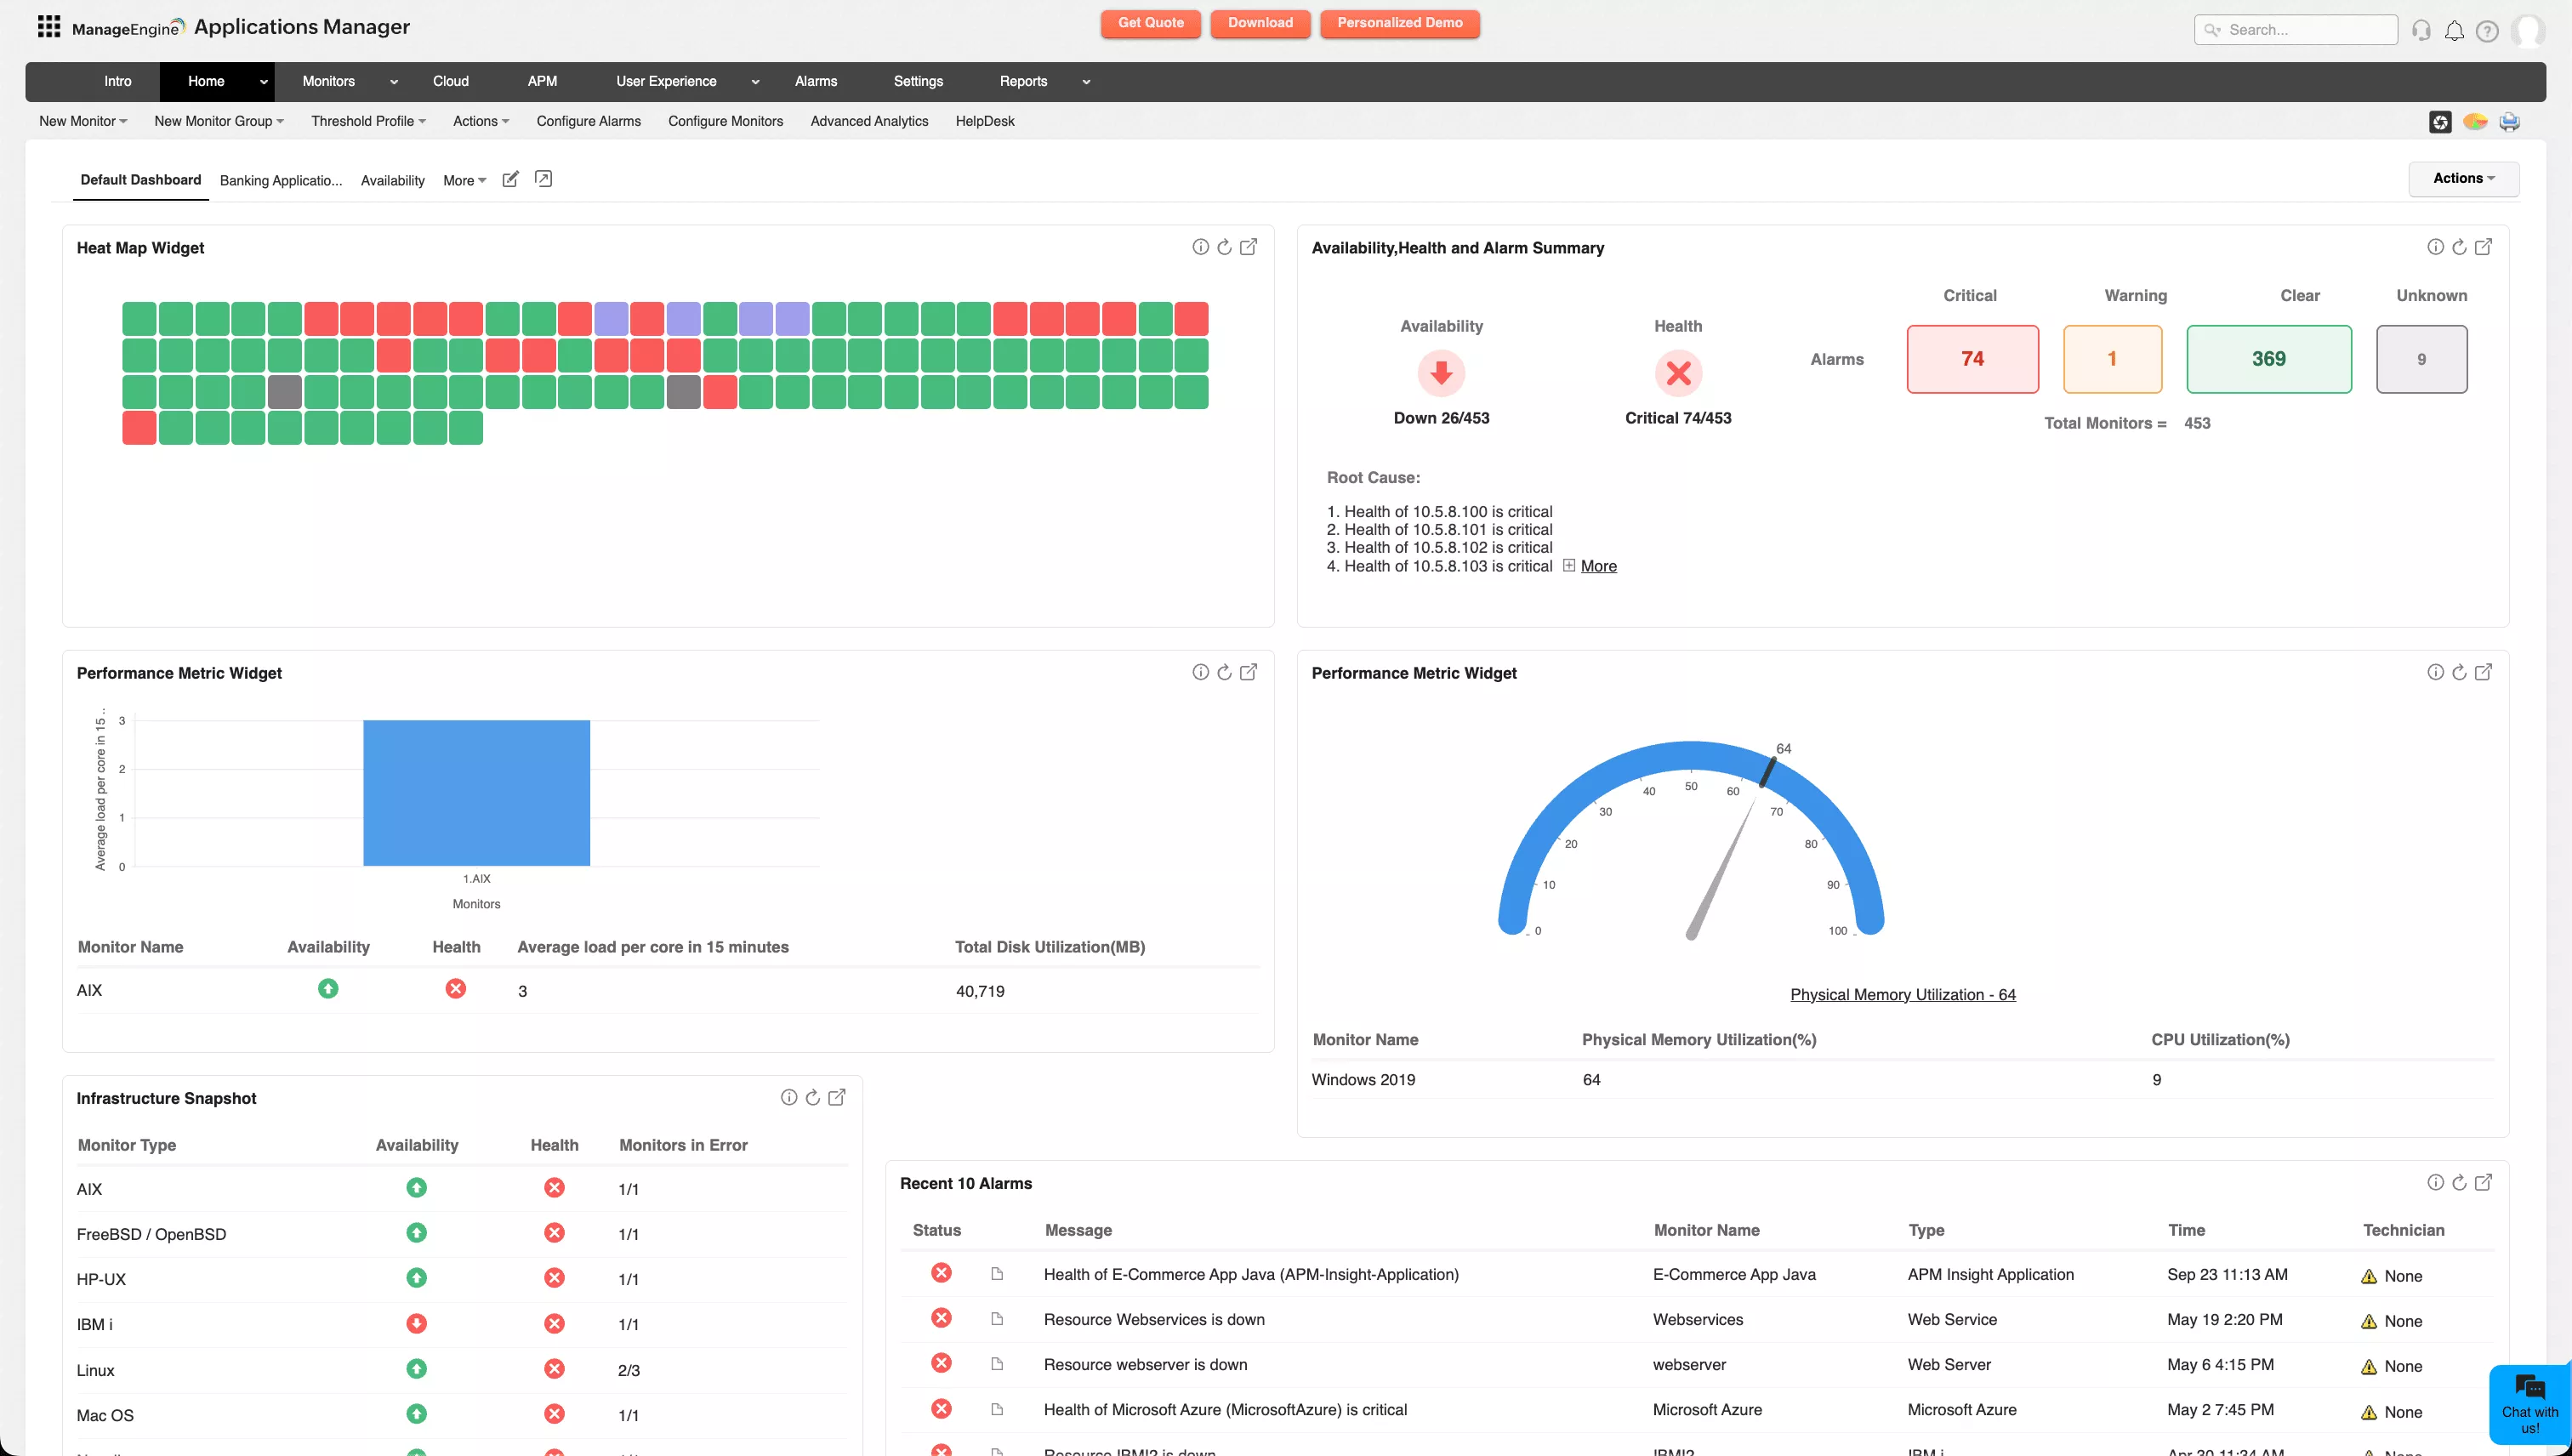
Applications Manager consolidates Azure App Services, VMs, databases, storage accounts, and load balancers into one unified dashboard. Instead of switching between multiple Azure portals, IT teams gain a single pane of glass view of the entire environment.

It allows admins to customize widgets according to priority and accessibility over multiple views throughout the cloud and application infrastructure. This unified visibility reduces complexity, speeds up root cause analysis, and ensures that no critical resource is overlooked.
Automated discovery
Azure environments evolve rapidly, with new services spinning up daily. Applications Manager automates the discovery of new resources, ensuring monitoring coverage keeps pace with dynamic deployments. This reduces blind spots and eliminates the risk of critical workloads going unmonitored.
Deep performance data analysis
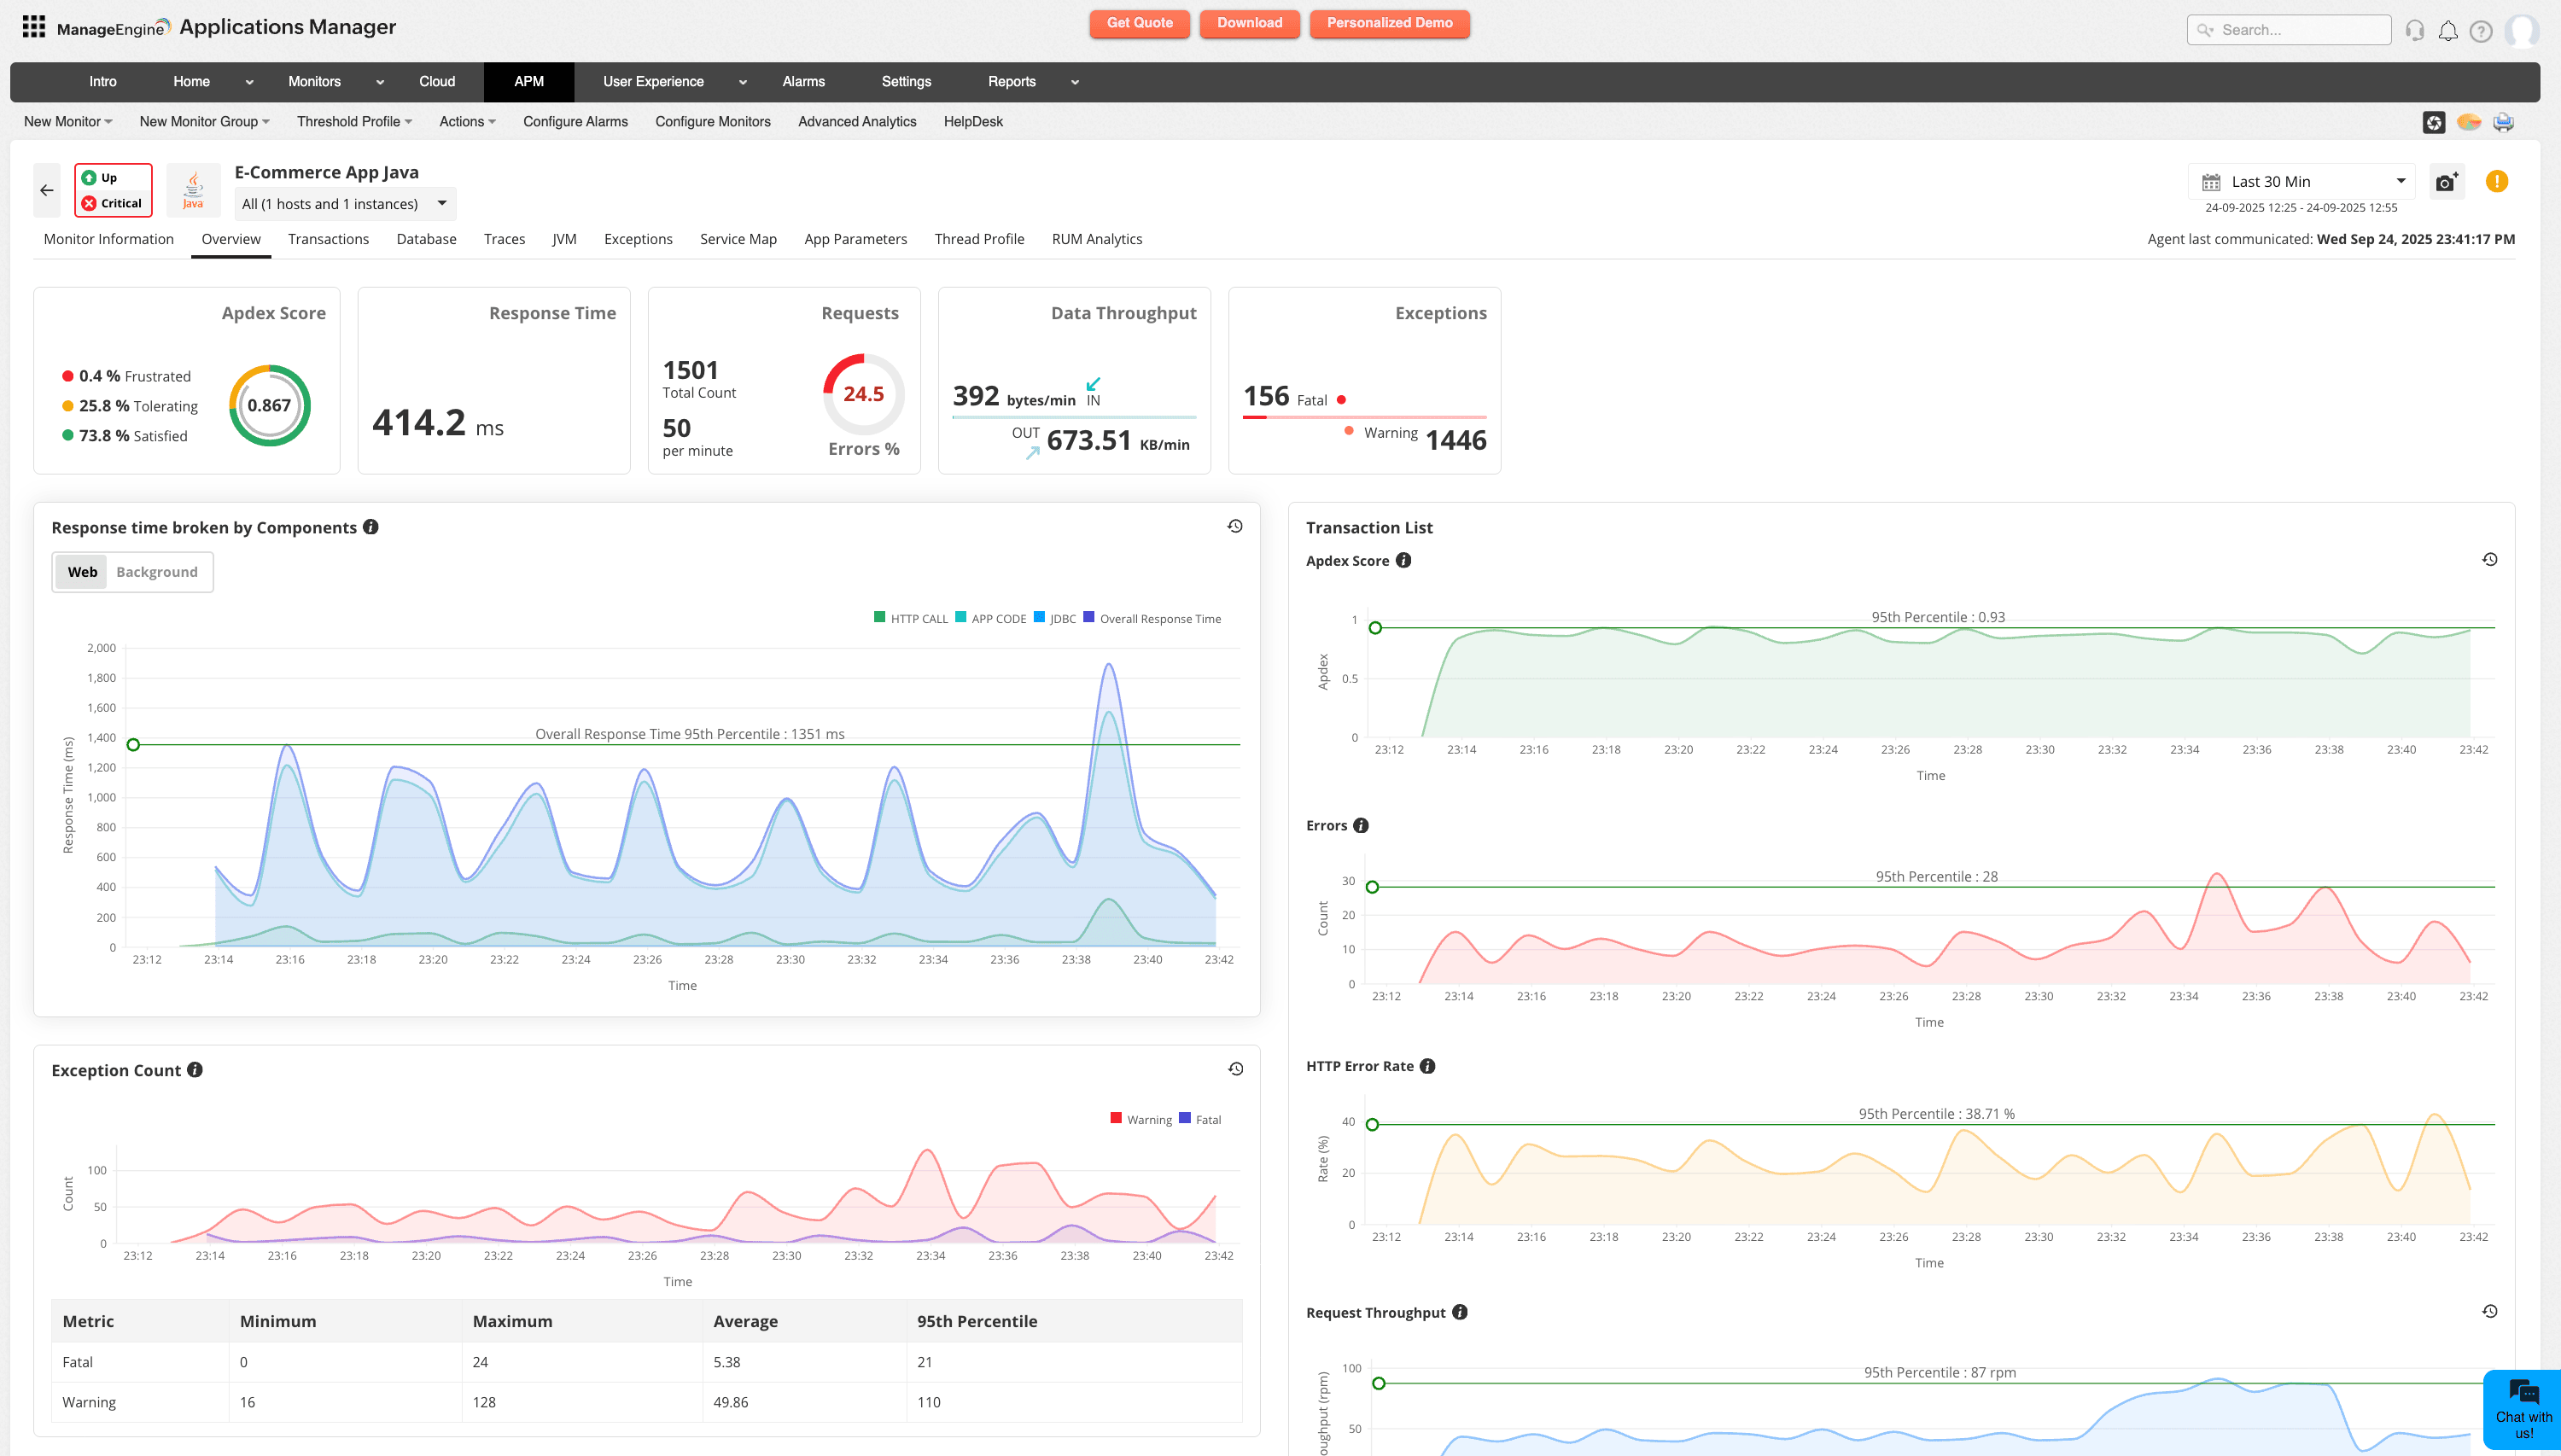
Beyond basic health checks, Applications Manager delivers deep visibility into performance trends and service dependencies. It monitors critical metrics like response times, throughput, error rates, database queries, resource utilization, and transaction traces across applications, databases, and infrastructure. By capturing both real-time and historical data, it locates where bottlenecks are forming and surfaces patterns early. This allows teams to act before minor slowdowns escalate into service disruptions.
Smarter alerting and responsive actions
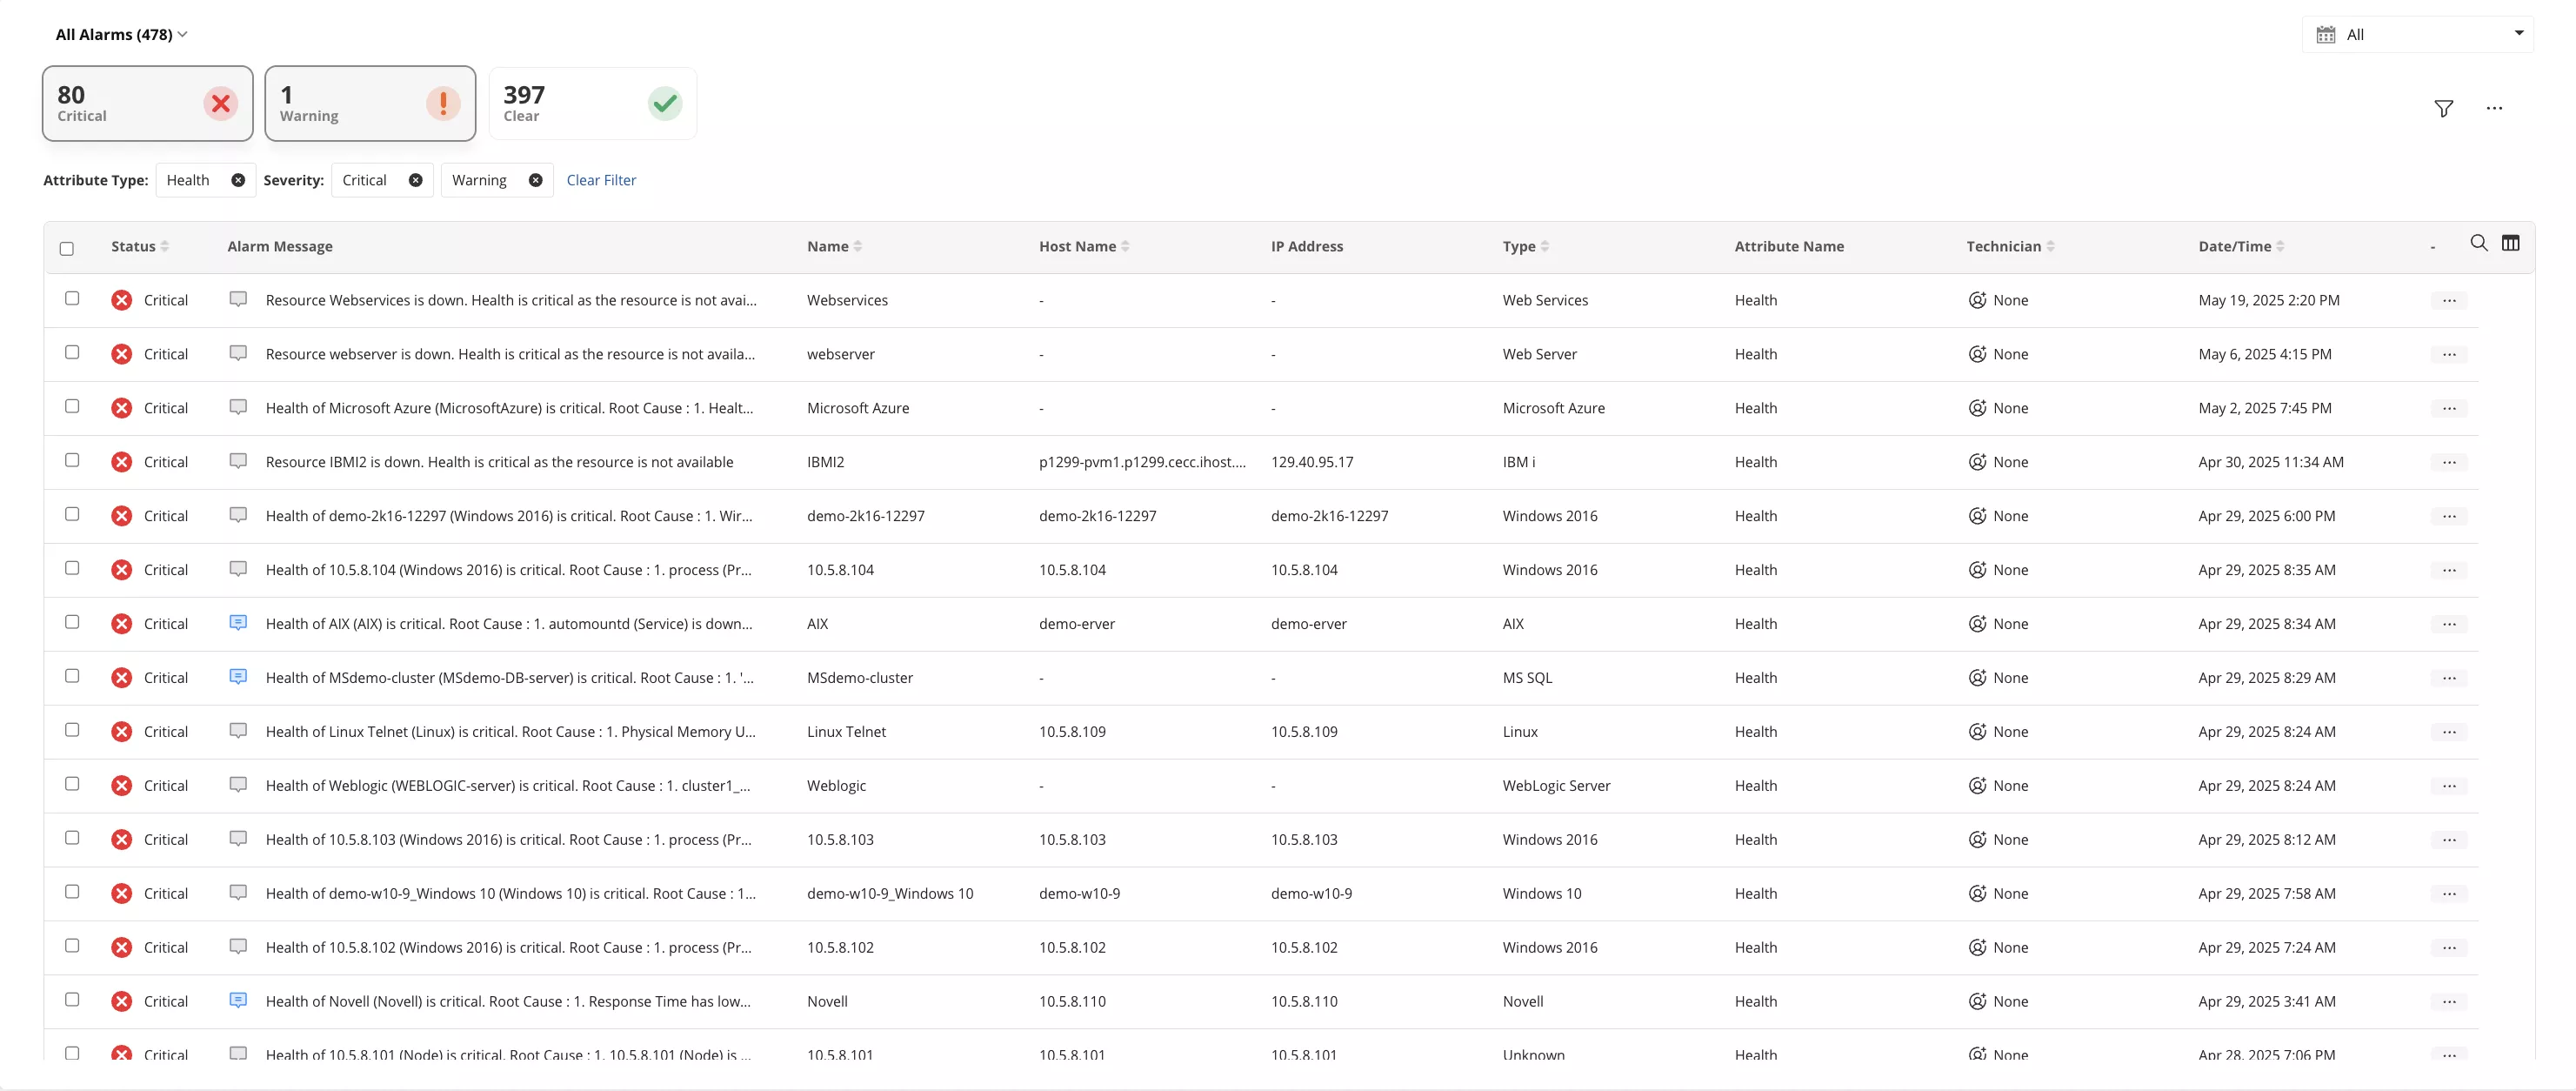
When alert noise isn’t managed, critical alarms get overlooked and anomalies slip by. Applications Manager allows you to classify your alerts based on severity, assign adaptive thresholds for dynamic KPIs, configure automated responses and enable proactive monitoring in your Azure cloud. It also enhances cross-channel alerting by integrating with multiple channels like e-mail, SMS, Slack and Teams.

By pairing smart alerts with futuristic reports on performance, availability, and usage, Applications Manager supports both day-to-day troubleshooting and long-term compliance needs. This makes Azure monitoring less reactive and more data-driven, enabling teams to focus on improvement instead of constant firefighting.
Better user experience
End-user experience is often the first casualty of slowdowns or outages. Applications Manager proactively tracks latency, response times, and error rates across the application stack. By correlating backend issues with frontend performance, it ensures that customers experience smooth, uninterrupted services; even during peak traffic. This translates directly into better satisfaction and fewer abandoned sessions.

Forecasting and capacity planning
With built-in trend analysis and forecasting, Applications Manager helps predict when workloads will exceed resource thresholds. This foresight allows teams to scale Azure resources before demand spikes or seasonal surges cause performance degradation. Proactive capacity planning ensures that growth does not come at the cost of downtime.
Cost optimization
Cloud overspending often happens quietly. Applications Manager identifies underutilized or idle Azure resources, highlights inefficient scaling policies, and generates insights for right-sizing infrastructure. By tying monitoring data to cost visibility, businesses can keep Azure expenses under control while maintaining high performance. Learn more.

Curious about how Applications Manager performs in real-world environments? Check out Gartner Peer Insights to hear directly from users. After all, effective Azure monitoring isn’t just about visibility; it’s about ensuring performance, availability, and cost control among dynamic Azure cloud environments. While Azure Monitor covers the basics, Applications Manager delivers unified, enterprise-grade observability across hybrid cloud environments.

