Attribute Reports
Attribute reports help to obtain the attribute specific data for multiple monitors. The different types of data displayed in this report includes:
- Monitor name
- Resource Type name
- Minimum of the value collected during the selected period
- Maximum of the value collected during the selected period
- Total of the value collected during the selected period
- Average of the values collected during the selected period
- 95th percentile of the collected values
Note:
- Total of the value collected during the selected period data will be available only for Counter attributes.
- Resource Type Name data is available for Tabular metrics only.
These reports are available for different monitor types including Monitor groups, Servers, Application servers, Database servers and Web servers. Before proceeding, make sure that you have enabled reports for all the monitors. You can get reports over various customized time periods. The attribute reports can be exported in .pdf, excel, CSV and e-mail formats.
Types of Graphs in Attribute reports
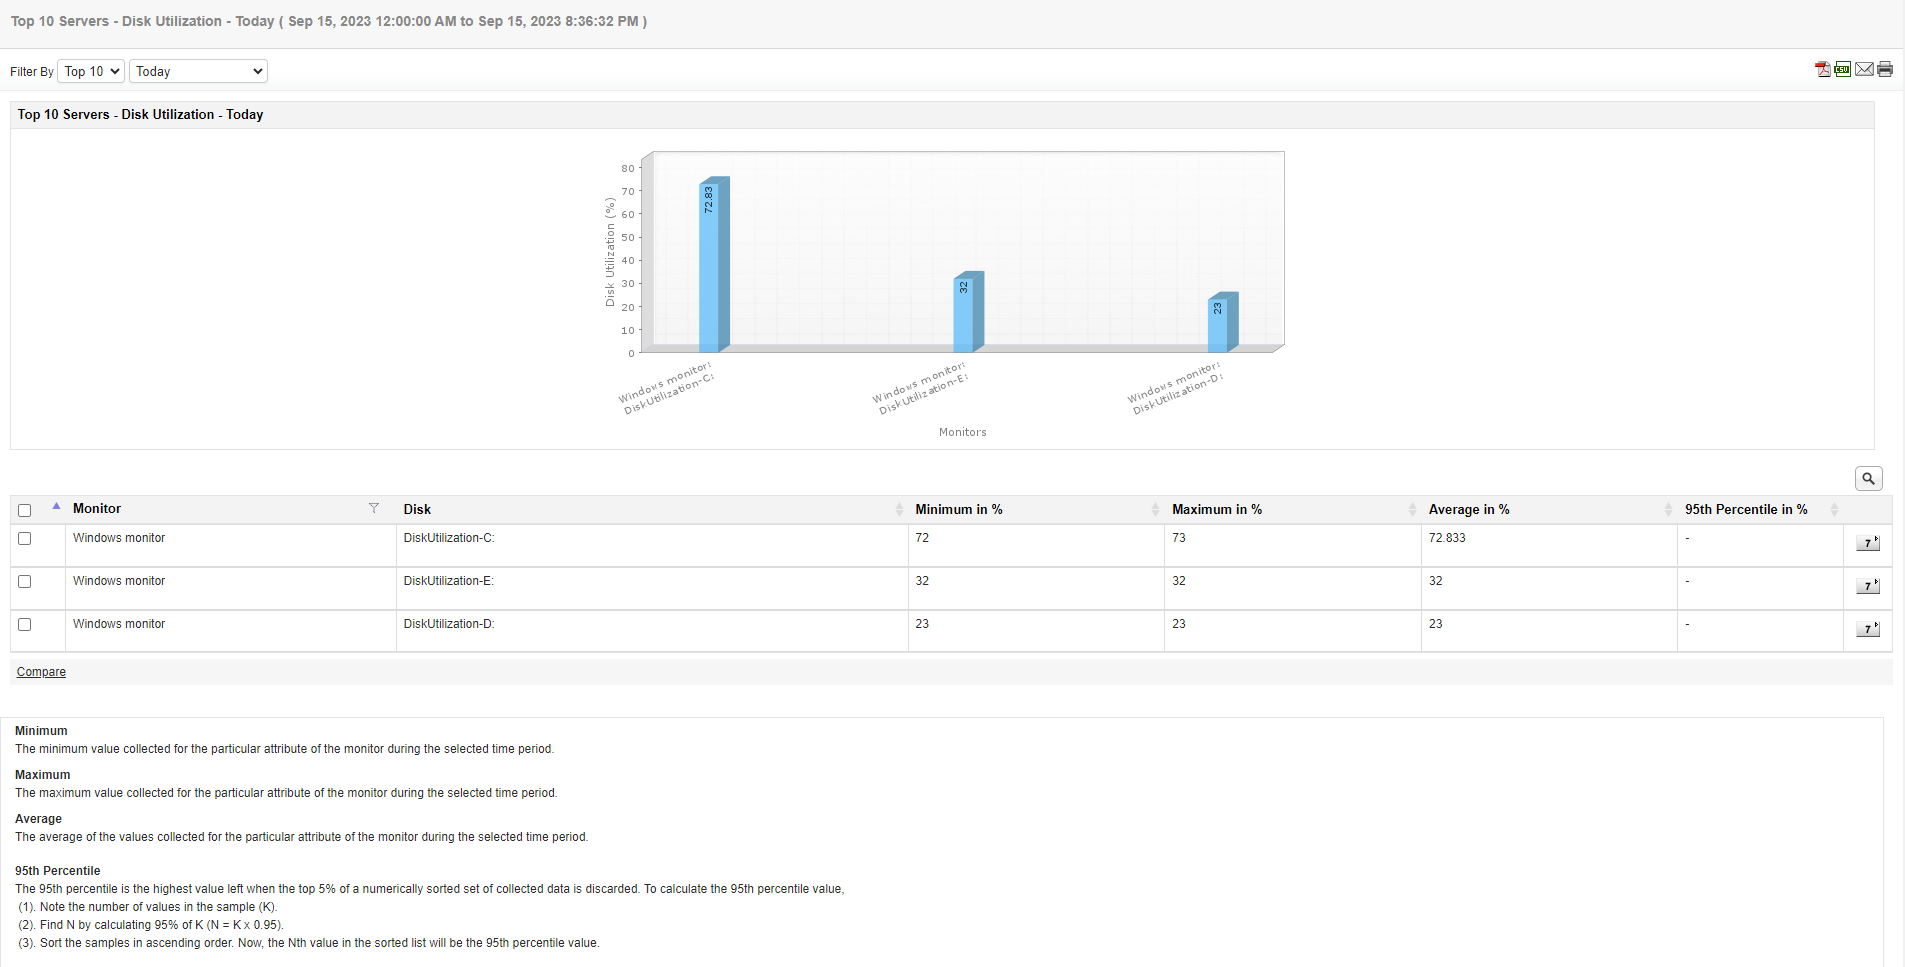
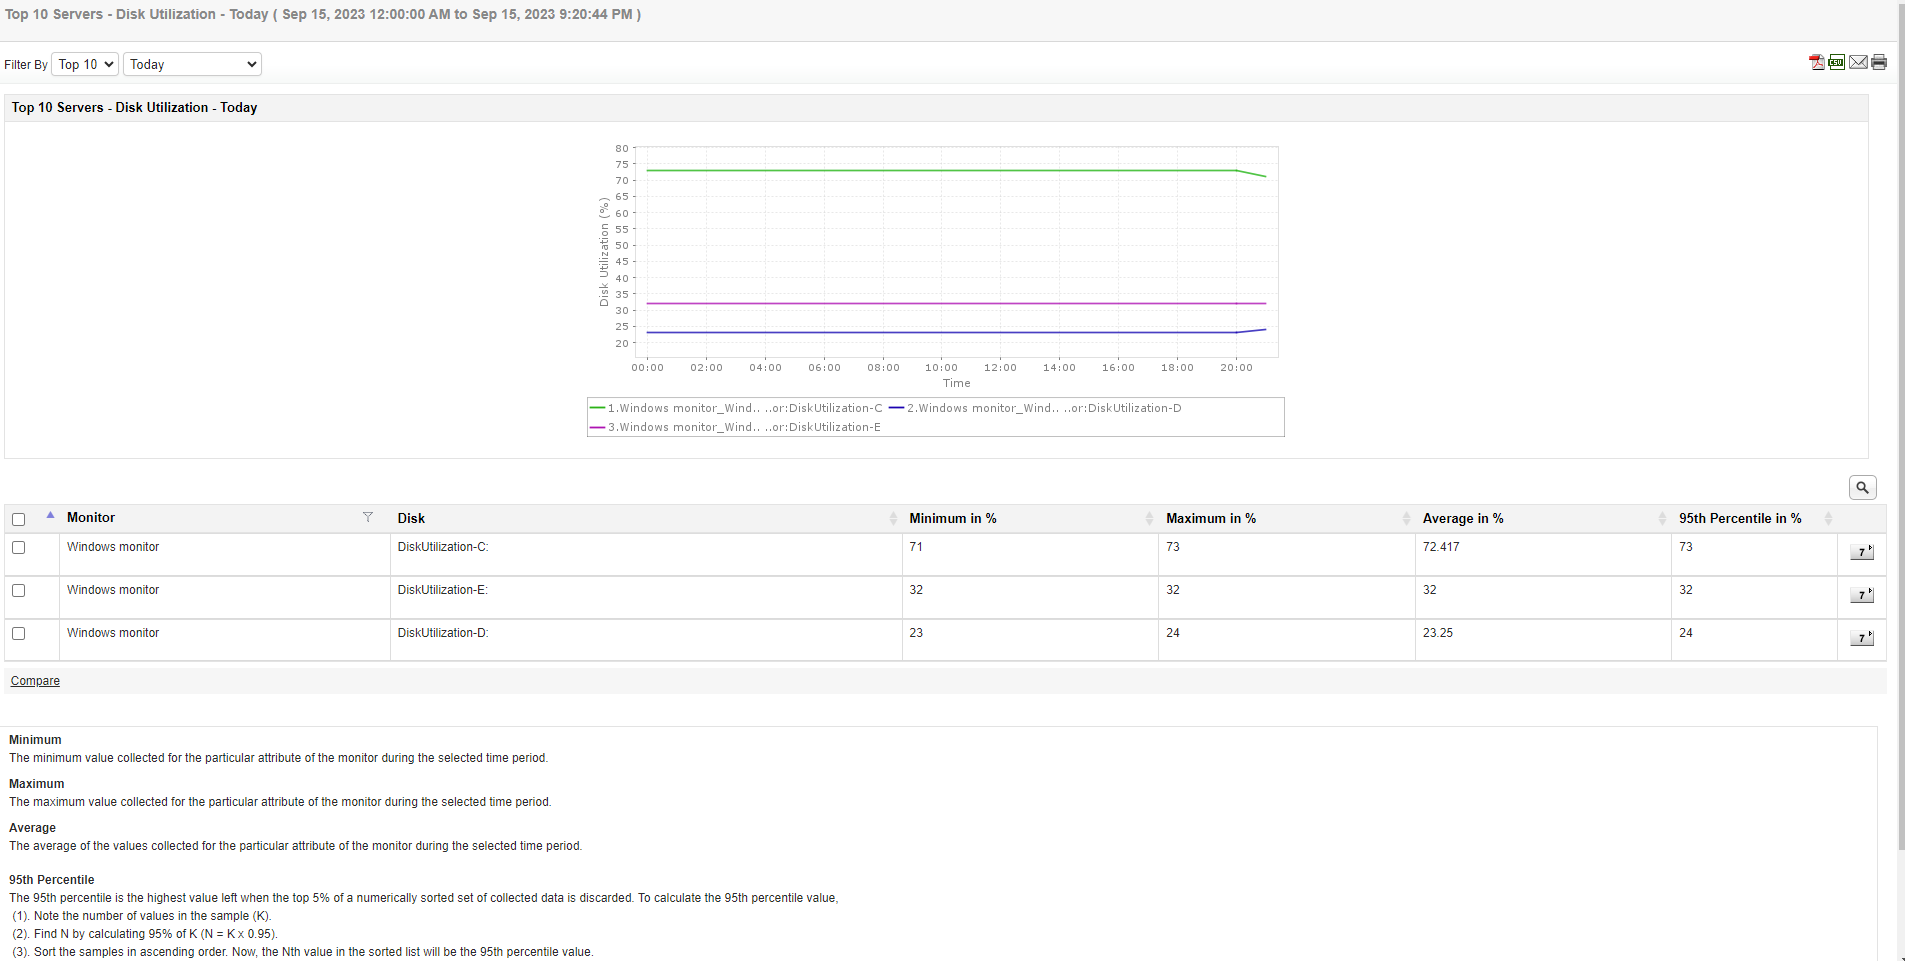
In Attribute report, graphs displayed can be of two types; Line graph or Bar graph. Bar graph is selected by default. To configure Graph type, navigate Settings → Report Settings.
- Line graph in Attribute reports:
- Bar graph in Attribute reports: