# APM Insight Business Transaction widget
## Overview
APM Insight Business Transaction widget lets you add custom metric visualization widgets to any dashboard in Applications Manager. Each widget displays performance trends and statistics for the resources you monitor, showing how metrics like **Response Time**, **Throughput**, and **Error Rate** change over time through interactive charts and summary values.
Build widgets by selecting **resources** (Applications, Instances, Transactions), choosing **metrics** to track, picking a **graph type** (Individual, Stacked, Consolidated), and applying an **aggregation method** (Average, Min, Max, Sum, Count) over a configurable time period. The builder currently supports **APM Insight metrics** (Application Performance Monitoring).
With the APM Insight Business Transaction widget, you can visualize:
- **Metric trends:** Line, Area, and Bar charts that plot metric values over a selected time period, helping you spot patterns, spikes, and degradations.
- **Metric statistics:** Text widgets that display a single aggregated number (Average, Minimum, Maximum, or Sum) for quick health checks without a chart. With the **Count** aggregation, a Text widget instead displays the number of resources that match the widget's resource filter.
- **Multi-resource comparison:** View metrics across multiple resources side-by-side (Individual), combined into one aggregated line (Consolidated), or layered on top of each other (Stacked).
- **Per-resource drill-down:** Click a value in a widget to open a drill-down panel that shows the individual, per-resource values behind the aggregated chart or number.
- **Metric-based resource filtering:** Use Advanced Filters to include only the resources whose metric values meet a condition, such as Response Time greater than 500 ms, within the widget's time period.
## Accessing the APM Insight Business Transaction widget
To open the APM Insight Business Transaction widget:
- Navigate to any **Dashboard** under the **Home** tab.
- Click **Actions → Add Metric Widget(s)**.
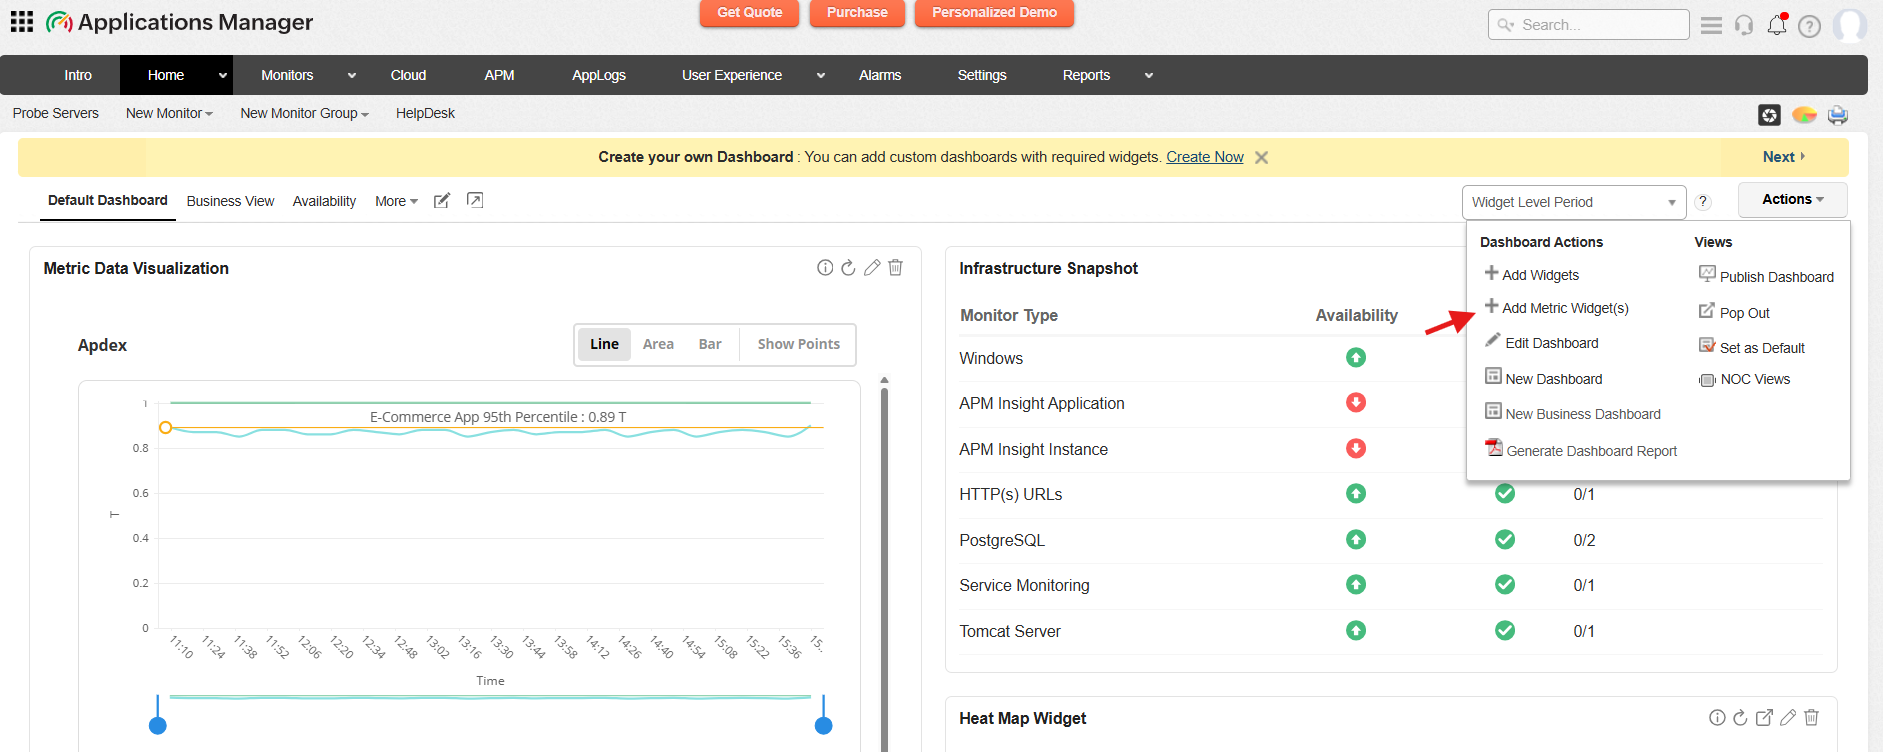
The APM Insight Business Transaction widget page loads with empty filter dropdowns. Configure the filters step by step to define your widget.
The builder walks you through a guided filter flow. Each selection narrows the next:
- **Resource Type** - What kind of resource? (Application, Instance, Transaction)
- **Metric Type** - Which metric category? (Top Level, Transaction, Second Level)
- **Metrics** - Which metrics to plot? (select one or more)
- **Chart Type** - How to visualize? (Line, Area, Bar, or Text)
- **Graph Type** - How to group resources? (Individual, Consolidated, or Stacked)
- **Aggregation** - How to summarize? (Average, Maximum, Minimum, Sum, or Count). When **Count** is selected, the Metric, Time Period, Graph Type, and Percentile filters are hidden because they do not apply to resource counting.
- **Time Period** - Over what range? (Last 30 Minutes to Last 7 Days, or Custom)
- **Resources** - Which specific resources? (pick individually or use Advanced Filters, which can include conditions on metric values)
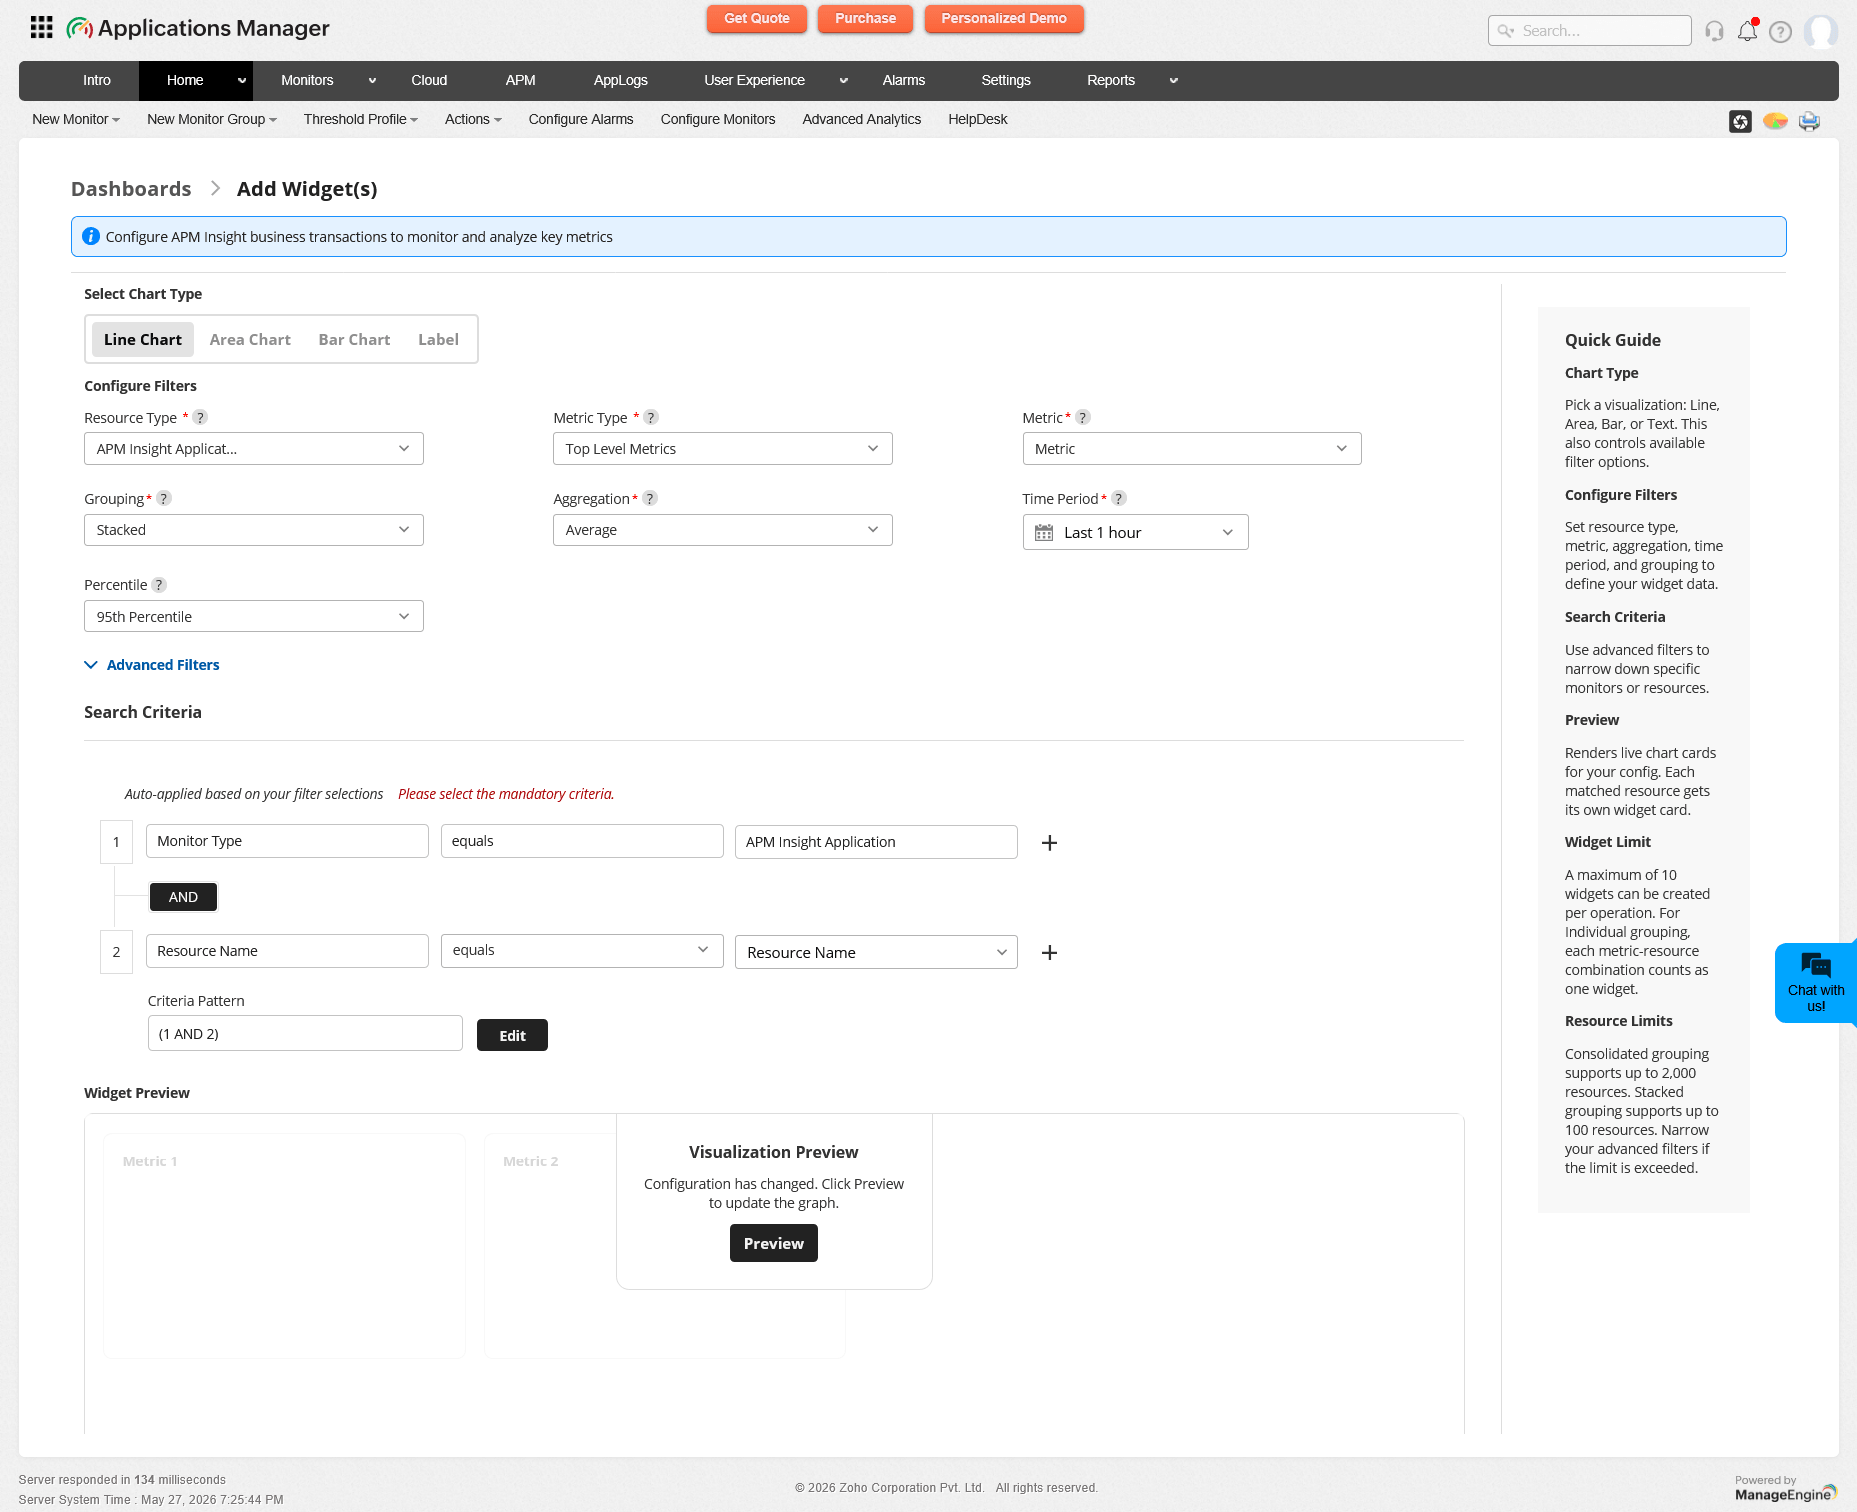
Once configured, preview your widgets with live data, then save. Up to **10 widgets** per session can be added to the dashboard in one go.
**Note:**
- Users with **Admin** and **Delegated Admin** roles can access the APM Insight Business Transaction widget.
- Users with a **Demo** role can configure and preview widgets, but saving is blocked.
## Selecting resource type
The resource type defines the category of monitored entities whose metrics the widget will display. Select a resource type from the **Resource Type** dropdown to begin configuring the widget.
| Resource Type | Description |
|---|---|
| APM Insight Application | Application-level monitoring - the top-level entity in APM Insight. Metrics include Response Time, Throughput, Error Rate, and Apdex Score. |
| APM Insight Instance | Individual application instances (JVMs, Node.js processes). Metrics include Heap Usage, CPU Time, GC Count, and Thread Count. |
| APM Insight Transaction | Web transactions (URLs, API endpoints) within an application. Metrics include Transaction Response Time, Error Count, and Call Count. |
**Note:** Changing the resource type resets the **Metric Type** and **Metric** dropdowns. The dependent fields reload automatically based on the selected resource type.
## Selecting metric type and metrics
### Metric type
After selecting a resource type, choose a **Metric Type** to filter the available metrics:
- **Top Level Metrics:** High-level performance metrics such as Response Time, Throughput, and Error Rate.
- **Transaction:** Transaction-specific metrics that track individual web transactions and API endpoints.
- **Second Level Metrics:** Deeper performance metrics for detailed analysis beyond the top-level indicators.
Changing the metric type resets the metrics dropdown and reloads it with the relevant options.
### Metrics
Select one or more metrics from the **Metrics** dropdown. The dropdown supports multi-select, allowing you to choose multiple metrics to visualize in a single session.
**Note:**
- You can select up to **10 metrics** at a time. Once the limit is reached, additional options are disabled until you deselect an existing metric.
- The total number of widgets produced (based on the combination of metrics, resources, and graph type) must not exceed **10**.
## Chart types
The APM Insight Business Transaction widget supports four chart types, each suited for different visualization needs. Select a chart type from the **Chart Type** dropdown.
| Chart Type | Description | Best For |
|---|---|---|
| Line | Displays time-series data as continuous lines connecting data points over time. Uses a continuous time axis with crosshair tooltips. | Trend analysis, multi-metric comparison |
| Area | Similar to Line charts, but with a semi-transparent fill (40% opacity) under the curve. Provides a visual sense of volume. | Volume trends, stacked resource comparison |
| Bar | Renders data as vertical bars at each time interval. Uses discrete (ordinal) time labels on the x-axis. | Discrete interval comparison |
| Text | Displays a single aggregated numeric value (no chart). Shows a large centered number with the metric unit. The widget is wider (3 columns) than chart widgets. | KPI dashboards, single-value monitoring |
### Aggregation availability by chart type
| Feature | Line | Area | Bar | Text |
|---|---|---|---|---|
| Time-series data | Yes | Yes | Yes | No |
| Aggregate data | No | No | No | Yes |
| Multiple series | Yes | Yes | Yes | No |
| 95th percentile threshold | Yes | Yes | No | No |
| Legend table (Min/Max/Avg/Percentile) | Yes | Yes | Yes | No |
| Drill-down view | Yes | Yes | Yes | Yes |
| SUM aggregation | No | No | No | Yes |
| COUNT aggregation | No | No | No | Yes |
**Note:** If you select the **Text** chart type with a **Stacked** graph type, the graph type will automatically correct to **Consolidated**, since Stacked is not valid for Text widgets.
## Graph types (grouping)
The graph type determines how the chart groups resources and directly affects how many widgets it creates. Select a graph type from the **Graph Type** dropdown.
| Graph Type | Description | Widgets Created |
|---|---|---|
| Individual | Each widget shows data for **one resource**. A separate widget is created for every metric and resource combination. | Metrics × Resources
*Example:* 2 metrics × 3 resources = **6 widgets** |
| Consolidated | All selected resources are **merged into one aggregated series** per metric. Creates one widget per metric. | Metrics
*Example:* 2 metrics × 3 resources = **2 widgets** |
| Stacked | Resources are rendered as **stacked layers** within a single chart. Creates one widget per metric. | Metrics
*Example:* 2 metrics × 3 resources = **2 widgets** |
**Widget count decomposition example** (2 metrics × 3 resources, Individual graph type):
| Widget | Metric | Resource | Chart |
|---|---|---|---|
| Widget 1 | Response Time | app-server-01 | Line |
| Widget 2 | Response Time | app-server-02 | Line |
| Widget 3 | Response Time | web-proxy-03 | Line |
| Widget 4 | Request Count | app-server-01 | Line |
| Widget 5 | Request Count | app-server-02 | Line |
| Widget 6 | Request Count | web-proxy-03 | Line |
**Note:**
- The total number of widgets per session must not exceed **10**. If the combination exceeds the limit, a validation error is displayed, and you must reduce your selection.
- For the **Text** chart type, the **Stacked** option is not available. Only Individual and Consolidated are shown.
## Aggregation options
The aggregation type determines how the system combines multiple data points when computing values across time buckets. Select an aggregation from the **Aggregation** dropdown.
| Aggregation | Description | Use Case |
|---|---|---|
| Average | Mean value across the bucket interval. | Response time trends (smooths out spikes) |
| Maximum | Highest value in each time bucket. | Peak detection, worst-case monitoring |
| Minimum | Lowest value in each time bucket. | Baseline monitoring |
| Sum | Total sum of values in each time bucket. **Available only for Text chart type.** | Request count, error count |
| Count | Number of resources that currently match the widget's resource filter. Metric values are not aggregated. **Available only for Text (Label) widgets.** | "How many resources are in this state" widgets |
### COUNT aggregation for Metric Visualization Widgets
A new aggregation type, **COUNT**, has been added alongside the existing Average, Maximum, Minimum, and Sum options.
When COUNT is selected, the widget does not aggregate a metric's values. Instead, it displays the number of resources that currently match the widget's configured resource filter. The count represents how many resources are resolved by the widget's search criteria (name filters, group filters, or advanced search conditions). This is intended for "how many resources are in this state" style widgets.
- COUNT is available only for the **Text (Label)** widget.
- When COUNT is selected, the **Metric**, **Time Period**, **Graph Type**, and **Percentile** filters are automatically hidden in the filter panel, since they are not applicable for resource counting.
- The unit is displayed as **Count**.
- If a threshold configuration exists, the threshold status (**Critical** / **Warning** / **Normal**) is evaluated against the resource count value.
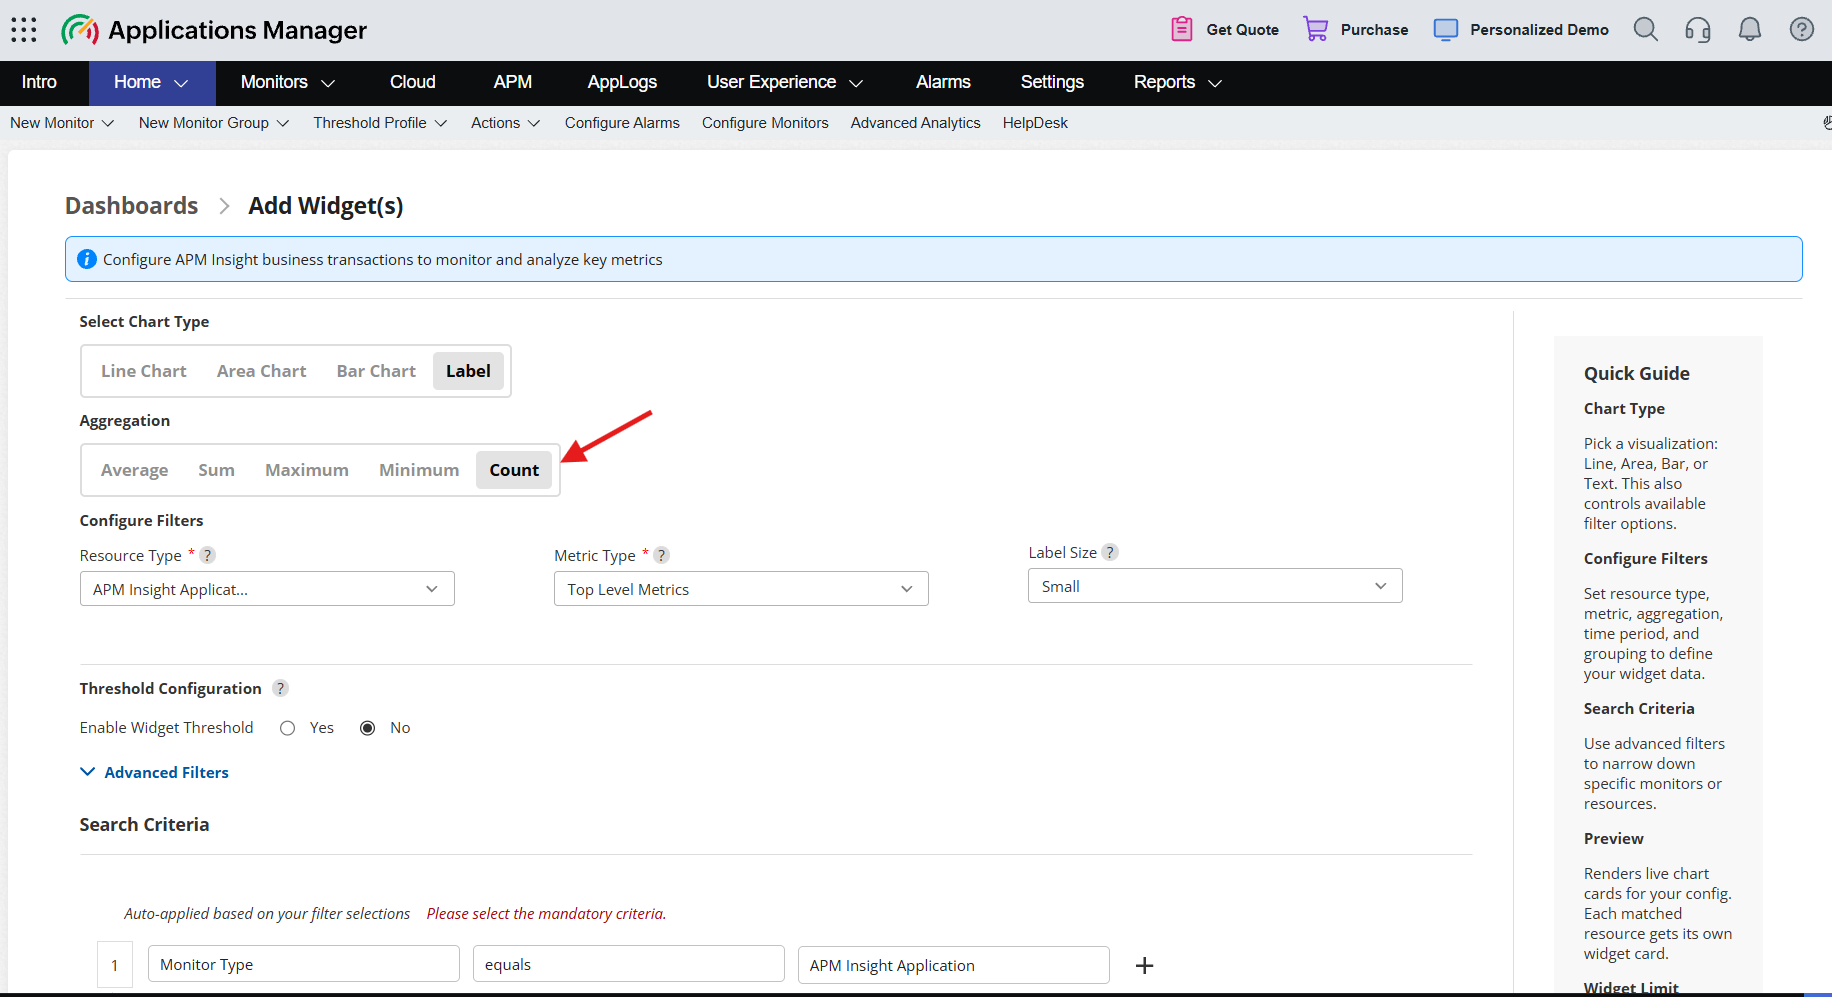
Combined with [attribute-based filtering](https://www.manageengine.com/products/applications_manager/help/insight-business-transaction-widget.html#attribute-based-filtering), COUNT lets you build widgets such as "number of applications with Response Time above 1000 ms". The displayed count updates automatically as resources cross the threshold within the configured time period.
## Time period selection
The time period controls the date/time range for which metric data is fetched. Select a preset range or specify a custom period from the **Time Period** dropdown.
### Preset ranges
| Time Period | Range |
|---|---|
| Last 30 Minutes | Now − 30 minutes to Now |
| Last 1 Hour | Now − 1 hour to Now |
| Last 3 Hours | Now − 3 hours to Now |
| Last 6 Hours | Now − 6 hours to Now |
| Last 12 Hours | Now − 12 hours to Now |
| Last 24 Hours | Now − 24 hours to Now |
| Yesterday | Yesterday 00:00 to 23:59 |
| Last 7 Days | Now − 7 days to Now |
| Custom Range | User-defined start and end date/time |
### Dashboard-level time period override
When a dashboard has its own time period set, the dashboard time period overrides the individual widget's saved time period at render time. If the dashboard time period is set to **Widget Level Period**, each widget uses its own saved time period.
## Resource selection
Choose which specific resources the widget should display data for. There are two modes of resource selection:
- **Manual selection:**
Pick specific resources from the Resources dropdown. Select one or more resources to include in the widget.
- **Advanced Filters:**
Toggle the Advanced Filters option to define dynamic filter criteria instead of selecting resources manually. When Advanced Filters are enabled, the manual resource dropdown is hidden.
Advanced Filters let you build search criteria using conditions such as:
- **Name equals** - Match resources with an exact name (e.g., name = "MyApp").
- **Name contains** - Match resources containing a keyword (e.g., name contains "Server").
- **Name not equals** - Exclude resources by name.
- **Attributes** - Match resources by the value of a monitored metric within the widget's time period (e.g., Response Time Greater Than 500). See [Attribute-Based (Metric Threshold) Filtering in Widget Builder](https://www.manageengine.com/products/applications_manager/help/insight-business-transaction-widget.html#attribute-based-filtering).
You can combine multiple filter conditions using **AND** / **OR** operators to build complex criteria.
After defining the filter criteria, the system resolves matching resources dynamically. A message indicates the number of matched resources (e.g., *"5 resource(s) matched the filter criteria."*). Click **View Resources** to see the matching resources in a data table with columns for display name, type, IP address, resource ID, and probe display name.
**Note:**
- When Advanced Filters are used, the criteria are re-evaluated each time the widget renders on the dashboard. New resources that match the criteria in the future are automatically included. If the criteria include attribute conditions, resources are also added or removed as their metric values cross the specified threshold.
- A mandatory **TYPE** filter is auto-added based on the selected resource type and cannot be removed.
- If the criteria match **0 resources**, an informational message is displayed: *"No resources found matching the selected criteria. Adjust your advanced filters and try again."*
### Attribute-Based (Metric Threshold) Filtering in Widget Builder
The Advanced Search in Widget Builder includes a dynamic **Attributes** filter group that lets you filter resources by the value of a monitored metric within the widget's configured time period, not just by their name or group.
For example, if you select **APM Insight Application** as the resource type, attributes such as Response Time, Apdex Score, Throughput, CPU Utilization, Heap Memory Usage, and Error Rate are available. You can then set a condition such as *Response Time Greater Than 500* to include only applications where the Response Time exceeds 500 ms within the selected time period.
Similarly, for **APM Insight Transaction**, attributes such as Average Response Time, Throughput, Error Rate, and Error Count are available. A condition such as *Error Rate Greater Than 5* filters the widget to show only transactions where more than 5% of requests resulted in errors during the selected time period.
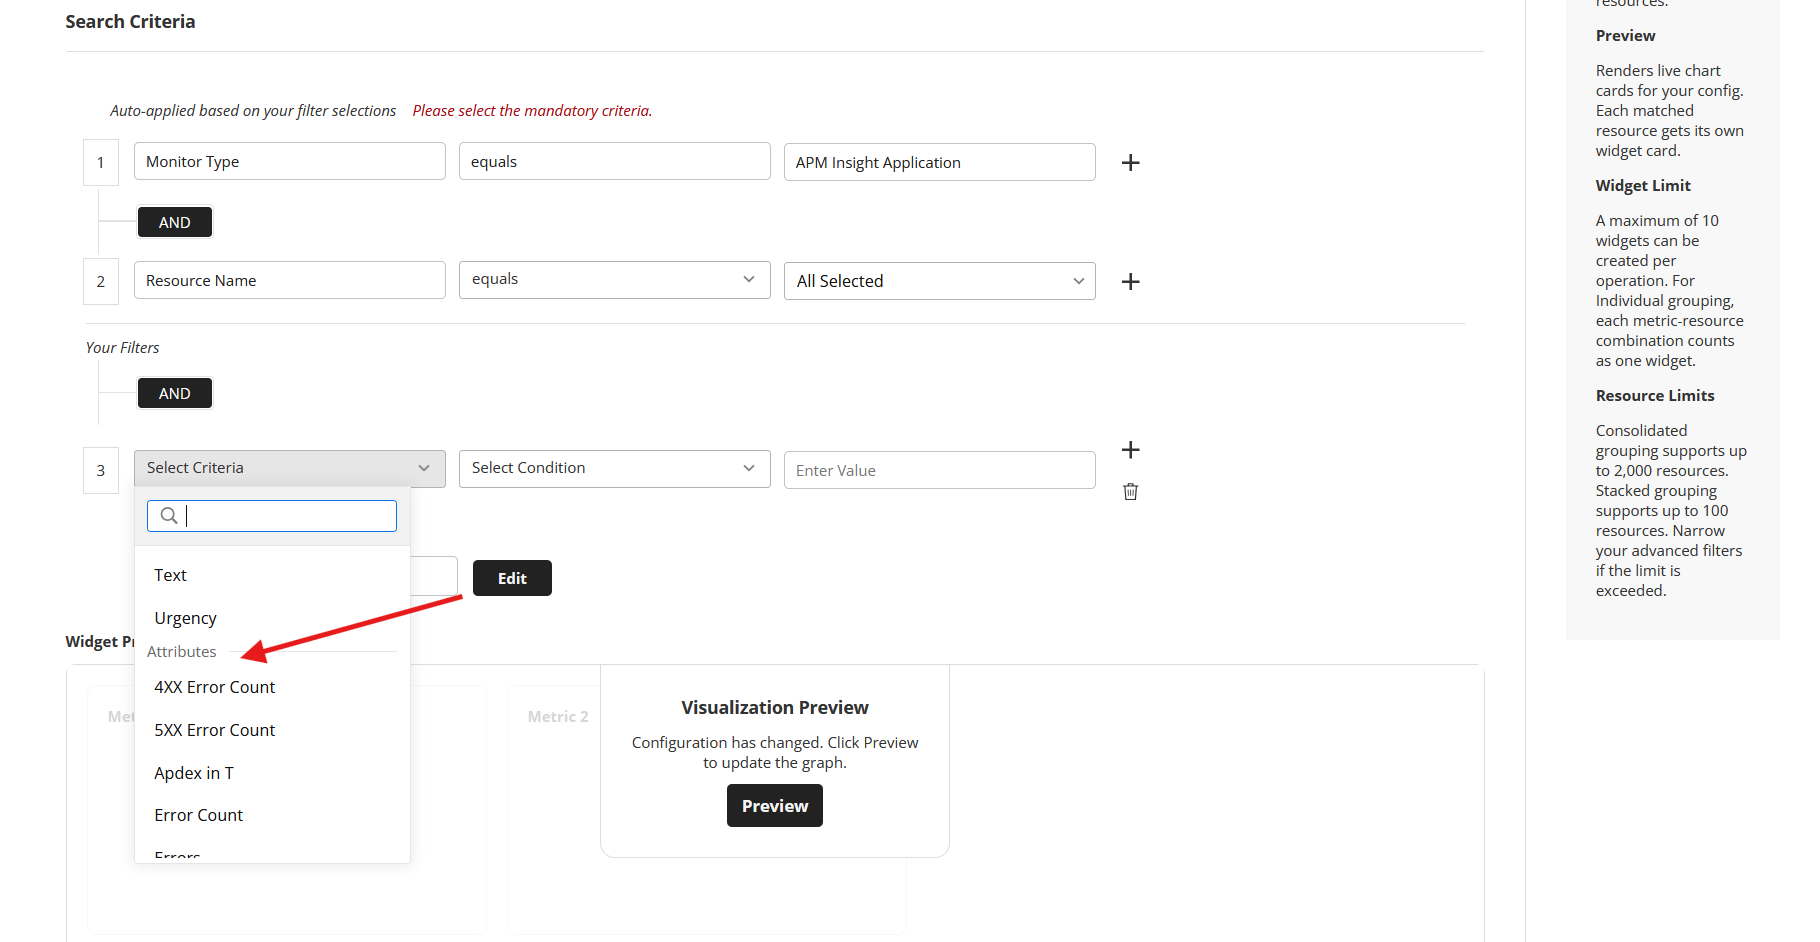
- **Dynamic attributes:** The available attributes depend on the resource type selected in Widget Builder, so you see only the metrics that are relevant to that monitor type.
- **Supported operators:** `>`, `>=`, `<`, `<=`, `=`, and `!=`.
- **Combining conditions:** Attribute conditions can be combined with the existing name and group filters. For example, a widget can be configured to show only resources matching *name contains 'prod' AND Response Time > 500 ms*.
- **Use with COUNT:** Combined with the [COUNT aggregation](https://www.manageengine.com/products/applications_manager/help/insight-business-transaction-widget.html#count-aggregation), attribute filtering enables widgets such as "number of applications with Response Time above 1000 ms". The displayed count updates automatically as resources cross the threshold within the configured time period.
## Preview
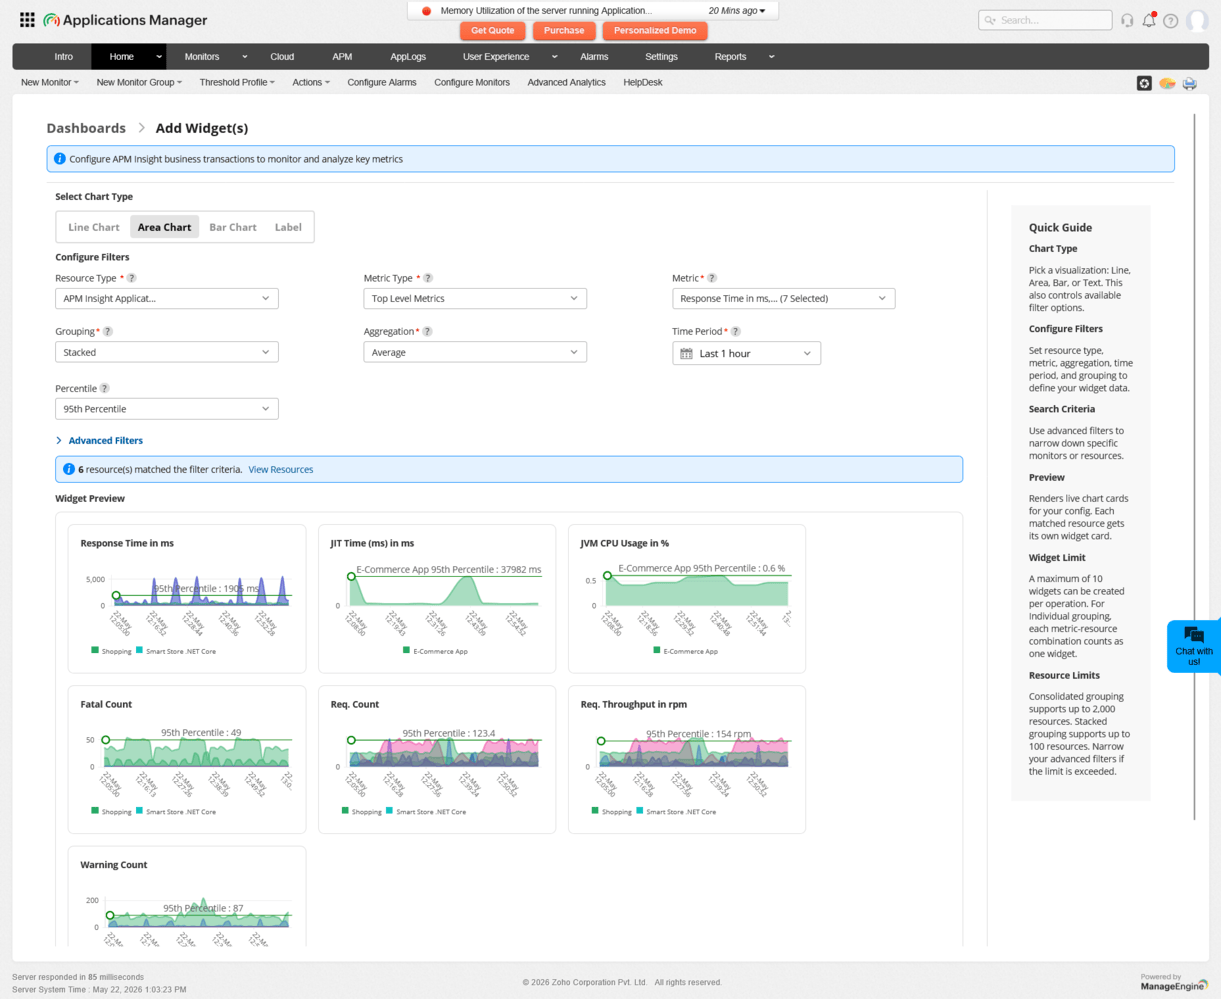
Before saving, click the **Preview** button to see how the widgets will look with live data. The builder decomposes your selection into individual preview cards based on the graph type and displays each one with a chart.
- **Individual:** One preview card per metric × resource combination.
- **Consolidated:** One preview card per metric, showing the merged aggregated series.
- **Stacked:** One preview card per metric, showing stacked resource layers.
- **Text:** One preview card per metric, showing a single numeric value.
If you change any configuration after previewing, an overlay message appears on the preview cards: *"Configuration changed. Click Preview to update."* Click **Preview** again to refresh with the updated configuration.
**Note:**
- Preview is a **read-only** operation - no data is written to the database.
- If a preview card fails to load data, an error message is shown on the affected card while other cards render normally.
- All required fields must be filled before previewing. If any required field is empty, a validation error is displayed. For widgets that use the **Count** aggregation, the fields that are hidden (Metric, Time Period, Graph Type, and Percentile) are not required.
## Saving widgets
After configuring and previewing the widgets, click **Save** to create all the widgets in a single operation. The widgets are added to the current dashboard and automatically positioned at the bottom of the existing layout.
Widget display names are auto-generated based on the graph type:
| Graph Type | Name Pattern | Example |
|---|---|---|
| Individual | *MetricName* - *ResourceName* | Response Time - App-1 |
| Consolidated | *MetricName* (Consolidated) | Response Time (Consolidated) |
| Stacked | *MetricName* | Response Time |
**Note:**
- All required fields (Resource Type, Metric Type, Metric, Chart Type, Graph Type, Aggregation, Time Period, and Resources) must be filled before saving. For widgets that use the **Count** aggregation, the Metric, Time Period, and Graph Type fields are hidden and not required.
- The total number of widgets must not exceed **10** per save operation.
- Saving is blocked for users with the **Demo** role.
## Threshold Configuration for Metric Visualization Widgets
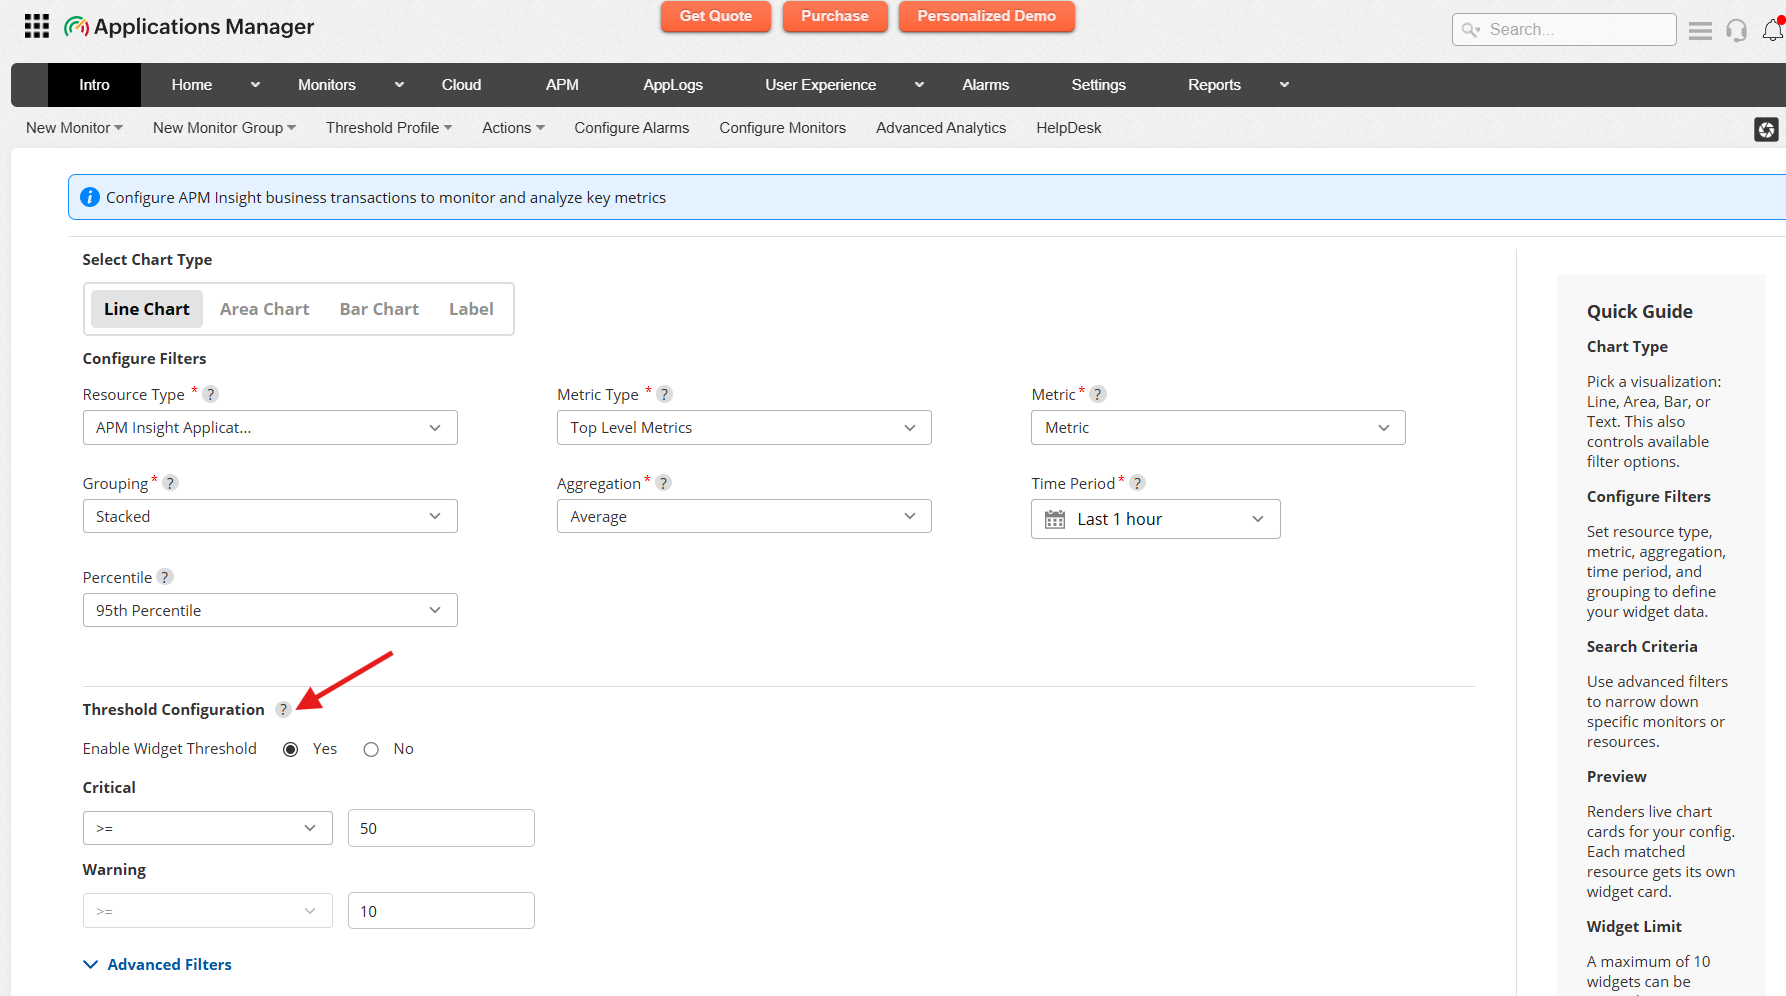
Metric visualization widgets now support threshold-based visual indicators to help users quickly identify Warning and Critical conditions. Thresholds can be configured to trigger visual changes when metric values exceed predefined limits.
### Threshold Behavior by Chart Type
#### Line and Area Charts
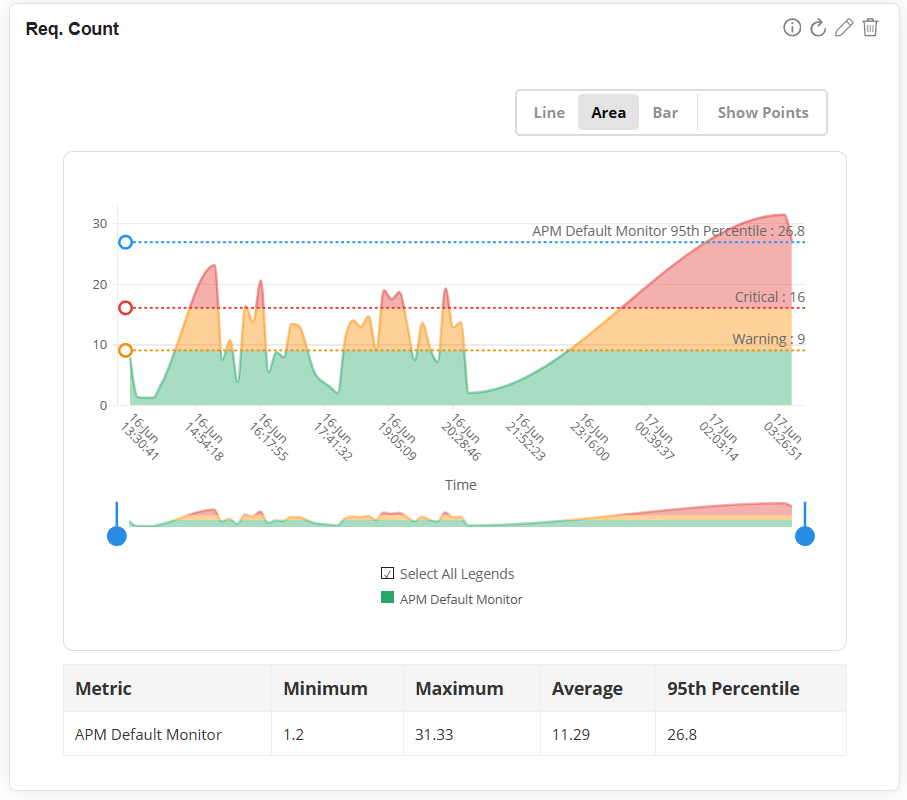
For Line and Area charts, threshold violations are highlighted using the configured threshold violation colours.
The affected chart regions are shaded based on the violated threshold condition, making it easier to identify values that cross Warning or Critical limits.
#### Bar Charts
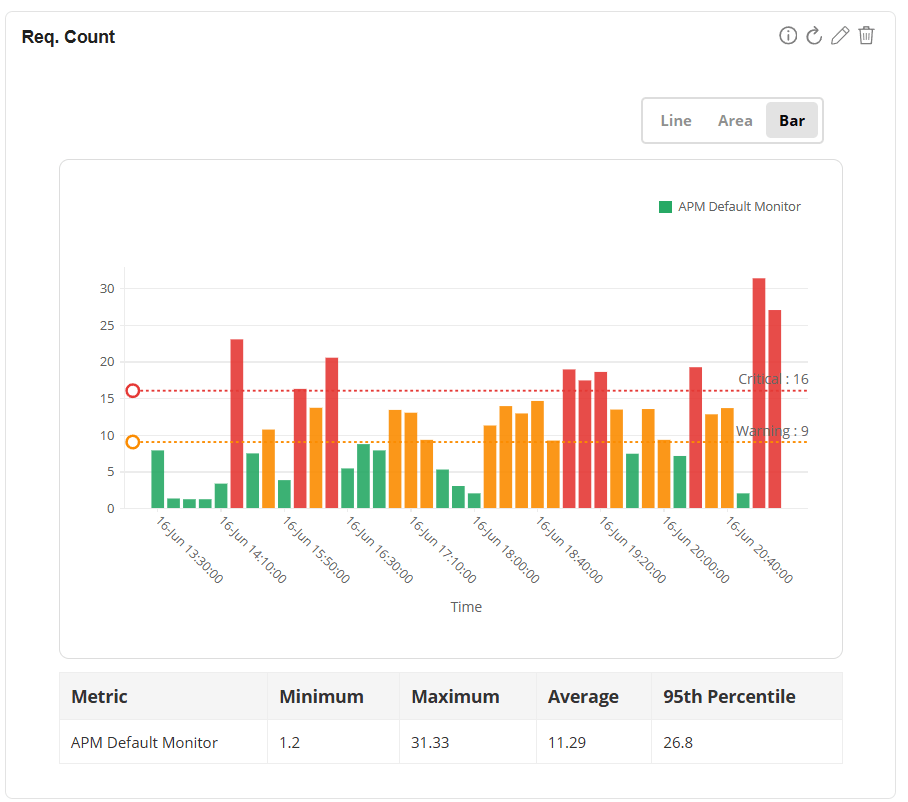
Bars are automatically colored based on their threshold status:
- **Red:** Critical
- **Orange:** Warning
- **Green:** Normal
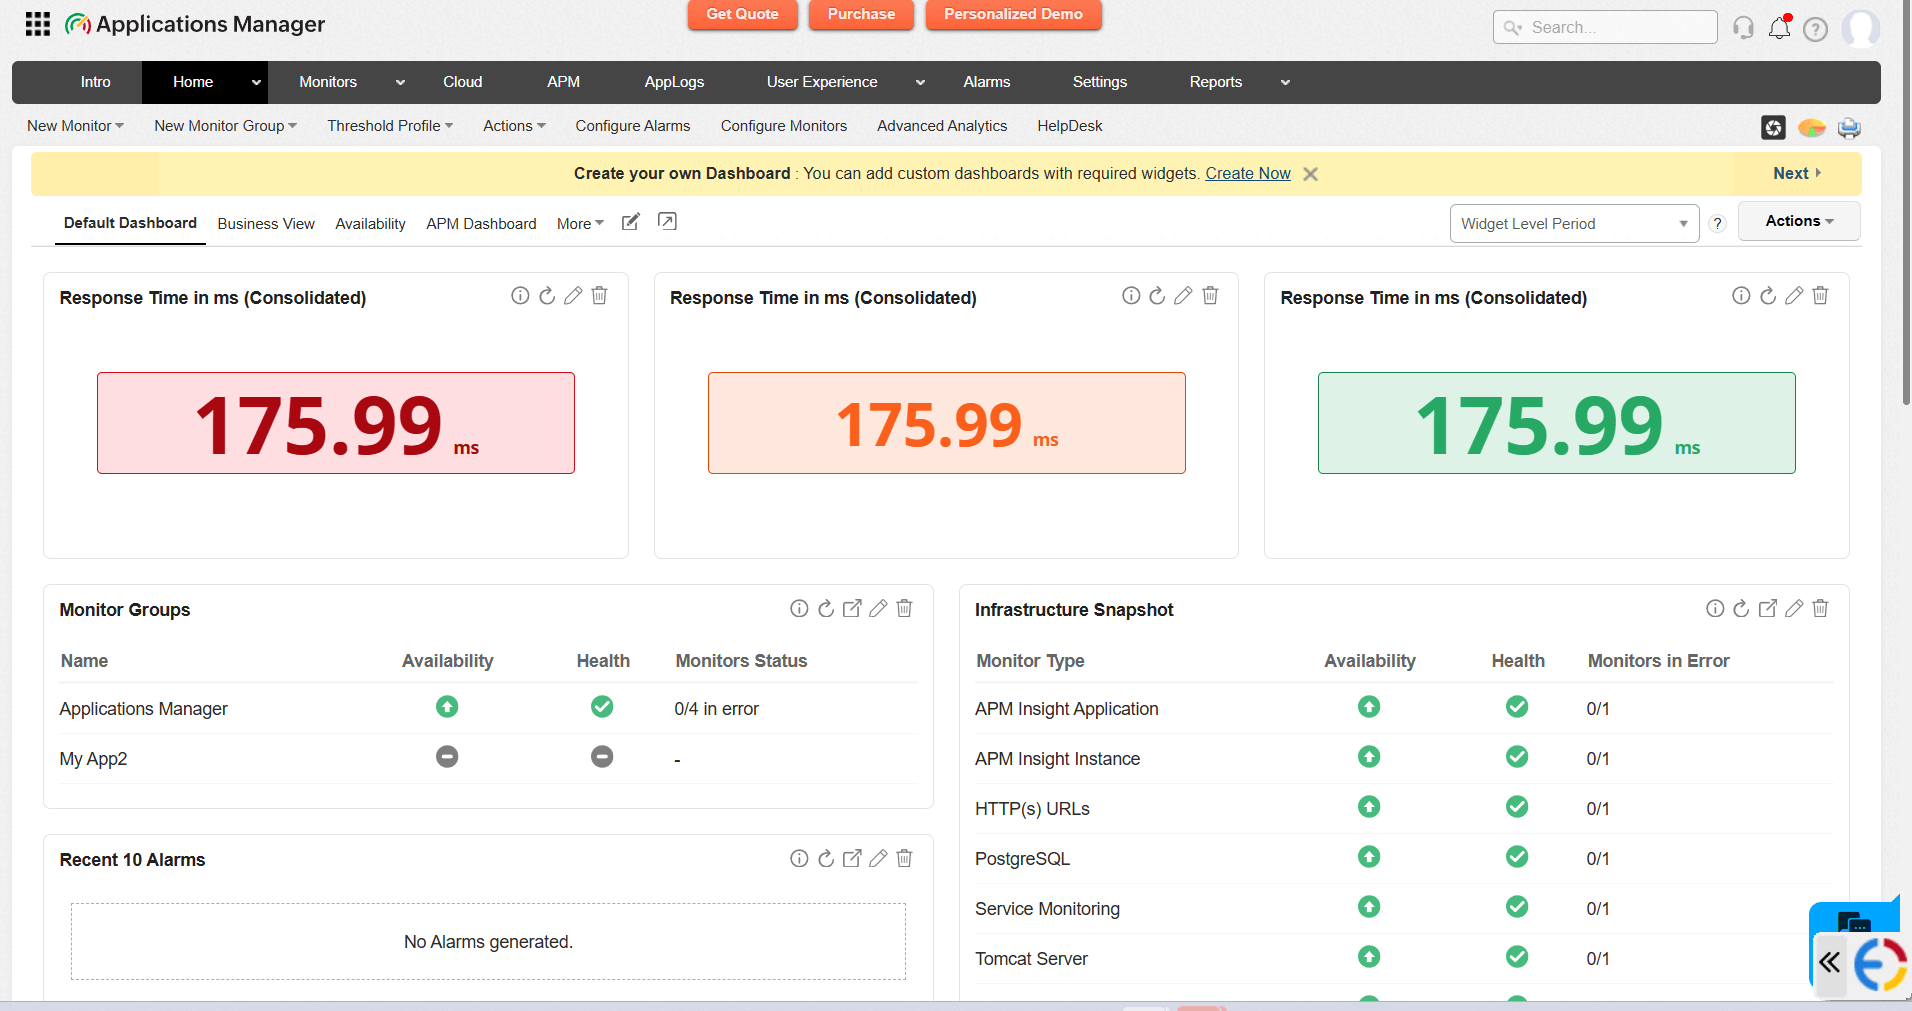
#### Label/Text Widgets
Label or Text widgets use threshold violation colors to bring immediate attention to affected metrics.
When a threshold is violated:
- The widget background color changes to the violated threshold color.
- The metric value font color also changes based on the violated threshold color.
This helps users quickly identify unhealthy metric values without reading the chart in detail.
For widgets that use the [COUNT aggregation](https://www.manageengine.com/products/applications_manager/help/insight-business-transaction-widget.html#count-aggregation), the threshold status (Critical / Warning / Normal) is evaluated against the resource count value instead of a metric value.
### Adaptive Chart Colors
Chart series colors automatically adjust based on whether thresholds are configured.
- When thresholds are enabled, a threshold-based palette is used so that the chart colors align with the configured threshold states, such as Normal, Warning, and Critical.
- When thresholds are not configured, a blue-teal palette is applied to differentiate standard chart styling from threshold status indicators clearly.
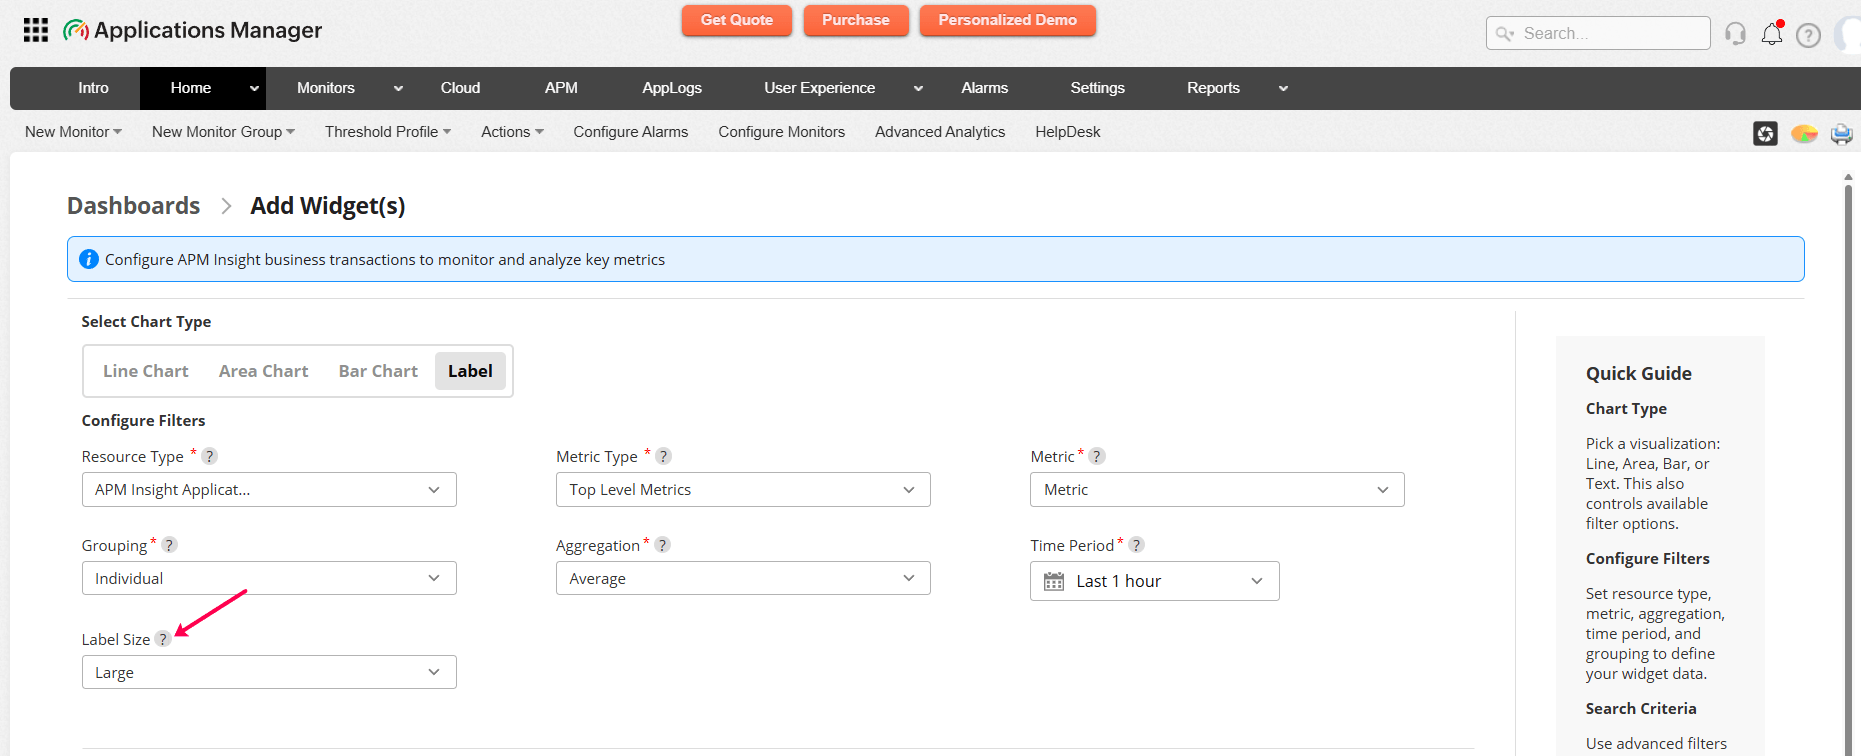
## Font Size Configuration for Label/Text Widgets
Label or Text widgets now support configurable font sizes for metric values, enabling greater flexibility when designing dashboards with different levels of visual emphasis.
Available options include:
- **Small:** 24px
- **Medium:** 32px
- **Large:** 48px
- **Extra Large:** 64px
The selected font size is stored per widget and applied consistently across both the Widget Builder preview and the live dashboard.
## Dashboard rendering
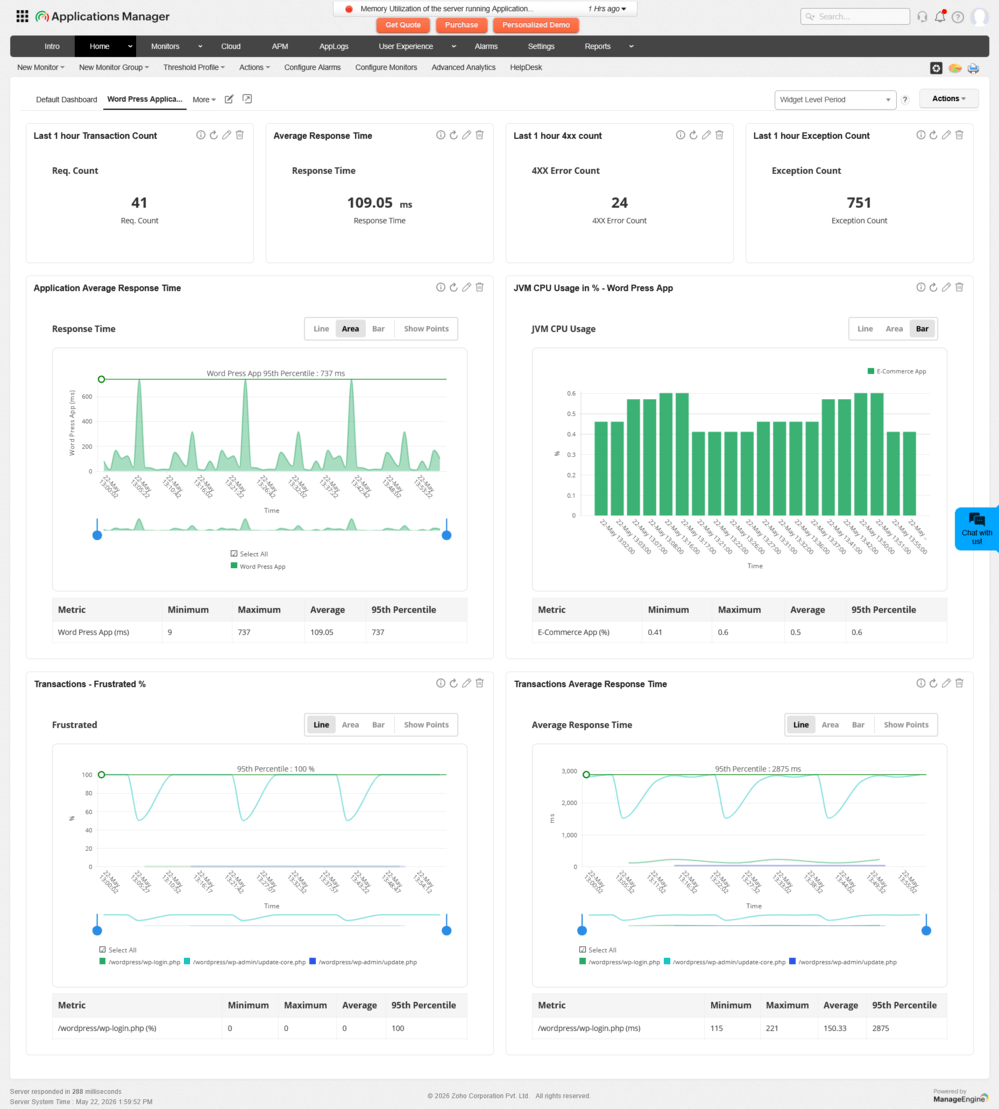
After saving, widgets render on the dashboard with their configured chart type and data. Each widget fetches live metric data for the selected resources and time period.
### Interactive features
The following interactive features are available on rendered chart widgets (Line, Area, and Bar):
- **Runtime chart type switching:** Switch between Line, Area, and Bar chart types directly on the widget without editing the widget configuration.
- **Data point markers:** Toggle data point markers on or off to show individual data points on the chart.
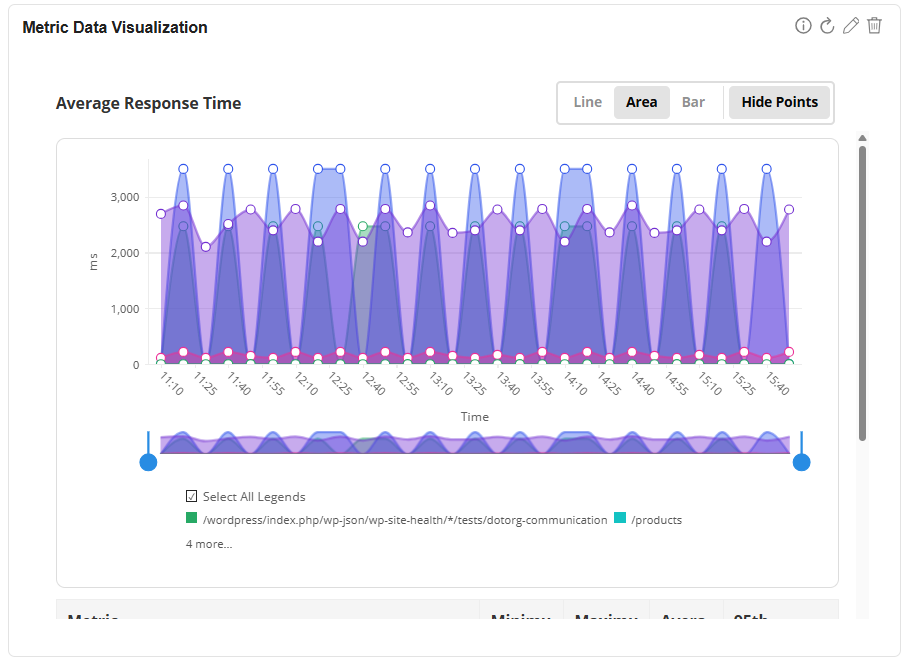
- **Drill-down:** Click any value in the statistics table to open the [drill-down panel](https://www.manageengine.com/products/applications_manager/help/insight-business-transaction-widget.html#drill-down-view) for that resource.
### Statistics table
For time-series chart widgets (Line, Area, and Bar), a statistics table is displayed below the chart showing per-series metrics:
| Statistic | Description |
|---|---|
| Min | Minimum value across all data points in the series. |
| Max | Maximum value across all data points in the series. |
| Average | Mean of all data points in the series. |
| 95th Percentile | Value below which 95% of data falls. Useful for identifying outlier performance. |
**Note:**
- When a widget uses **Advanced Filters**, the resources are resolved dynamically on each dashboard load. New resources matching the filter criteria are automatically included in the widget data.
- Clicking a resource name in the statistics table navigates to that resource's monitor page in a new tab.
- Clicking a value in the statistics table opens the [drill-down panel](https://www.manageengine.com/products/applications_manager/help/insight-business-transaction-widget.html#drill-down-view) for that resource.
### Drill-Down View for Metric Visualization Widgets
Metric Visualization widgets support a drill-down view that lets you see the individual, per-resource values behind an aggregated chart.
#### Opening the drill-down panel
- **Line, Area, and Bar chart widgets:** A statistics (legend) table is displayed below the chart showing each resource's minimum, maximum, average, and percentile values. Click any value in the table to open the drill-down panel for that resource.
- **Text (Label) widgets:** Click the displayed value to open the drill-down panel, which shows all the resources behind that number.
**Note:** Clicking a resource name in the legend table navigates to that resource's monitor page in a new tab.
#### Drill-down panel details
The drill-down opens as a slide-over panel with a time period selector at the top and a detail area that shows resource-level data.
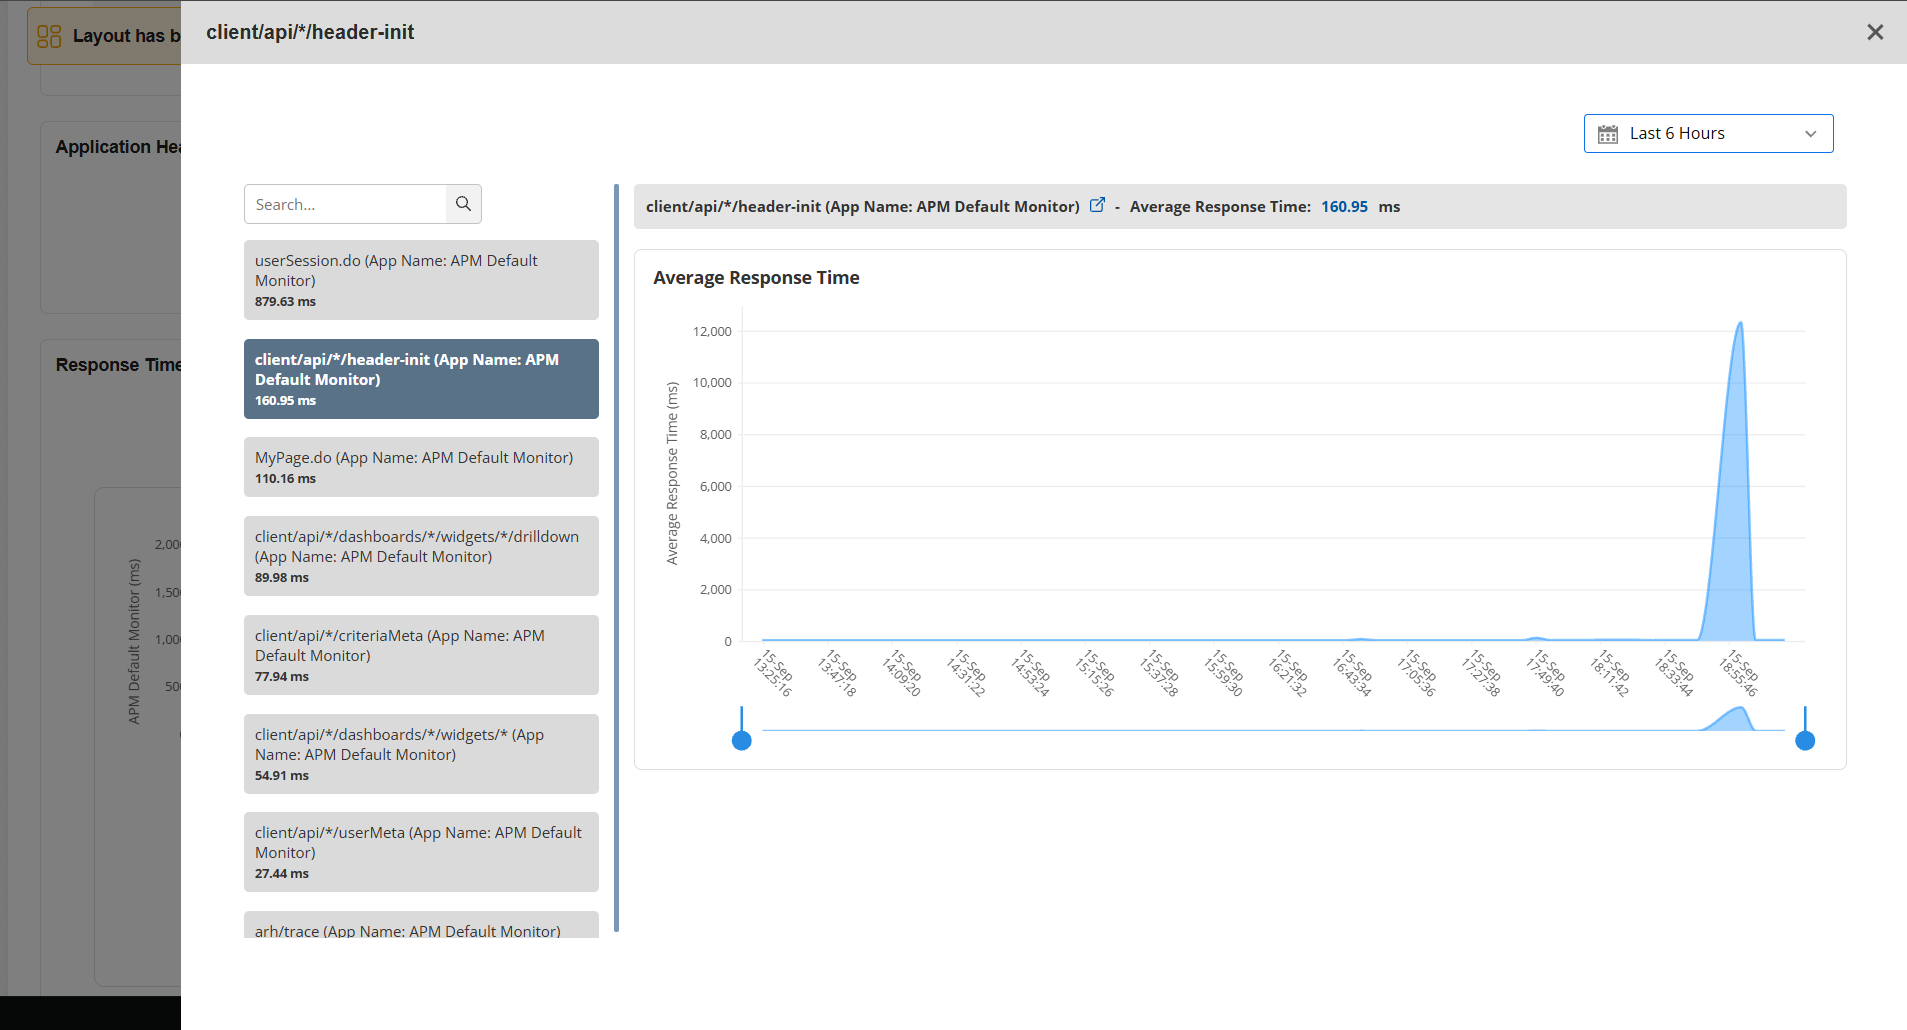
- **Multiple resources (Stacked or Consolidated graph type):** A searchable resource sidebar appears on the left, listing all resources with their names and values, sorted from highest to lowest. Select a resource in the sidebar to update the detail area on the right.
- **Single resource (Individual graph type):** Only the detail area is shown, without a sidebar.
The detail area displays different views depending on the resource type:
| Resource Type | Detail Area View |
|---|---|
| APM Insight Transaction | An interactive area chart showing the metric's time-series data for the selected resource. |
| Application, Instance, and other monitor resources | The resource's History Data report. |
**Note:**
- Resources that returned no data during the selected time period are still listed in the sidebar, so you can see the full set of configured resources.
- For APM Insight Transaction resources, each entry also shows its parent Application, so you can trace transaction-level values back to the owning application.
#### Time period override
You can change the time period within the drill-down panel without affecting the widget's saved configuration. This is useful for quickly zooming into a shorter or longer window while investigating a spike. The available presets are 30 minutes, 1 hour, 3 hours, 6 hours, 12 hours, 24 hours, 7 days, 30 days, and custom date ranges.
## Editing widgets
To edit an existing widget, click the **Edit** icon on the widget. The edit form opens with all fields pre-populated from the saved configuration.
### Locked and editable fields
During editing, certain fields are locked and cannot be changed:
| Field | Editable? | Notes |
|---|---|---|
| Resource Type | No (Locked) | Cannot be changed after creation. |
| Metric Type | No (Locked) | Cannot be changed after creation. |
| Metric | Yes (Single-select only) | Switches to single-select mode in edit. You cannot add additional metrics. |
| Chart Type | Yes | You can switch between Line, Area, Bar, and Text. |
| Graph Type (Individual) | No (Locked) | Individual graph type is locked and cannot be changed. |
| Graph Type (Stacked/Consolidated) | Yes | You can switch between Stacked and Consolidated. |
| Aggregation | Yes | You can change the aggregation method. |
| Time Period | Yes | You can change the time period. |
| Advanced Filters | No (Locked) | Search criteria cannot be modified after creation. |
**Note:** Bulk editing is not supported. Once widgets are added, you can edit them only individually. An informational message is displayed: *"Once the widget is added, bulk editing is not supported. You can edit widgets individually."*
## Deleting widgets
To remove a widget from the dashboard, click the **Delete** icon on the widget. The widget and its configuration are permanently removed from the dashboard.
If the deleted widget used Advanced Filters with unique search criteria, the criteria are also cleaned up. If other widgets share the same search criteria, the criteria are preserved.