Real Browser Monitor (RBM) provides live end-user experience measurement. RBM launches a browser and monitors a web application, mimicing the user's interaction with the site. Applications Manager uses behavioral scripts to describe the path that would be taken by a end-user on the site. These paths are monitored periodically to obtain performance metrics such as the availability and response time. We support playback from different geographical locations.
Applications Manager uses a web browser to collect metrics, taking into consideration aspects such as the network latency content check and availability of web element. This results in greater accuracy than synthetic monitoring which simply emulates a web browser rather than launching an actual browser. Actual rendering of a web page does not occur in the traditional web monitoring. In RBM, we render the webpage, build the DOM and even execute the JavaScript in the web browser. Response time of the webpage includes CSS, images, links loaded from third party websites etc.
Assume you have users logging in to your application from different locations around the world like the UK, US, Germany, Australia, etc. You can monitor their experience from the central Applications Manager Server. You could have the Applications Manager running in a data center in India and have the Real Browser Monitor agents deployed in other geographical locations and have it report Web Application Performance data to the central site.
Browse through the following topics to understand Real Browser Monitoring in Applications Manager:
EUM agents register to ManageEngine Applications Manager on startup. You need to specify the "Host, Web Client SSL Port and EUM API key” (which is available under Settings → REST API → End User Monitoring) of the Applications Manager the first time the agent is installed and running. The agents are listed automatically.
Real Browser monitor is created in Applications Manager server by recording the web transaction and specifying the agent(s) where the playback should occur. Each EUM agent will periodically check Applications Manager Server if RBM monitor has been configured for it and replay the actions in the browser. Once the playback is complete, EUM agent will update the results of the playback (response time, response code, etc.) in Applications Manager.
The availability and performance of the websites are monitored in real time by using the Real Browser monitor. If the health of the URLs is critical, then alarms can be generated. Based on the alarms, the admin can fix the issue.
To perform Real Browser Monitoring, Web Transaction Recorder and EUM agent are to be installed from where the playback has to be performed. To find out the system requirements of EUM agent for Real Browser Monitoring, refer here.
Deployment architecture & System Requirements
- Components of RBM - Web Transaction Recorder, EUM agent to be installed from where the playback has to be performed and Applications Manager Server.
- EUM agents (available as separate .exe downloads) need to be installed in client locations on a dedicated Windows machine with the following specifications: 8 GB RAM, 40 GB HD, and Mozilla Firefox v111. Firefox is bundled with our EUM Agent, eliminating the need for users to worry about ensuring the right version of Firefox on their machines. Applications Manager can be installed on either Windows or Linux and is compatible with both the Professional Edition and Enterprise Edition (with Managed Server).
- Click here to know the system requirements for Mozilla Firefox version v111.
Deployment architecture & System Requirements
- Components of RBM - Web Transaction Recorder, EUM agent (with Edge Support) to be installed from where the playback has to be performed and Applications Manager Server. The EUM Agent version should be 15.0.0 or higher.
- EUM agents (separate .exe downloads) have to be installed in the client locations on a dedicated Windows Machine which has Microsoft Edge Browser (versions 17 & above) installed in it. This works with the Professional Edition and Enterprise Edition (with Managed Server).
- Along with this Microsoft Edge WebDriver need to installed on the Windows machine where the EUM agent is installed.
- Click here to know the corresponding WebDriver version and the steps to install the same.
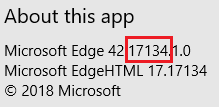
- Please note that there are different drivers required for different versions of Microsoft Edge browser. To find the version of Edge browser: Open Edge browser → More options → Settings → Scroll down to find the version.
- Once the WebDriver is downloaded, update the Microsoft Edge WebDriver Path in the EUM agent settings page and restart the EUM Agent once for the changes to take effect. Learn more
Deployment architecture & System Requirements
- Components of RBM - Web Transaction Recorder, EUM agent to be installed from where the playback has to be performed and Applications Manager server. The EUM Agent version should be 17.0.0 or higher.
- EUM agents have to be installed in the client locations on a dedicated machine which has Google Chrome (versions 65 & above) installed in it. This works with the Professional Edition and Enterprise Edition (with Managed Server).
- In addition, Chrome WebDriver needs to be installed on the machine where the EUM agent is installed. To know the corresponding WebDriver version and the steps to install the same, click here.
- Please note that there are different drivers required for different versions of Google Chrome browser. To find the version of Chrome browser, Open Google Chrome → Settings → About Chrome → Find Chrome version.
- Once the WebDriver is downloaded, update the Google Chrome WebDriver Path in the EUM agent settings page and restart the EUM Agent once for the changes to take effect. Learn more
For Real Browser Monitoring, we use the Web Transaction Recorder to record all user online transactions in their exact sequence. The Recorder is used to record the transactions which get stored as webscripts. These transactions will then be replayed at regular intervals of time and notifications will be sent when error is detected.
We support simultaneous playback of transactions in Firefox based EUM Agent. Multiple browsers can open at the same time and playback different transactions in Firefox based EUM Agent. The recorded actions will be replayed in the browser. Once the playback is complete, EUM agent will update the results of the playback [response time, response code, etc] in Applications Manager.
Alternatively, you can use the browser extension of the Web Transaction Recorder to record web transactions. To know more, refer here.
Browse through the following topics to use the Web Transaction Recorder tool:
You must download and install the recorder tool to record the sequence of user transactions. Every step of the transaction will be captured and recorded. You also can modify or edit your transactions.
Hardware/Software Requirements
A minimum of at least 100MB of disk space is required for installing the software.
Security/Firewall Requirements: The website to be monitored should be accessible from the EUM agent installed machine.Download and Installation
Download the new Recorder and start the installation process. The installation wizard takes you through a four-step process after which the Recorder will be started:
- A welcome screen is displayed, after which you will be asked for confirmation of the license requirements. Click Yes.
- After confirmation, a Choose Destination Location screen is displayed. The user is allowed to select the drive and directory where he wishes to install the Web Transaction Recorder. Click Browse and select the Destination Location. The default location is "C:\Program Files (x86)\ManageEngine\WebTransactionRecorder". Click Next.
- Choose the language in which to install the recorder. Click Next.
- Review the settings in the confirmation dialog and click Back if you wish to make changes. If not, click Next. The Recorder will be installed in your machine.
- After the installation is completed, click Finish. Make sure the "Launch Web Transaction Recorder now" option is checked, if you would like to start the tool automatically after the installation is complete.
After installing, the Web Transaction Recorder can be accessed under All Programs in Windows Start Menu. You can record a new transaction following these steps:
The user can import previously recorded HTML test cases from the Selenium IDE and create monitors automatically instead of recording them all over again. Here is how you can import a test case:
The RBM dashboard provides an overview of the status of your webscripts or transactions from multiple locations. If you click on the individual scripts listed, it will take you to a page which shows the following metrics:
This section provides a graphical representation of the total Transaction time of transactions across the different locations where the webscript is running.
This section provides a tabular representation of the current status and response time (in milliseconds) of the webscript from the locations where the script is running. The location showing maximum response time will be highlighted on the page. This indicates you the location from where the transaction is responding slow.
This section provides a good indication of how each individual URL present within a transaction performs from different geographical locations. This section lists all the URLs of the transaction and shows the response time of each URL from multiple locations. The location from which the URL has the maximum response time value will be highlighted. Click on any of the response time values listed to navigate to the 'Monitor Information' page of that particular URL.
Go to the Monitors Category View by clicking the Monitors tab. Click on Real Browser Monitoring under the Web Server/Services Table. The RBM bulk configuration view is displayed distributed into three tabs:
Monitor Information
| Parameter | Description |
|---|---|
| Name | The name of the monitor. |
| Health | The health (Clear, Warning, Critical) of the monitor based on its dependencies. |
| Polling Interval | The time set as the polling interval. |
| Availability | The current status of the monitor (Up/Down). |
Performance - Last One hour
| Parameter | Description |
|---|---|
| Transaction time | The time taken for the entire transaction, i.e, all the URLs, to load. |
| Response Time | The average response time for the entire Web transaction. |
| Step page load time | The time taken for an individual page, in the transaction, to load. |
Web Page Analysis:
Displays the screenshot of a webpage and performance information such as the load time and size of various components on this webpage like images, css, javascript,etc. This information can be used to optimize the website and reduce the page's loading time. The screenshots and metrics are displayed by default. This can be altered in the Edit Monitor page under Monitor Actions menu in the Monitor Details page.
If the health or availability attribute of a child monitor is compromised, users have the option to receive an alert email by linking an email action to the health and availability attribute. This email will, by default, incorporate the RCA (Root Cause Analysis) of the monitor and can be customized to include HTML files and webpage screenshots from the Real Browser Monitor. The desired attachments of the email can be configured within the performance polling tab.
1. How does Real Browser monitor differ from URL Sequence monitor?
| URL Sequence Monitoring | Real Browser Monitoring | |
|---|---|---|
| What does it Monitor? | Monitors the availability and performance of multi-step web transactions, such as online shopping cart. The URL sequence monitor supports only the recording of URL sequences and not the actions performed in the URLs. | Monitor the availability and performance of multi-step web transactions using a real browser, such as online shopping cart. RBM supports playback from different geographical locations unlike a URL sequence monitor. |
| Ideal for Monitoring | Ideal for monitoring web application response time. | Ideal for monitoring web applications that contain form fillings and AJAX content. |
| How does it Monitor? | Monitors via server side programs without actual rendering of a web page. | Monitors via a real browser with actual rendering of the web page. |
| Metrics captured | Analyses server response time of the web application sequence. Only the response time of the actual HTML content is only considered. | Analyses multi-step Web Applications. Captures response time of the webpage which includes CSS, images, links loaded from third party websites etc. |
2. The Firefox browser does not launch for EUM agents installed on a Linux server
i. Activate support for the installation of 32-bit applications in your 64-bit systemsudo dpkg --add-architecture i386ii. Update the APT databasesudo apt-get updateiii. Install the 32-bit libraries required by Mozilla Firefoxsudo apt-get install libdbus-glib-1.2:i386 libxt6:i386 libxcomposite1:i386 libstdc++6:i386 libgtk2.0.0:i386 libasound2:i386 -y --reinstall
3. What are the steps to enable the Playback using Microsoft Edge in an EUM Agent?
4. What are the steps to enable the Playback using Google Chrome in an EUM Agent?
To enable playback for Google Chrome, download and install the Chrome Webdriver for the corresponding version of the Chrome installed in the server. To download Webdriver for Google Chrome, click here.