Siebel CRM Monitoring and Management
Ensure high performance of applications in production, improve productivity and gain visibility into your entire Siebel environment - from end users through to application servers and databases - with Applications Manager. Oversee and manage application service levels. View your enterprise's entire application stack so you can better prioritize and take corrective actions before availability problems affect customer service quality.
Performance and Availability Monitoring
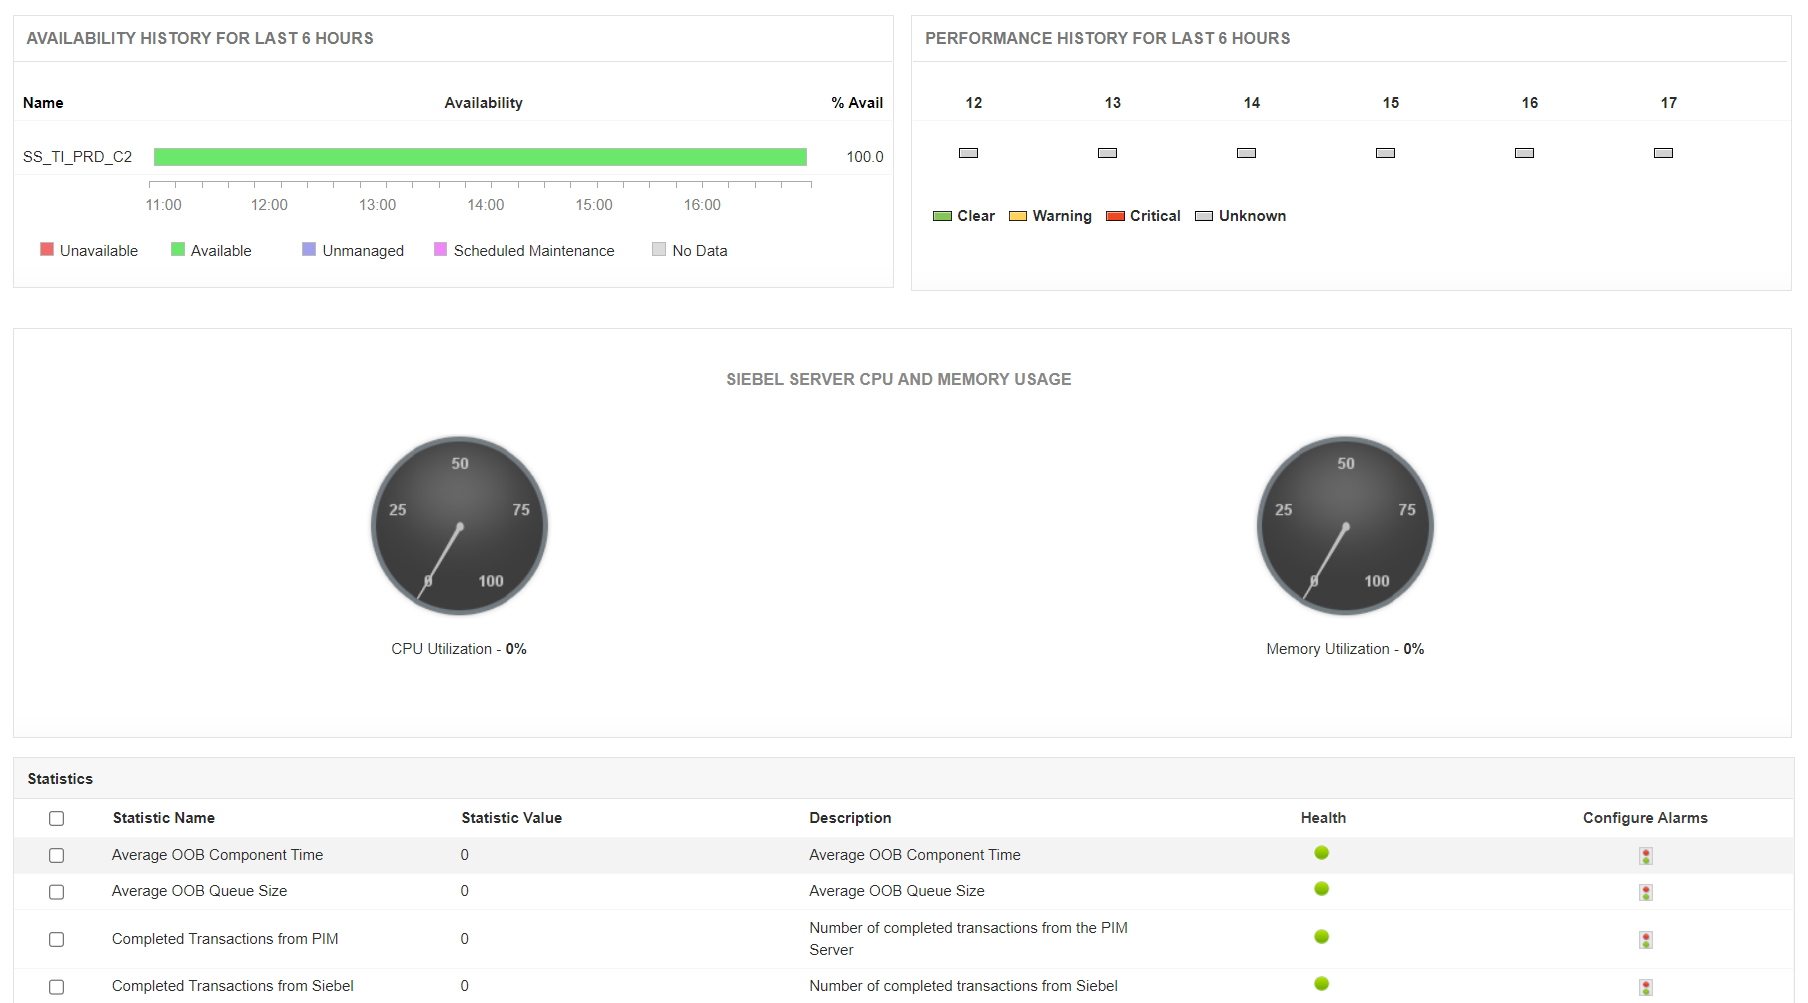
- Monitor down to process level CPU and memory utilization of a Siebel task or component.
- Insight into application health like the number of completed and failed transactions, aggregate transaction response times.
- Get alerts of component crashes with comprehensive production monitoring.
Server Component Status and Tasks
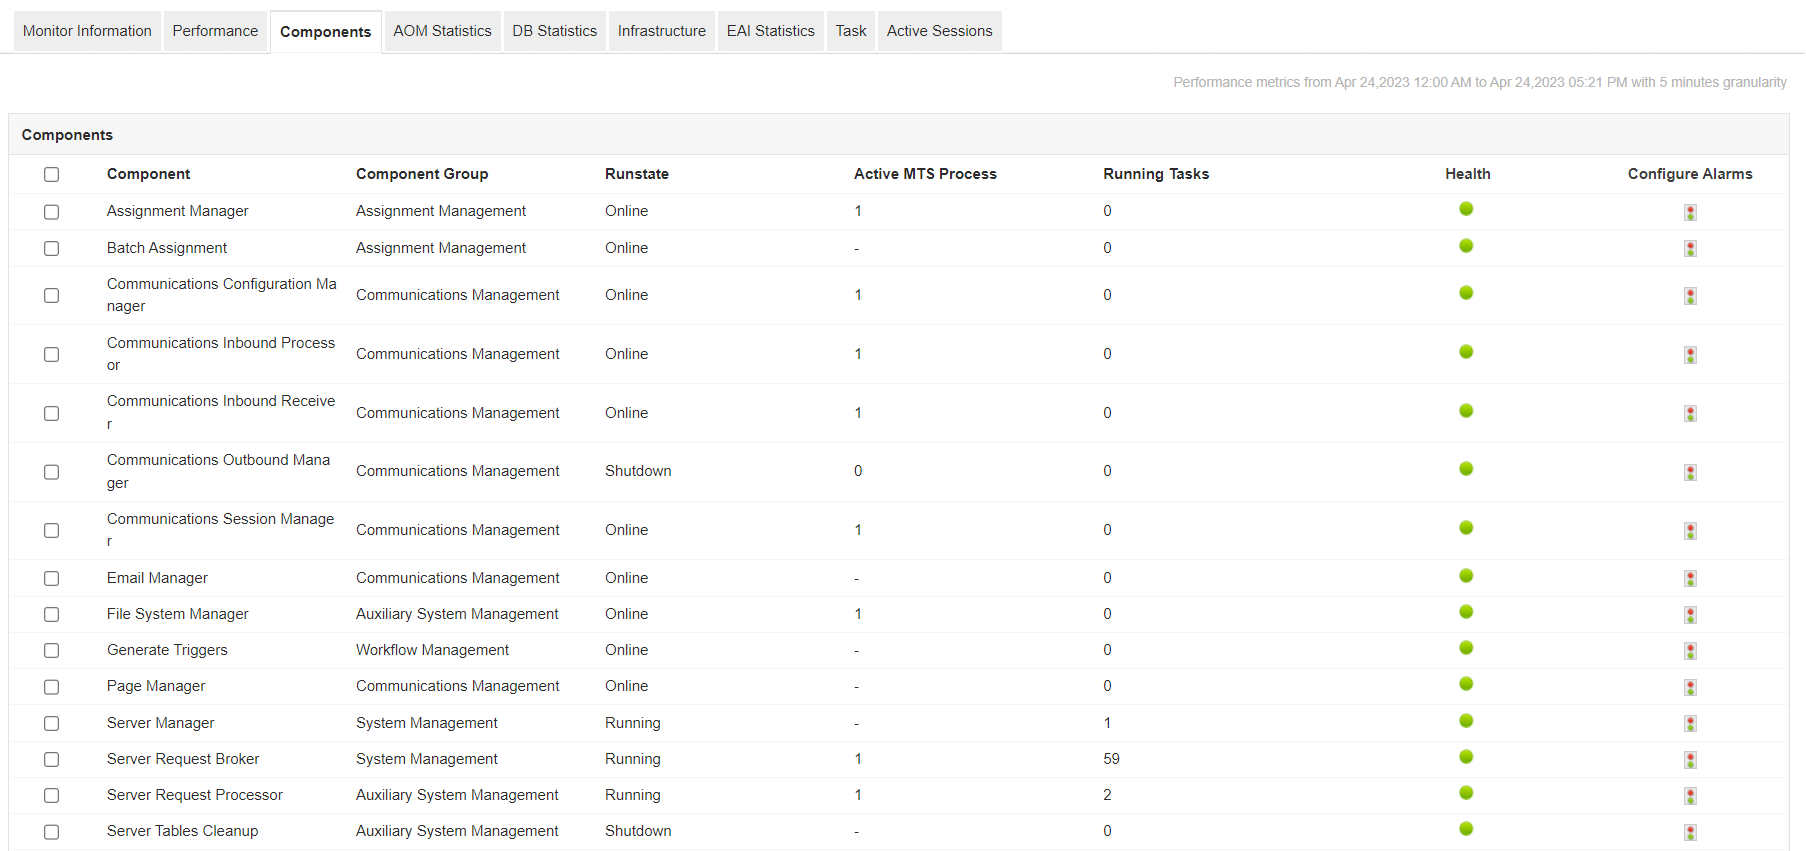
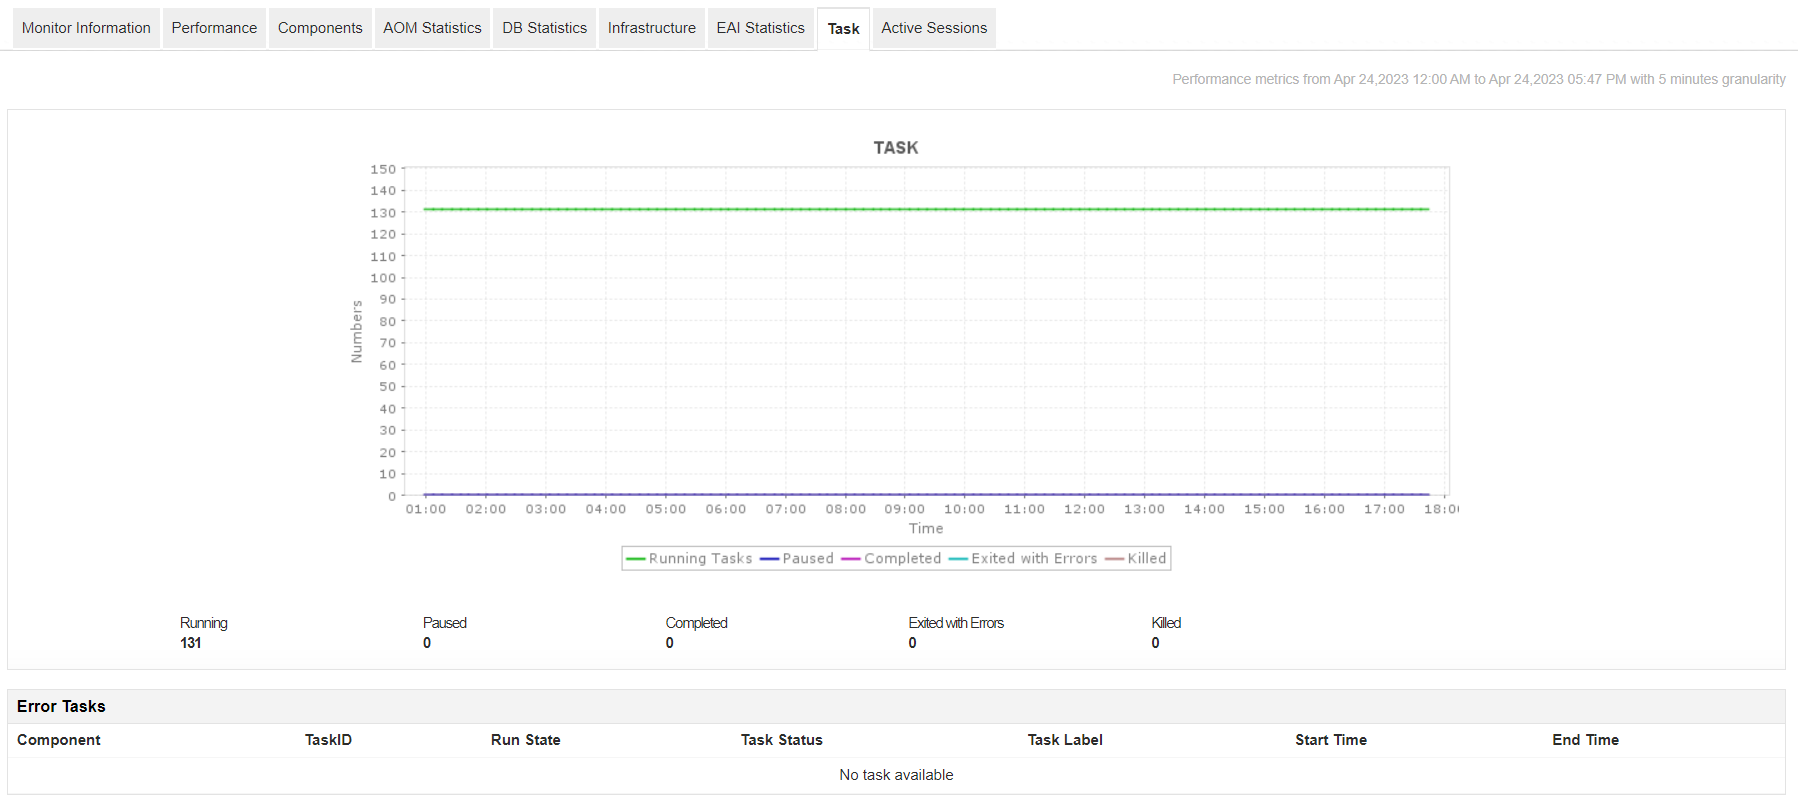
- Monitor all the tasks and processes in the Siebel App server, including custom components and task count essential to keep the application up and running.
- Manage service levels proactively for Siebel infrastructure and application component state changes with out-of-the-box alarm configurations.
- Automate routine tasks and corrective actions like restarting components and processes when they are down.
Administering AOM and EAI Statistics
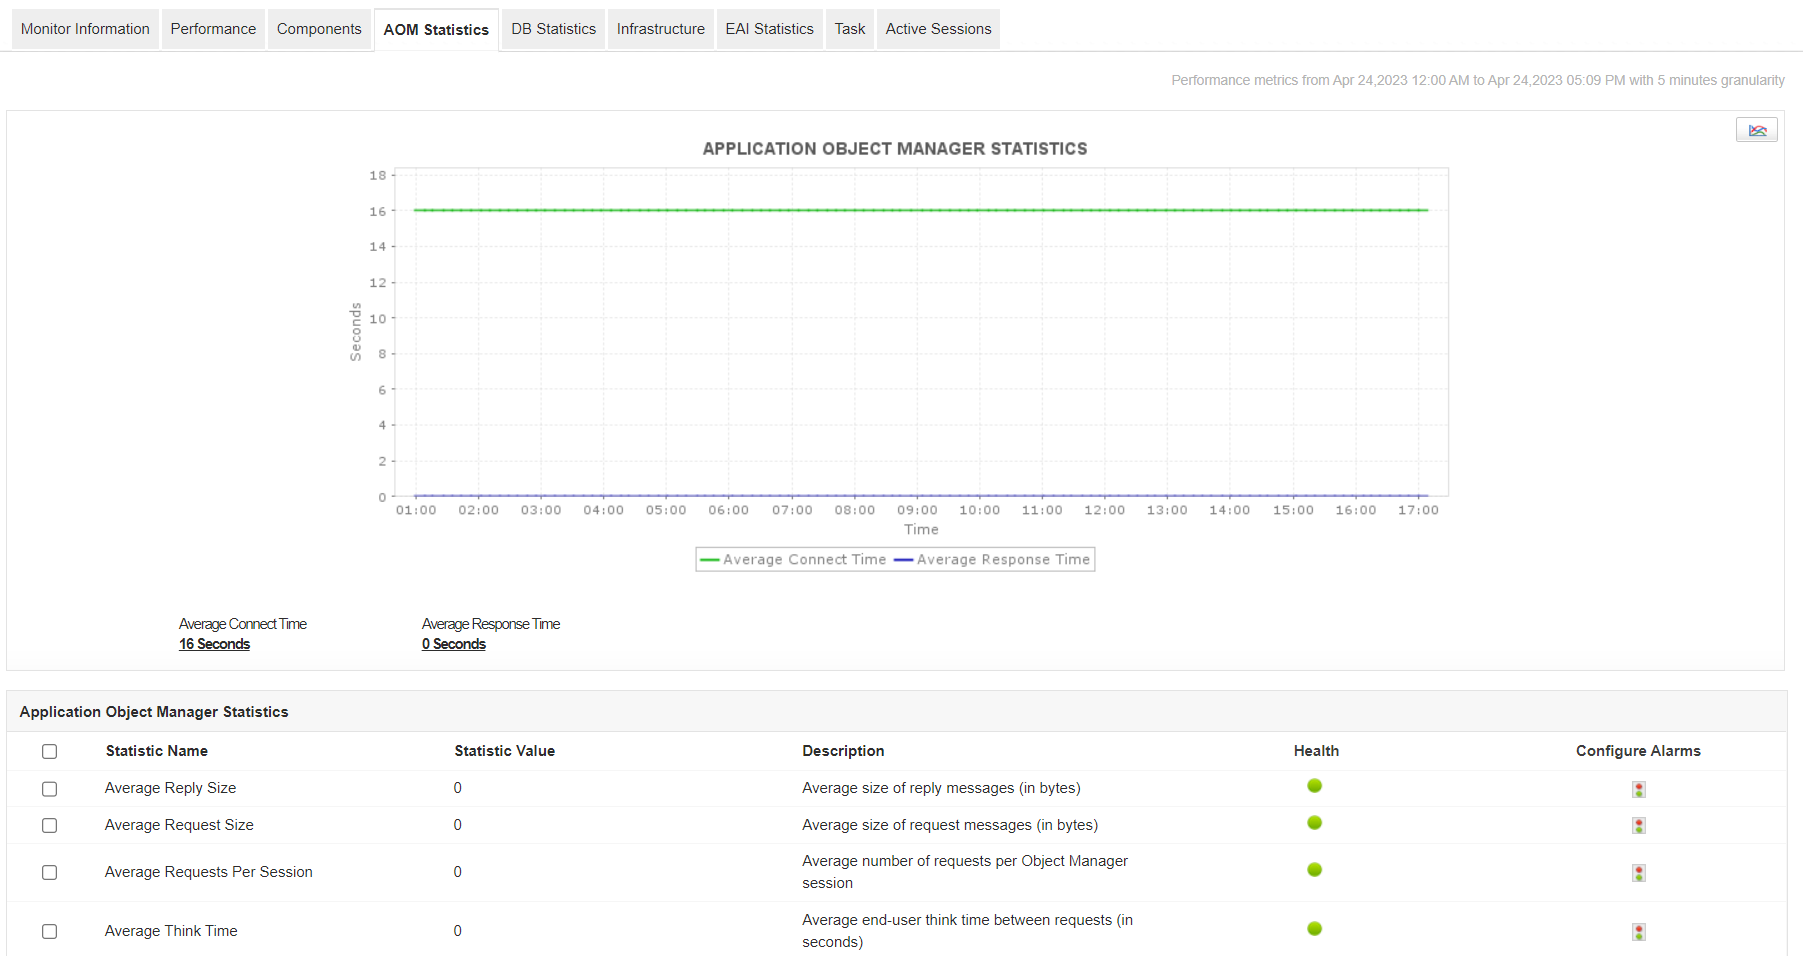
- Tune your Siebel Application Object Manager from server, component and task level.
- Get AOM-specific statistics like Average Connect Time for AOM sessions, response time, reply size and think time
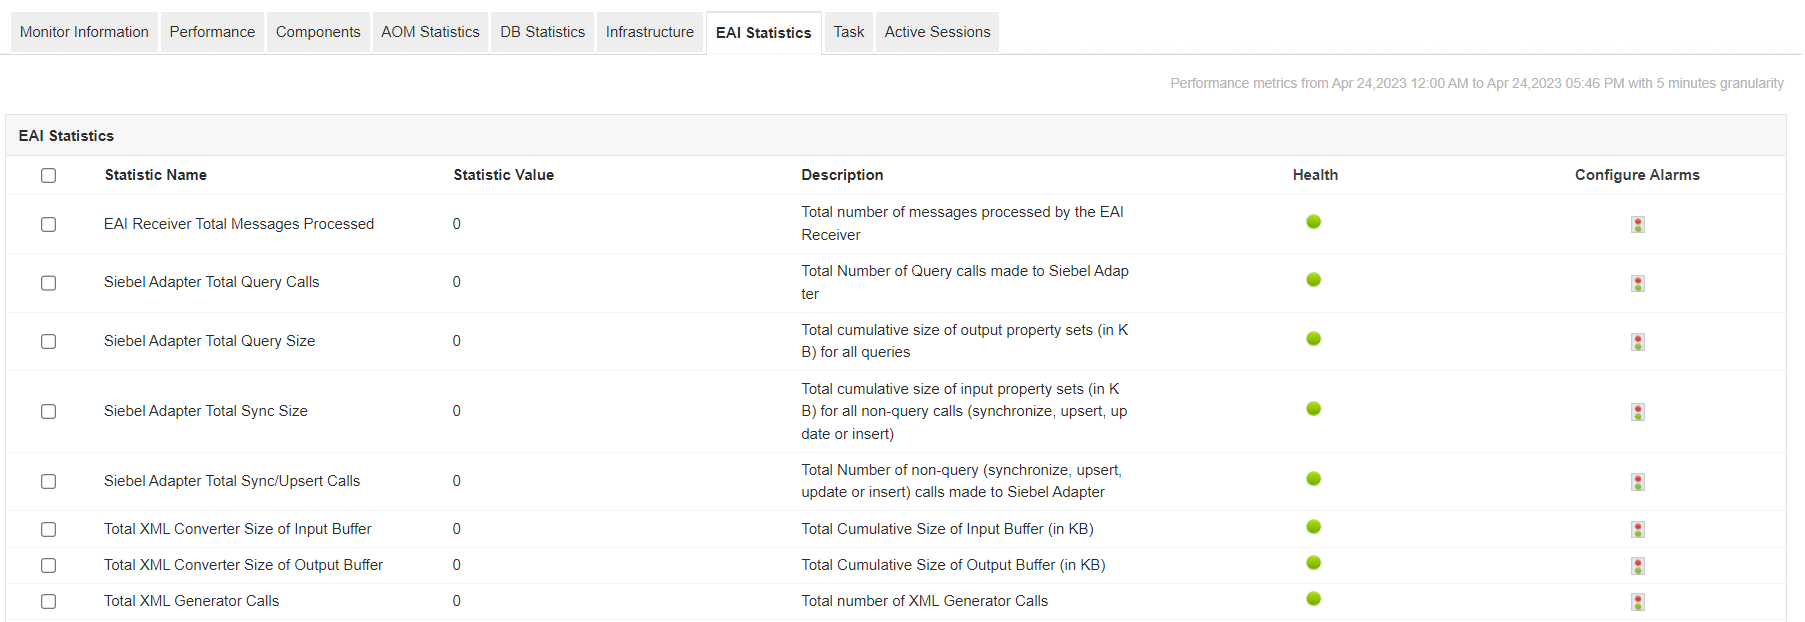
- Ensure Siebel Enterprise Application Integration connectivity with external applications.
Optimizing Database and Session performance
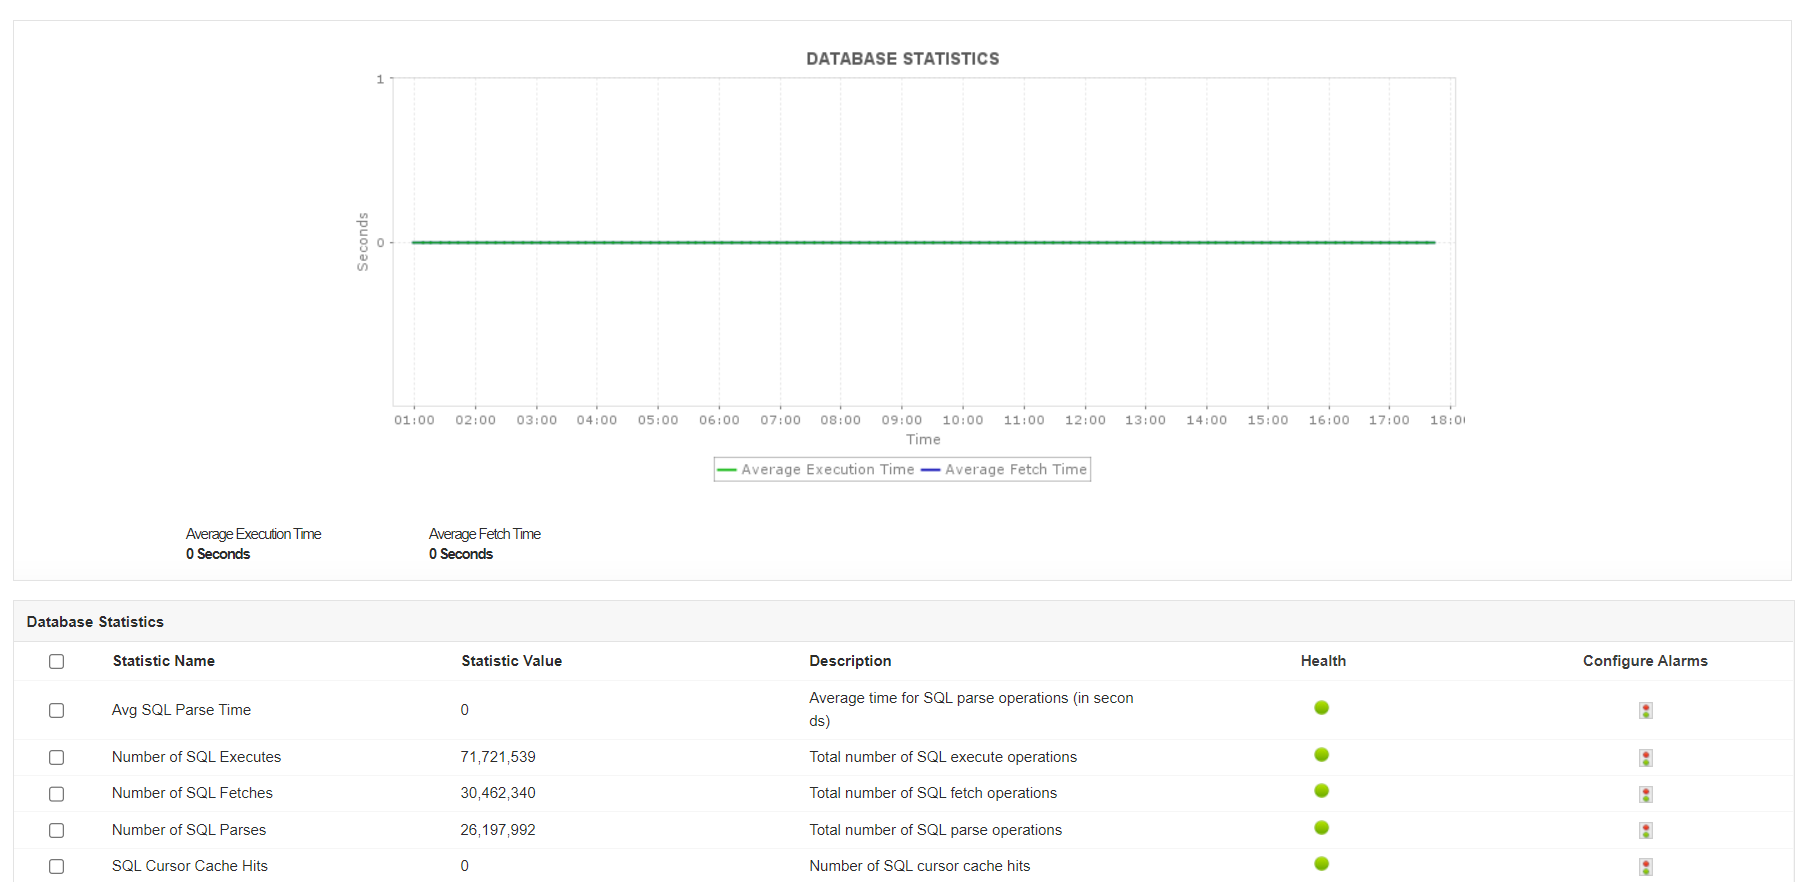
- Monitor statistics specific to the database infrastructure like Average execution time.
- Get alerted on your SQL cursor and object cache hit and miss to reduce the number of parsing of SQL statements.
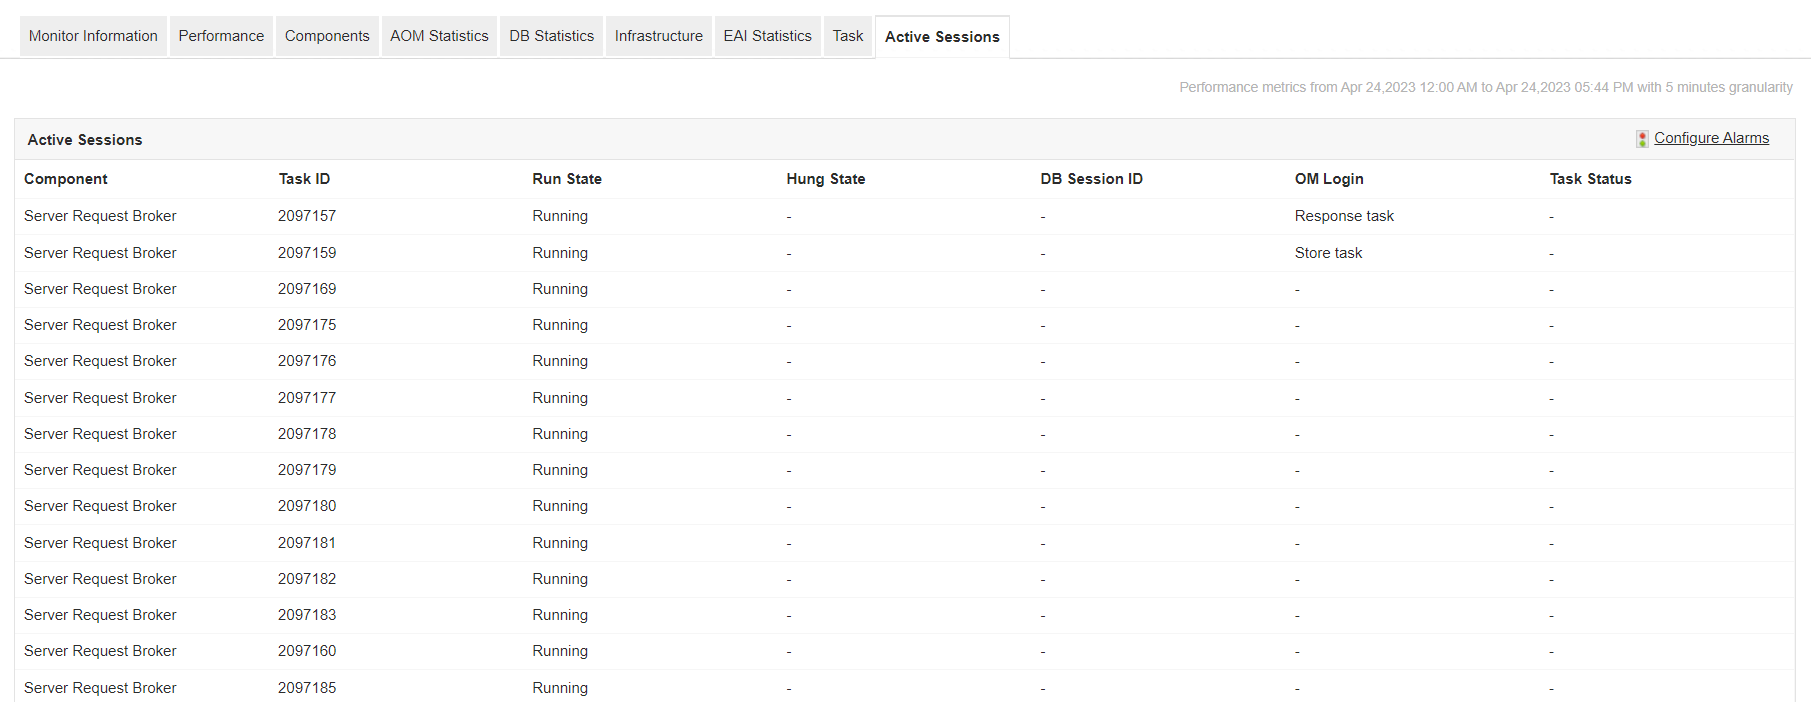
- Detect hung state session and perform real-time SQL monitoring to track the execution of long-running SQL statements
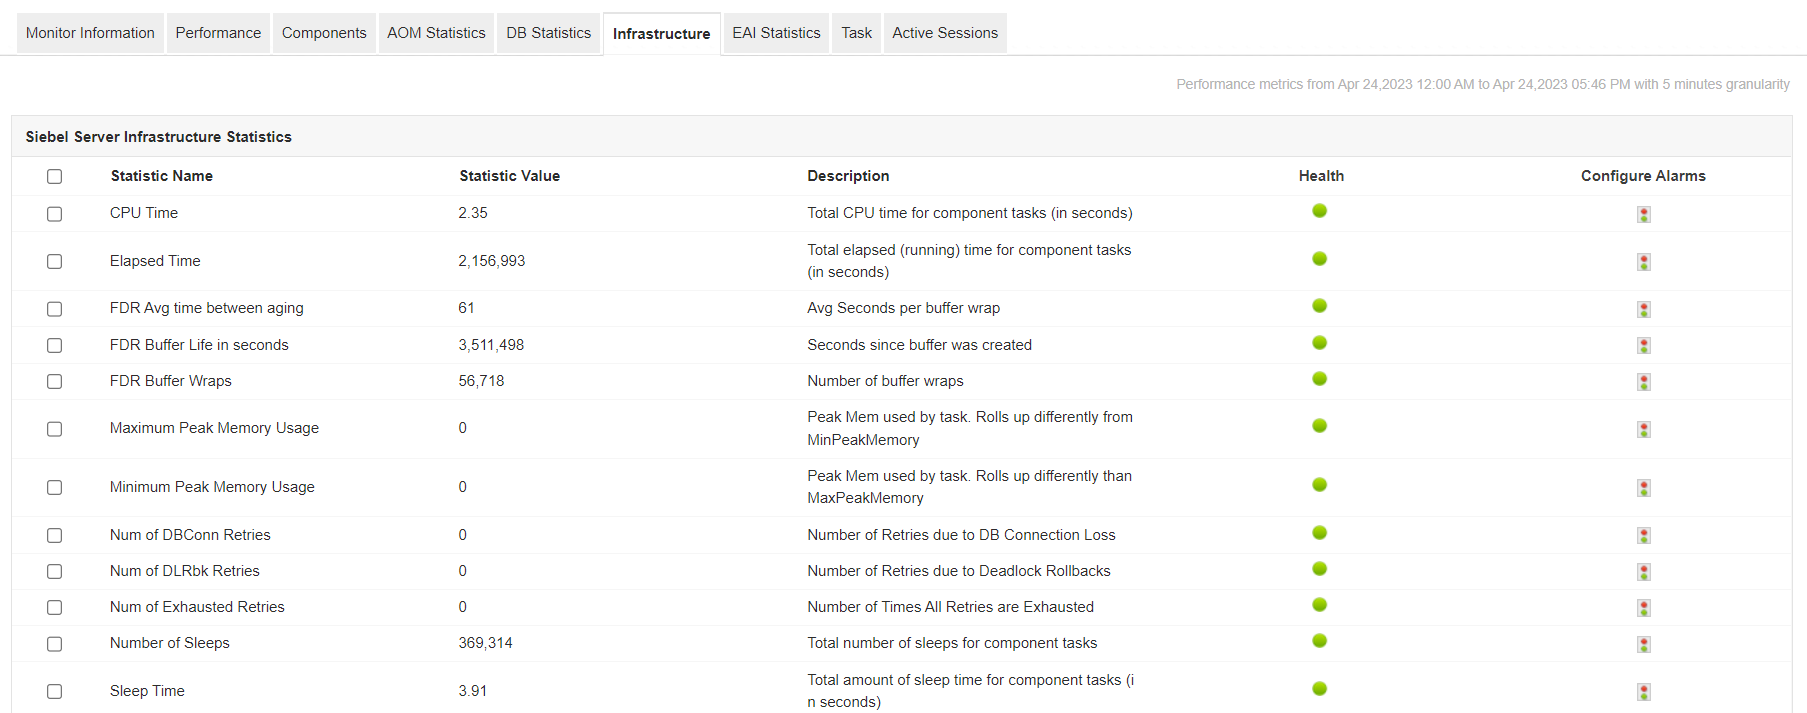
Siebel infrastructure monitoring
- Identify trends in your Siebel infrastructure and track metrics like component level CPU time, elapsed time and sleep time statistics.
- Plan capacity by determining the total number of tasks running in your Siebel Enterprise.
- Get out-of-the-box graphs showing utilization of memory i.e. minimum and maximum peak memory usage of a task.
