Hyper V Monitoring
Microsoft Hyper-V is a hypervisor-based virtualization solution for x86-64 systems and an important player in the booming server virtualization space; a critical part of a working IT environment, it needs to be tracked and observed constantly to ensure zero downtime. Hyper-V monitoring tools are essential to maintain the performance of the Hyper-v servers in the IT infrastructure.
Effectively monitor Hyper-V health and performance.
Applications Manager's Hyper V monitoring software also provides visibility into the resource utilization of Hyper-V infrastructure, which in turn helps in capacity planning. With out-of-the-box reports, graphical views, alarms, thresholds and comprehensive fault management capabilities, IT administrators can maximize Hyper-V server uptime and ensure their Hyper-V environment runs at peak performance. With the aid of end-user monitoring, the IT team can gain valuable insight into the user experience, both before and after a virtualization project. The Hyper-V monitoring feature, along with the support for VMware and Citrix XenServer enables you to manage virtualization solutions from multiple vendors from a single management console.
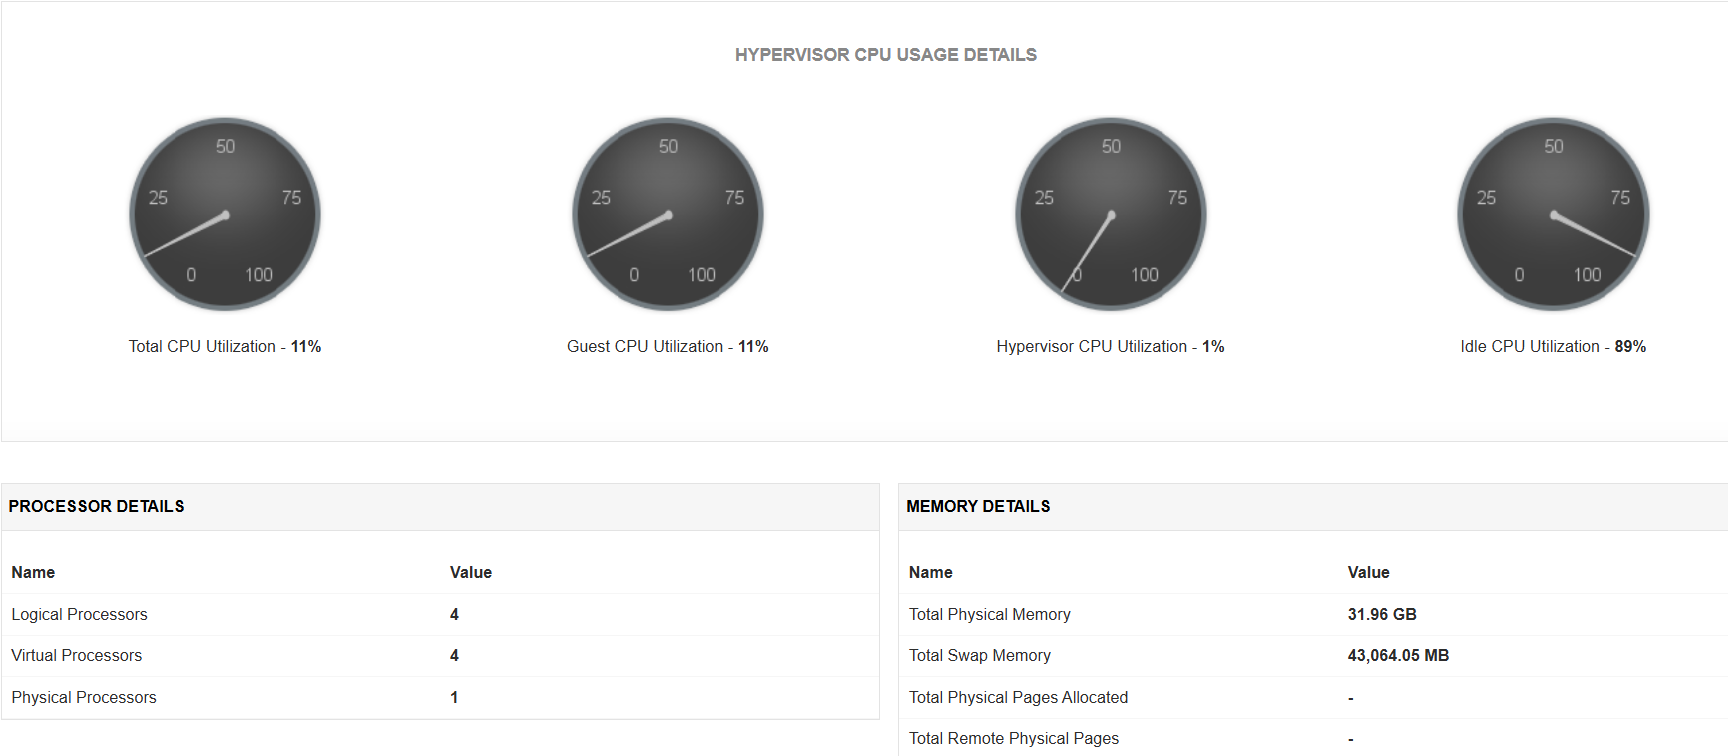
Hypervisor CPU Usage
With Hyper V performance monitor, know which resource is consuming more CPU. Find out if CPUs are running at full capacity or if they are being underutilized. Metrics tracked include Total CPU utilization, Guest CPU utilization, Hypervisor CPU utilization, idle CPU utilization, etc.
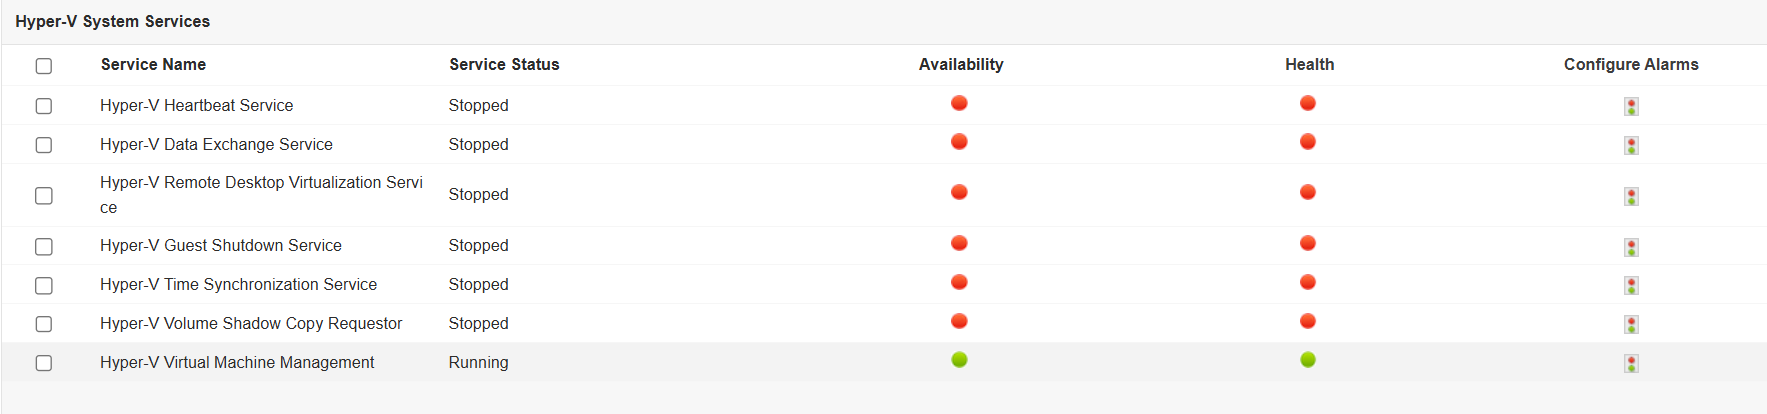
Hyper-V System Services
Perform thorough Hyper V monitoring by tracking the availability and status of critical Hyper-V services such as Hyper-V Image management service, Virtual Machine Management and Networking management service. Administrators can also enable, disable or delete these services from within Applications Manager itself.
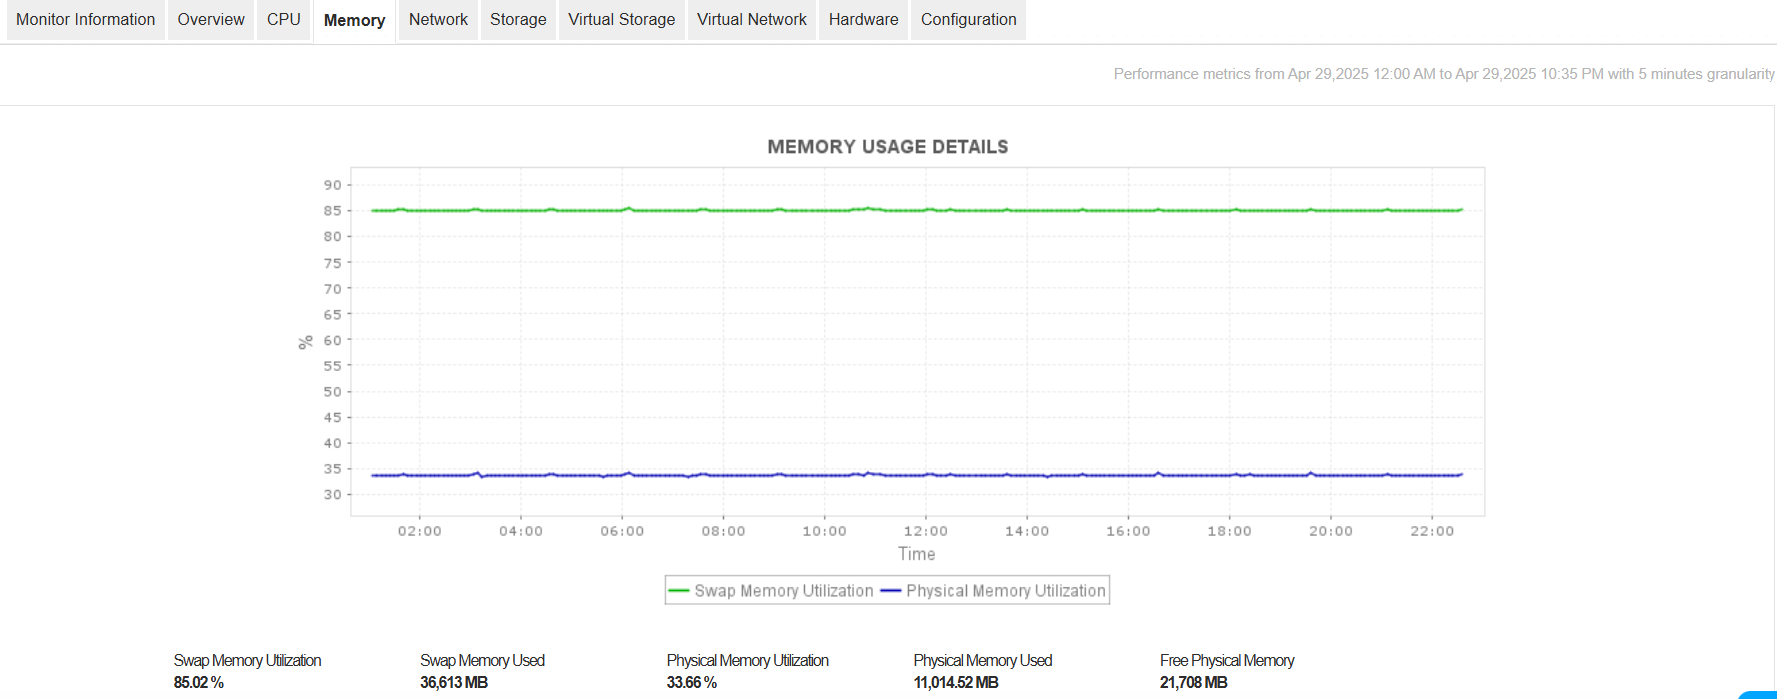
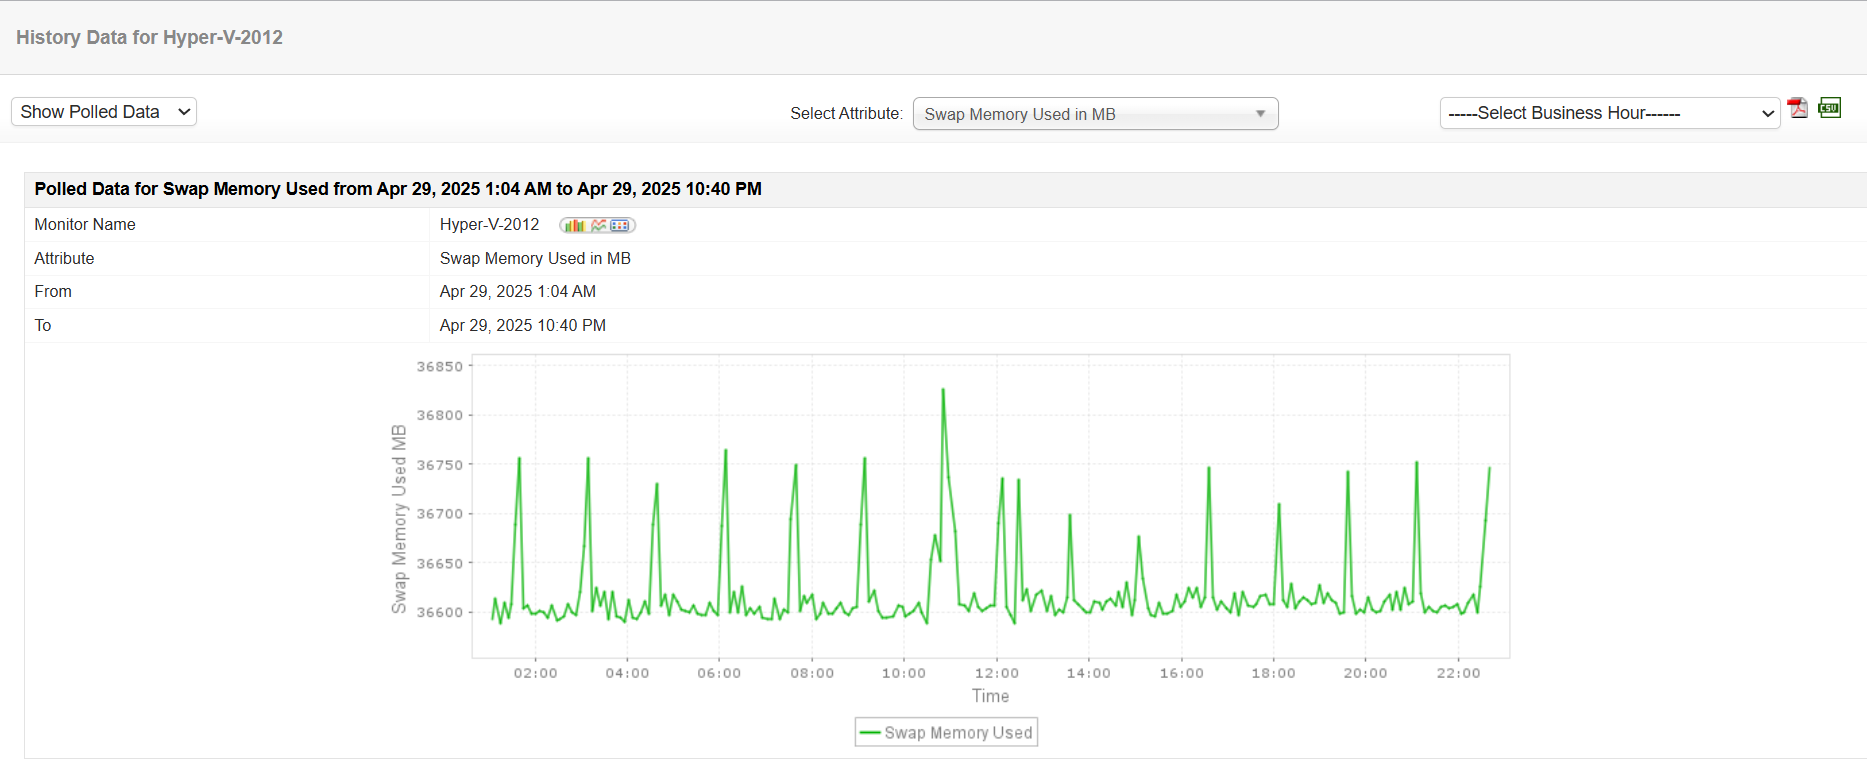
Memory Usage
Avoid the problem of your Hyper-V servers running out of memory. Get notified when the memory usage is high or memory becomes critically low. Metrics tracked include swap memory, physical memory, free physical memory, deposited pages, virtual TLB pages, total remote physical pages, etc.
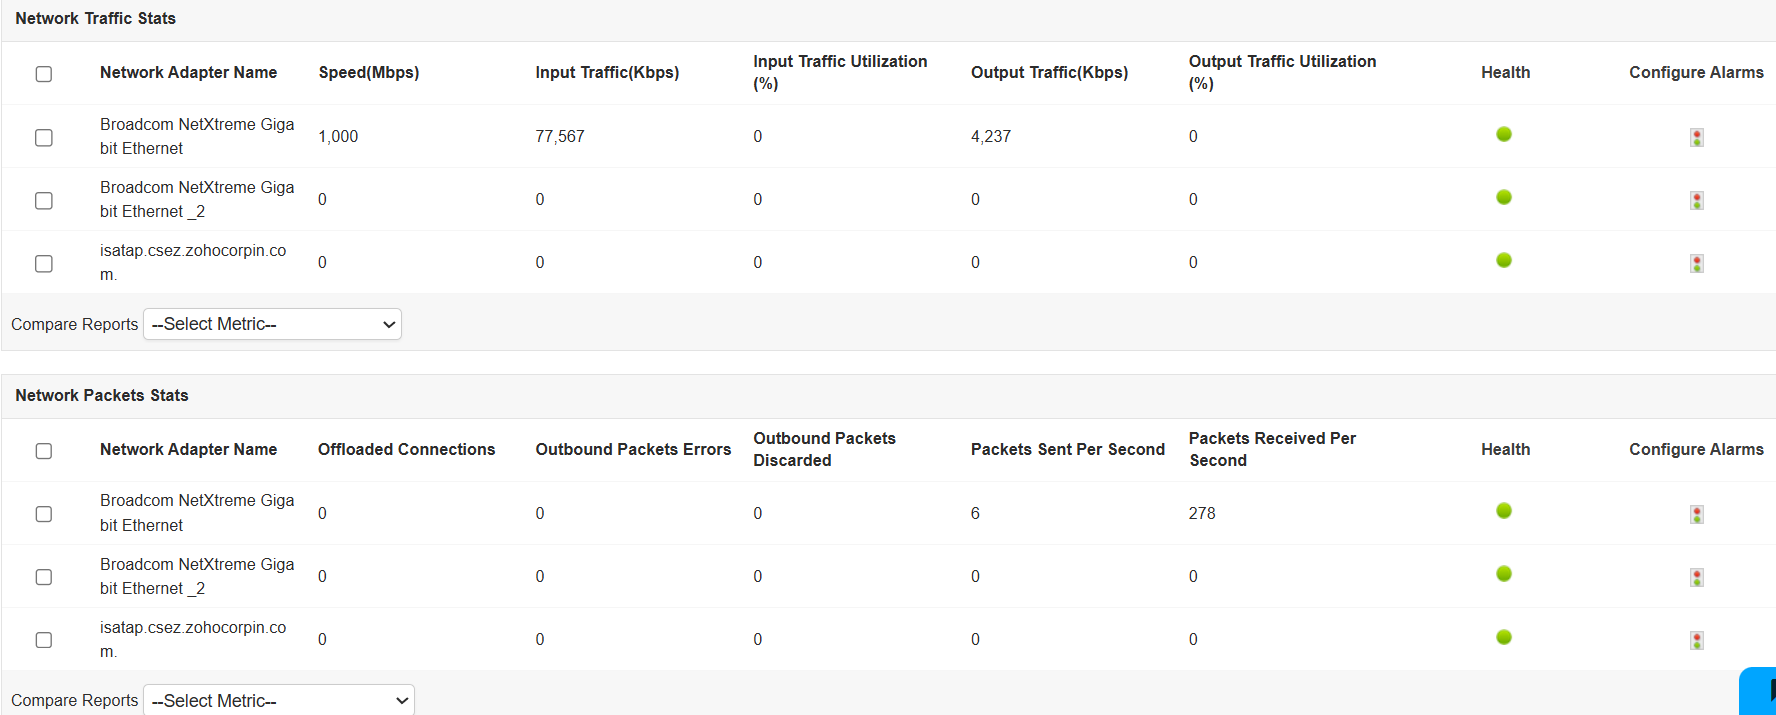
Networking and Virtual Network Statistics
With our Hyper V performance monitoring tool, monitor the health and status of the network interfaces, virtual network adapters, legacy virtual network adapters and virtual switch. The performance can be monitored through attributes such as input/output traffic utilization, offloaded connections, outbound packets errors, data receive rate, data transfer rate, packets received/transmitted, health of interface, etc.
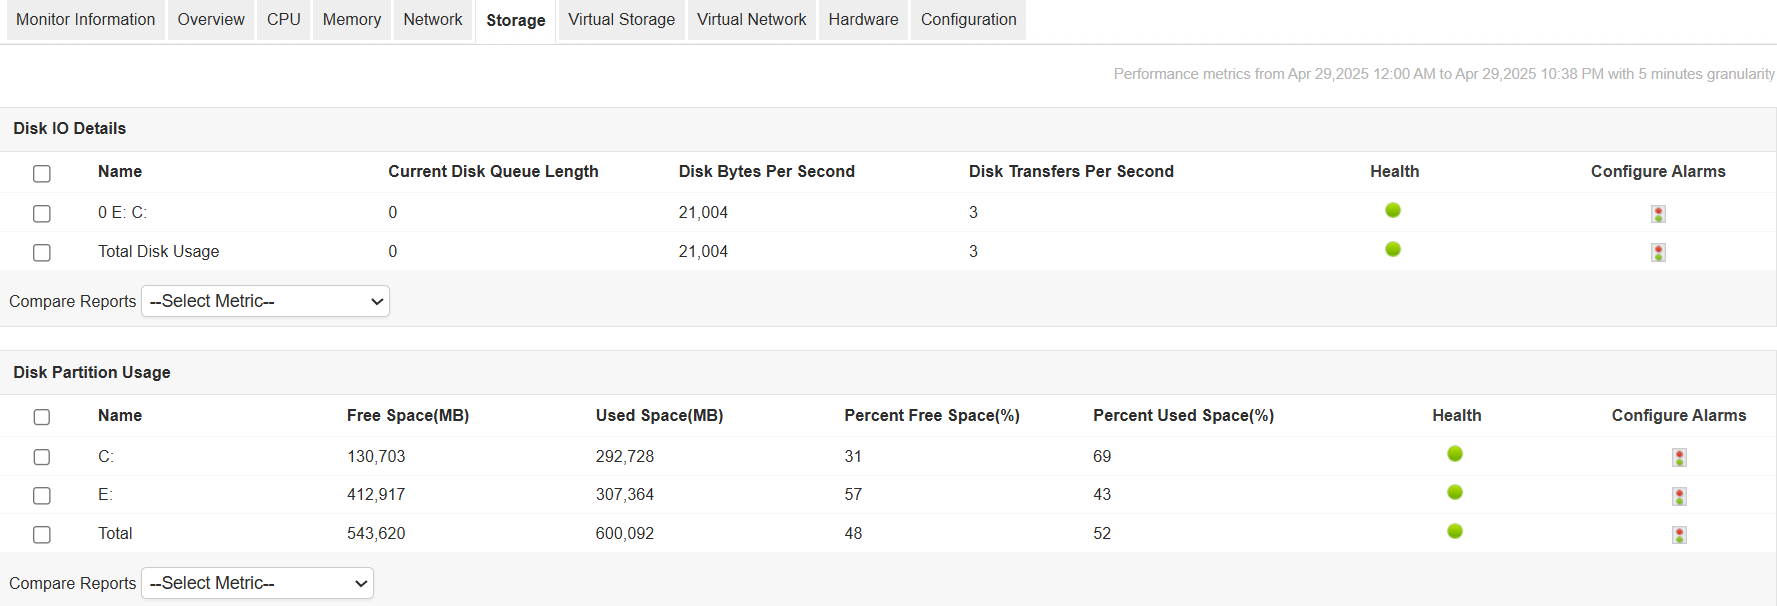
Storage and Virtual Storage Metrics
With Applications Manager's Hyper V performance monitoring capabilities, get an idea of the overall disk performance of the Hyper-V system as well as for each VM. Find out how busy the drives are or if the disks are saturated. Metrics include Current Disk Queue Length, Disk bytes per second, Disk transfers per second, etc.
Top Hyper-V Servers
With Applications Manager's Hyper V monitoring tool, get an overview of the servers that are consuming your resources and take necessary action. Metrics provided include top total CPU utilization consumers, top guest CPU utilization consumers, top idle CPU utilization consumers and top memory consumers.
In-depth Performance Reports
Get insightful reports into the overall performance of Hyper-V servers with our Microsoft Hyper-V monitoring system. Know how your servers are performing over a period of time and analyze possible trends.
Benefits of Hyper-V Performance Monitoring using Applications Manager
- Ensure high uptime and peak performance of your Microsoft Hyper-V host servers and their guest virtual machines.
- Gain insight into the performance of your Hyper-V environment; troubleshoot and resolve problems before end users are affected.
- Plan capacity and make educated decisions about allocating resources to each virtual machine.
- Multi-vendor virtualization support - manage Microsoft Hyper-V and VMware solutions from the same console.
- Agentless monitoring solution that is easy to set up and manage.
