Application monitoring and observability solution for modern IT
- 150+ technologies
- Deep diagnostics
- AI-powered insights
ManageEngine Applications Manager empowers your IT team with full-stack visibility across cloud and on-premise applications. Gain deep, proactive insights to identify and prevent performance bottlenecks, optimize application health, and deliver seamless user experiences. This unified platform simplifies IT and DevOps processes, streamlining application monitoring, driving peak performance and a competitive edge for your business.
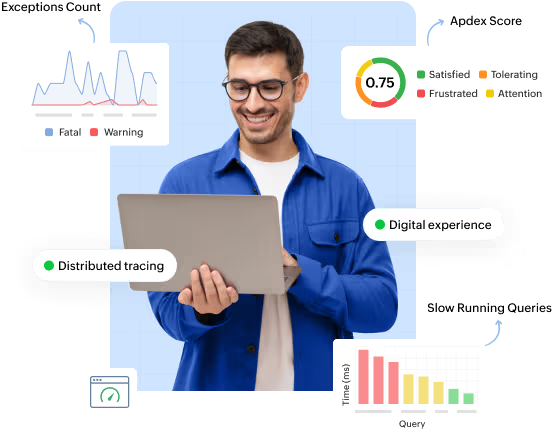
Application Managers and LOB owners can track digital experience, understand the customer journey, quantify the revenue impact of poor application performance, and optimize application usage and revenue.
Enables IT operations teams to proactively detect issues and troubleshoot faster with accurate root cause analysis. Understand resource usage trends and fine tune day-to-day operations with our application monitor.
The DevOps monitoring tool helps DevOps/SRE teams correlate performance changes with code commits and builds. Verify if frequent code changes have impacted the performance of your key business applications.
Become aware of application performance issues as they arise before the users notice. Quickly differentiate if the problem is with the application code or an infrastructure issue or an improper configuration of the application. Empowers application support and helpdesk teams to respond to user complaints quickly.
Enables application architects and CTOs to analyze the medium to long term performance of business applications and the infrastructure tiers supporting them. Ensure applications deliver a great user experience and meets business goals.
Reduce risk during cloud migration by getting deep visibility into cloud, on-premises, and hybrid environments with our application monitoring tool. Helps maintain platform reliability, business continuity and overall cloud application management.


It allows us to track crucial metrics such as response times, resource utilization, error rates, and transaction performance. The real-time monitoring alerts promptly notify us of any issues or anomalies, enabling us to take immediate action.
Reviewer Role: Research and Development

Tech Support Manager, Lexmark