Ruby on Rails Monitoring
Monitor end-to-end Ruby on Rails transactions from HTTP request through your application code to the database. Detect N+1 queries, optimize memory usage, trace method-level performance, and monitor background jobs - all from a single console.
End-to-End Web Transaction Visibility
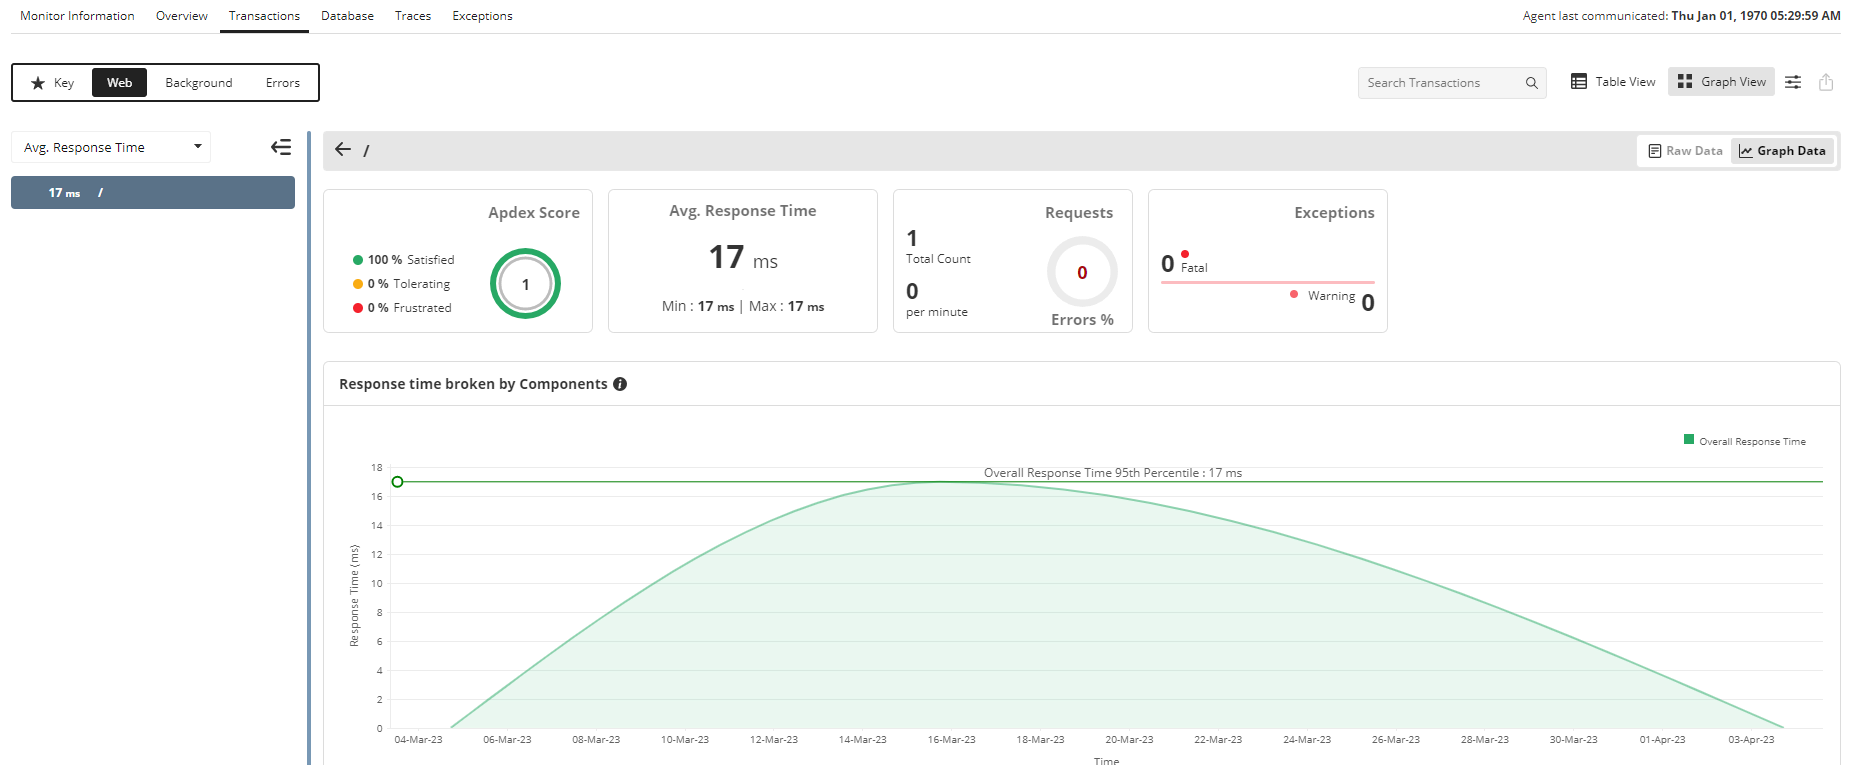
Gain full-stack awareness of every Rails web transaction. Trace response times from the initial HTTP request through your controller, middleware, and views down to individual SQL queries hitting your database.
- Visualize web transaction response times and throughput
- Break down response times by controller, view, and database
- Identify which tier is causing slow responses
- Track APDEX scores and user satisfaction
Detect N+1 Queries & Memory Optimization
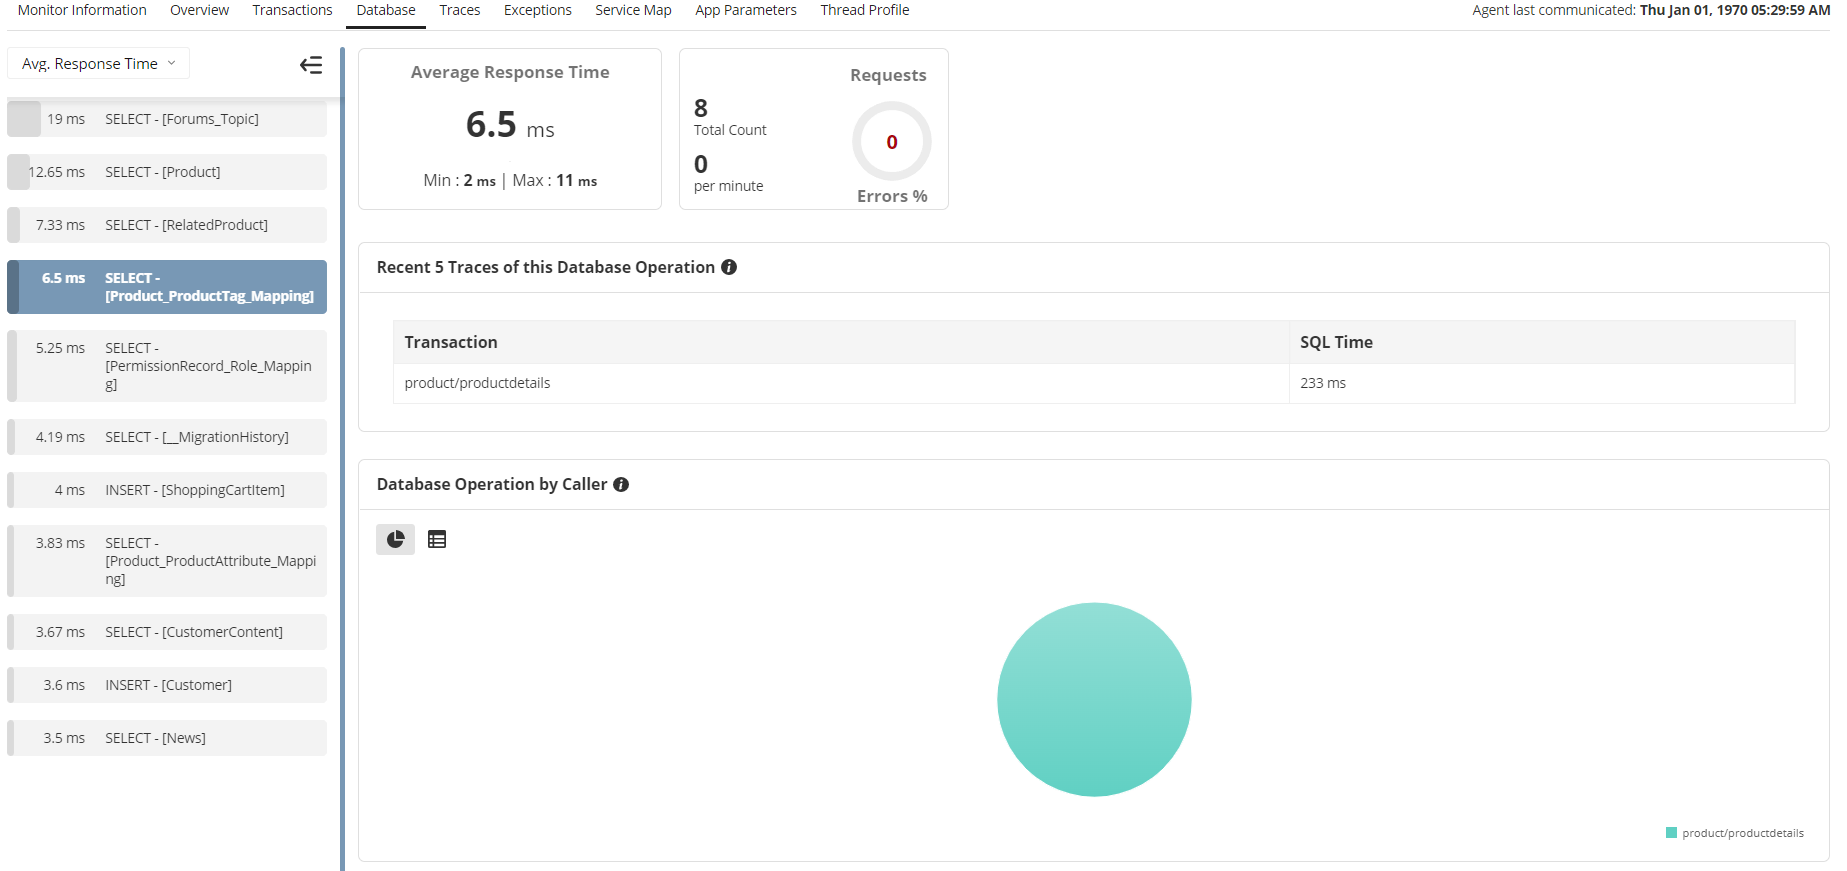
N+1 query problems are among the most common performance killers in Rails applications. APM Insight automatically surfaces these inefficient database patterns and traces them to the exact ActiveRecord call responsible. Monitor memory allocation trends to catch memory bloat early.
- Automatically detect N+1 queries in ActiveRecord
- Track Garbage Collection stats and memory allocation
- Identify unbounded memory growth and memory leaks
- Optimize eager loading strategies
Code-Level Traces & Debugging
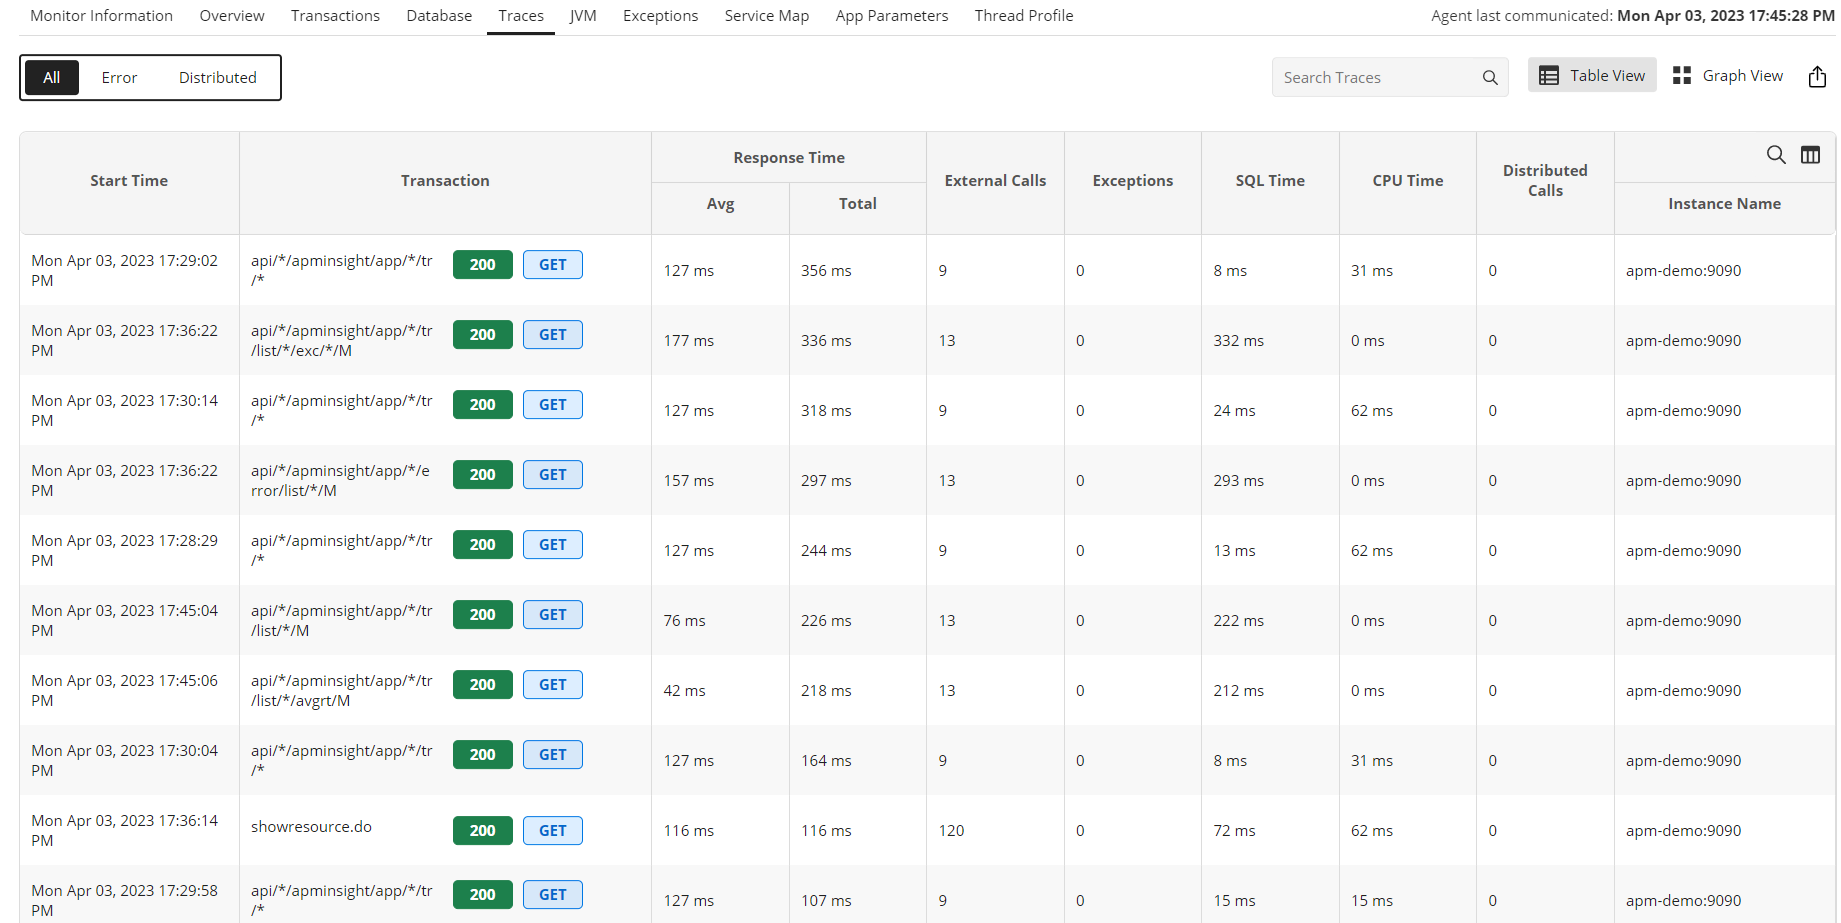
Drill into any slow request with a detailed transaction trace that breaks down execution time method by method. See exactly which controller action, service object, or library consumed the most time, and inspect SQL statements executed at each step.
- Method-by-method execution breakdown in tree structure
- Exact code path visibility with file and line numbers
- SQL statements executed during each method call
- Identify the precise line of code requiring optimization
FAQs
Yes, we support Rails 4.2+ with full instrumentation for modern Rails applications.
2. Can I monitor Sidekiq background jobs?
Yes, Sidekiq jobs are automatically monitored with execution times, failure rates, and queue depth metrics.
3. How does N+1 detection work?
APM Insight analyzes query patterns during each transaction and alerts when redundant queries are detected from the same code path.
4. What about Sinatra and other Ruby frameworks?
We support Sinatra, Grape, and other Ruby frameworks with configurable instrumentation.
5. How do I debug memory leaks?
Track memory allocation trends and correlate with GC stats to identify objects that grow unbounded under production traffic.
6. Is OpenTelemetry supported?
Yes, APM Insight natively ingests OpenTelemetry Ruby SDK data for vendor-neutral instrumentation.
Get started with Ruby Performance Monitoring in just a few minutes!
Experience the benefits of Ruby performance monitoring on your own by downloading Applications Manager's full-fledged, 30-day free trial!

