Java Web Transaction Monitoring
Applications Manager's Java web transaction monitoring agent provides you with unmatched visibility into the way your business applications behave for your end users. It helps to better visualize J2EE web transactions end to end, with performance metrics of all components starting from URLs to SQL queries. This enables DevOps teams to identify and resolve performance degradation, no matter where they originate.
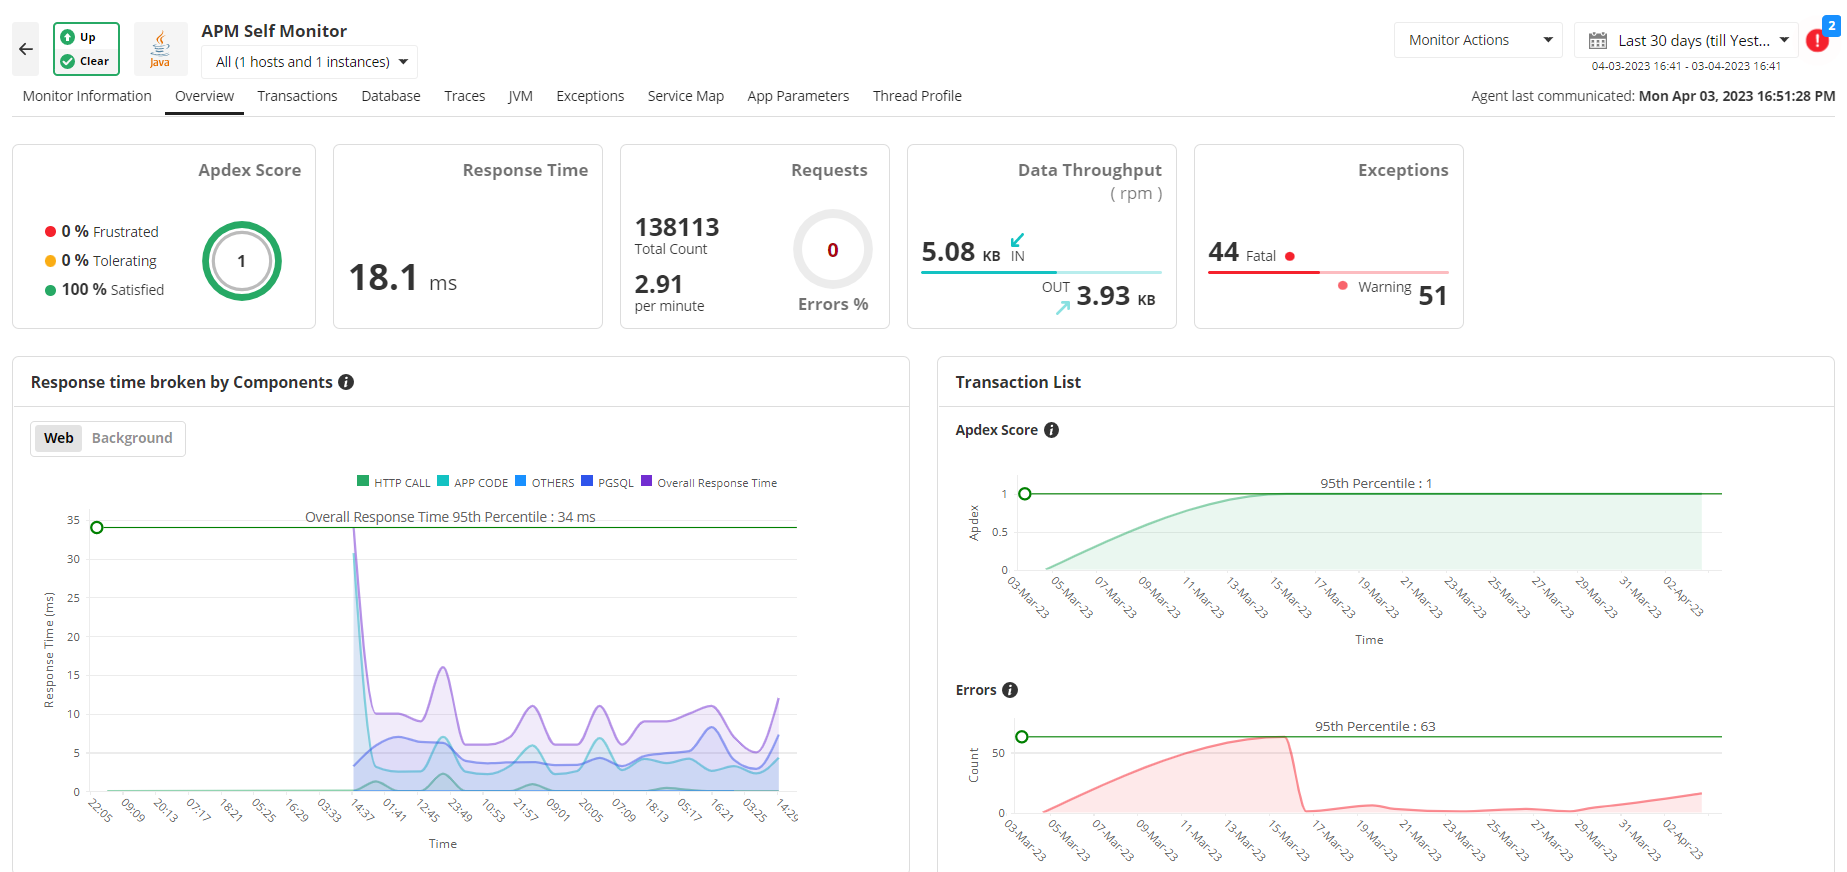
With our Java monitoring system, measure user satisfaction with Apdex scores, transaction traces and performance metrics of Java/ J2EE components, EJB, and SQL statements executed by the URL can be traced. Further, to identify bottlenecks in performance, a trail of the Java method invocations can be seen to identify the offending code.
Gauge the performance of your database
Get detailed performance metrics to identify the slow database calls, database usage and overall performance of the database furnished with detailed graphical and tabular representations. Listing web transactions performed by a database helps you narrow down and isolate the root cause of a performance slowdown.
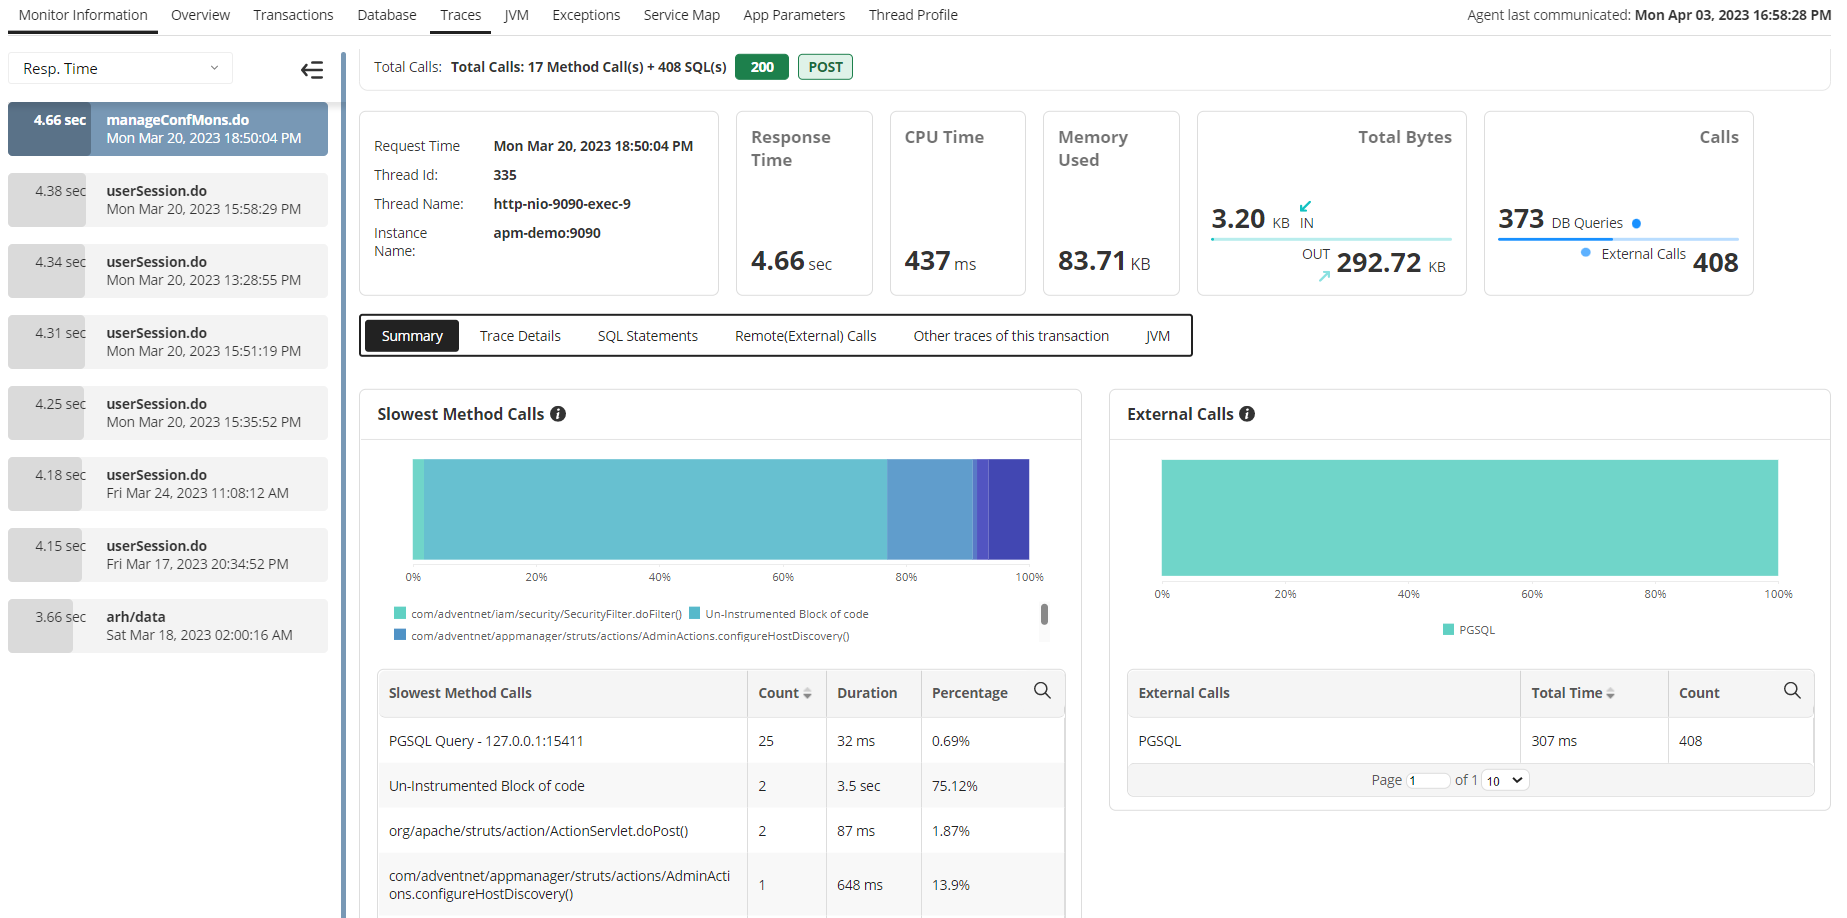
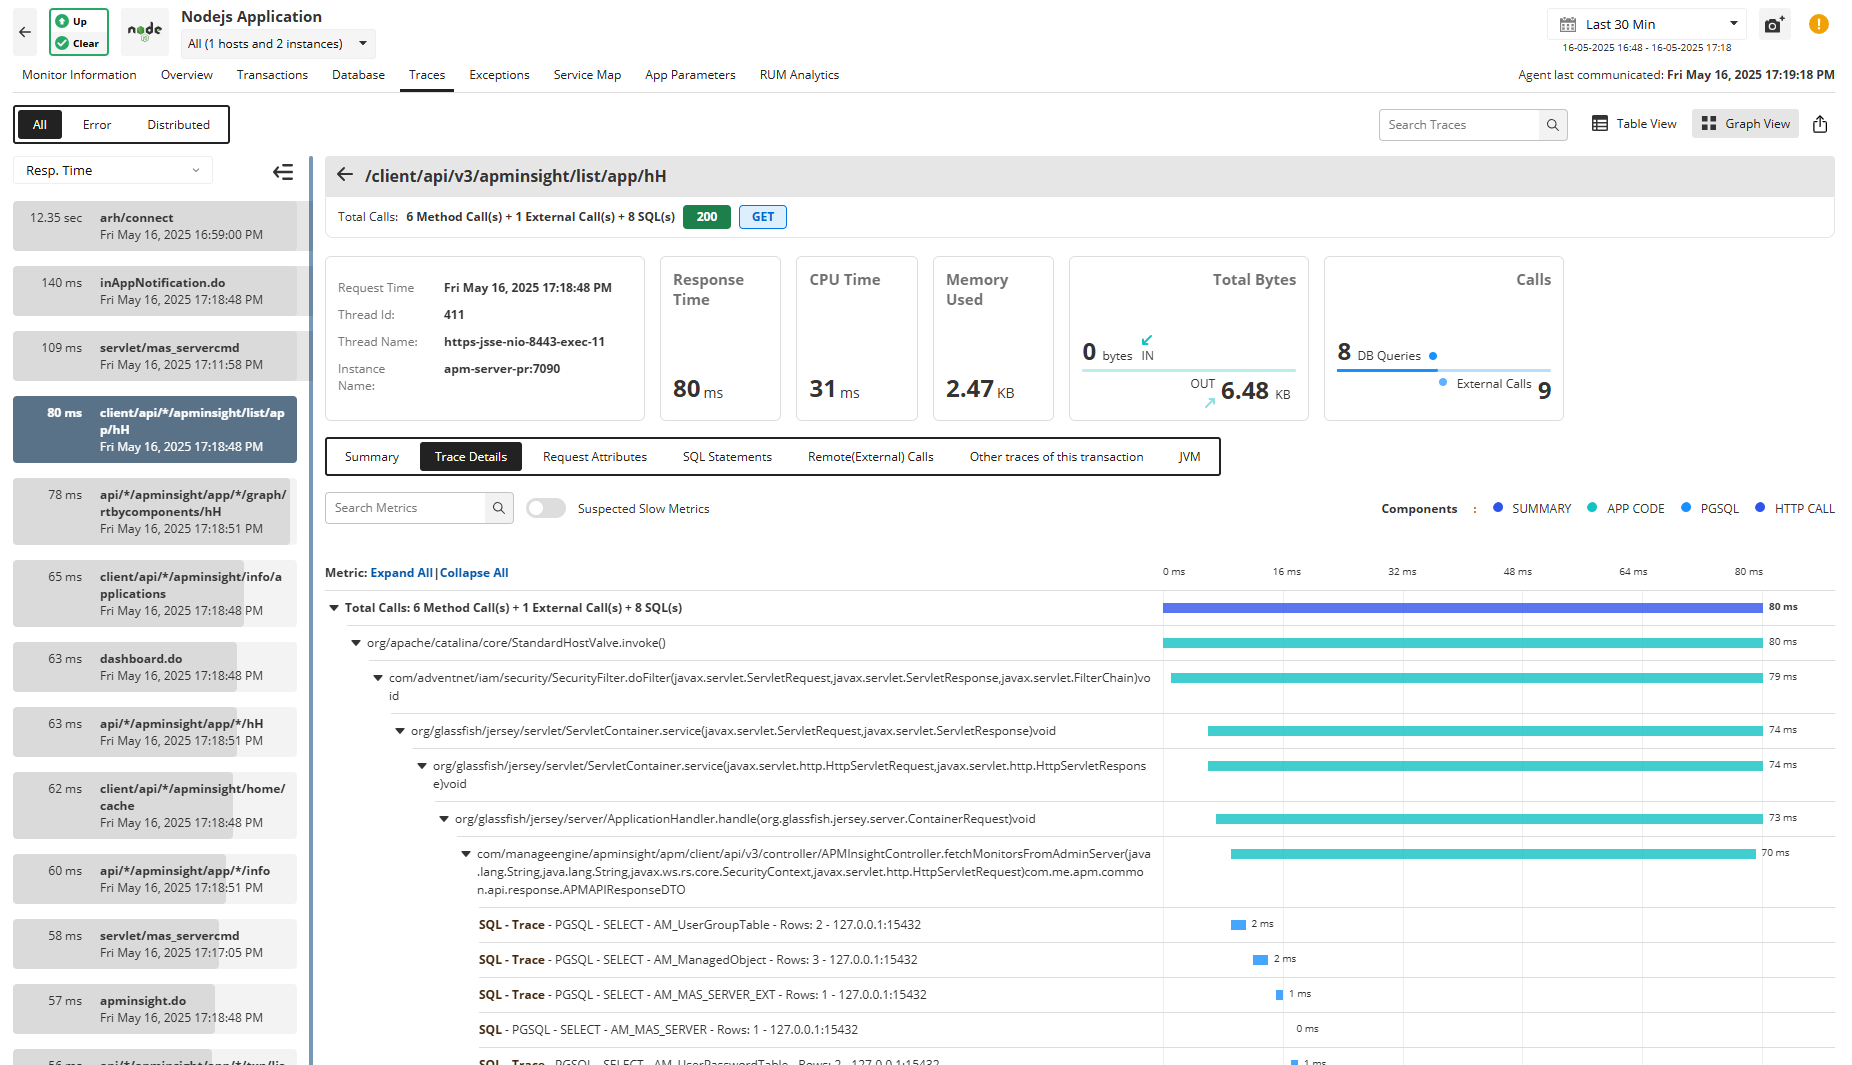
Identify slow traces
Get the execution details (trace) for URLs displayed as a tree structure. The trace will chart the sequence of the internal invocations (methods) of the URL. You can also identify the SQL queries executed during the transaction and hence identify the worst performing database queries.
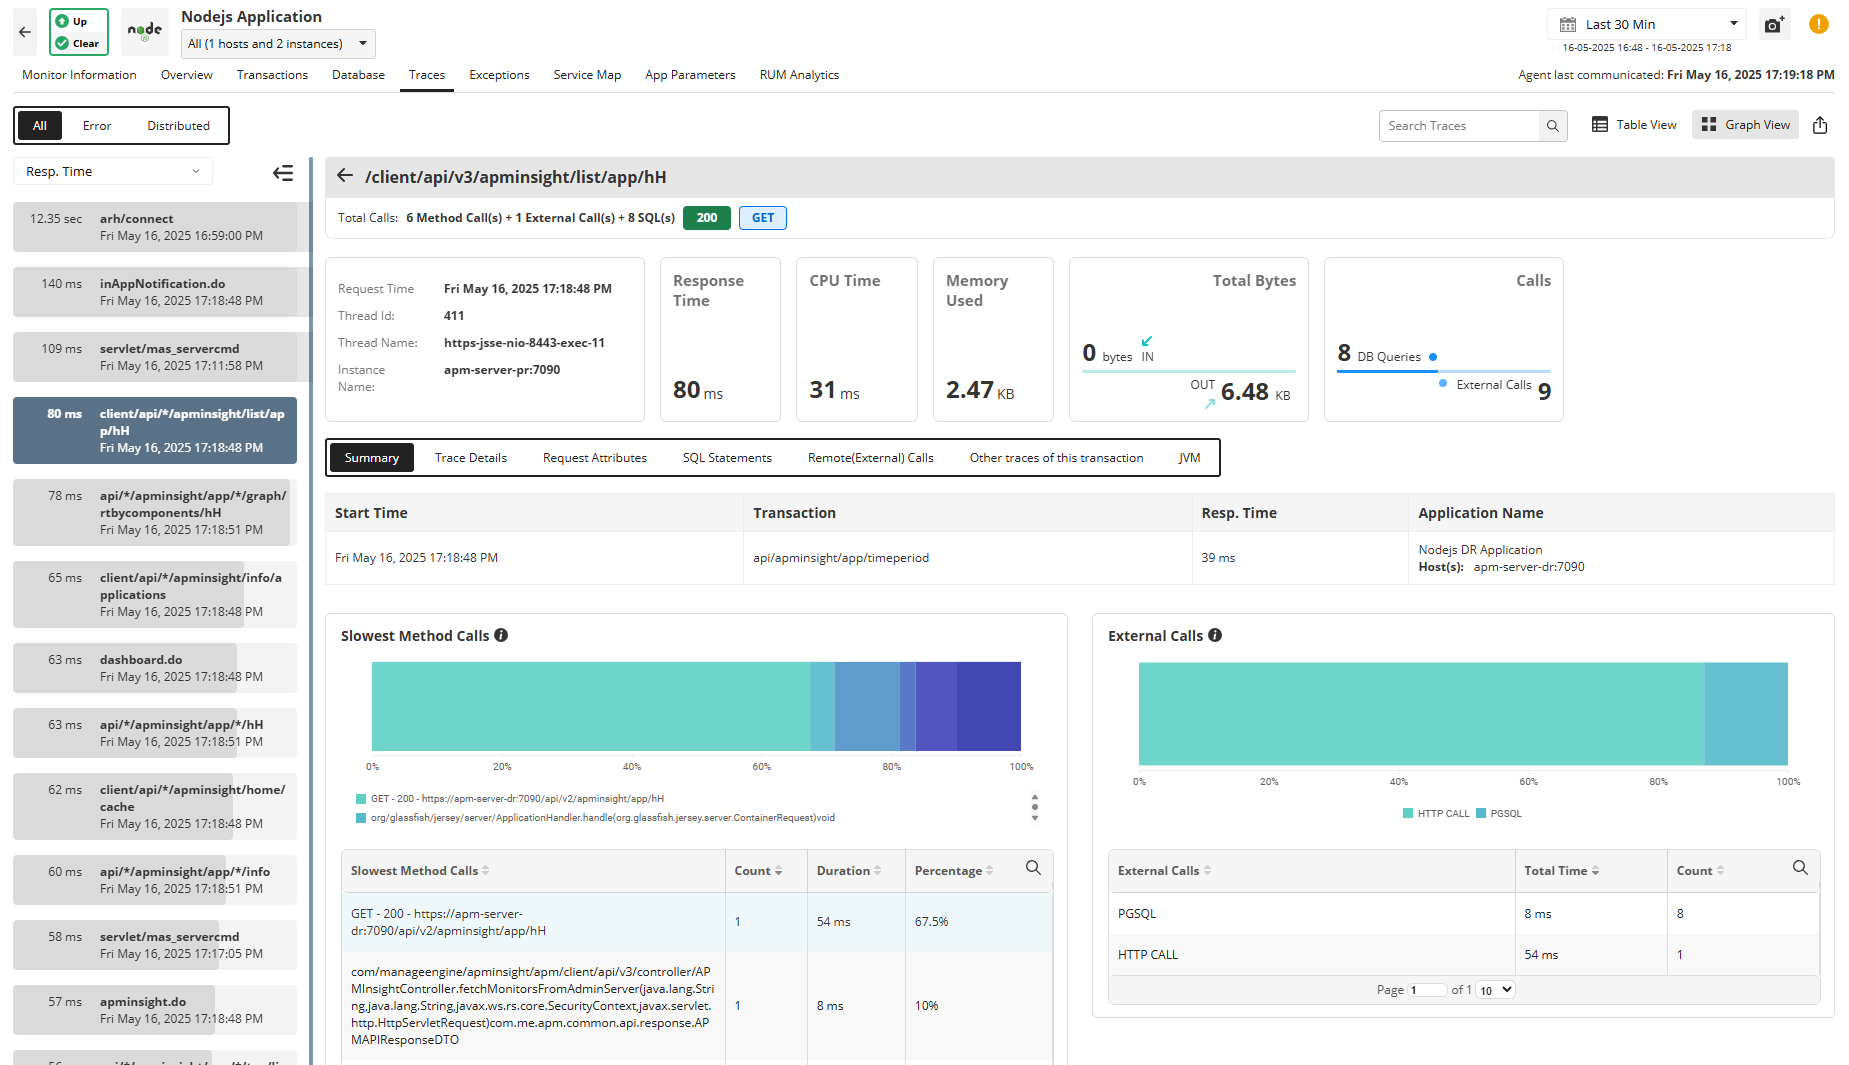
Distributed traces
If your application is running in a microservices environment, you can make use of our distributed tracing capabilities to track calls made from one service to another across various platforms and languages. In the event of an error, you can quickly understand which service is impacted and collaborate with the respective team to fix it.
Understand code behavior
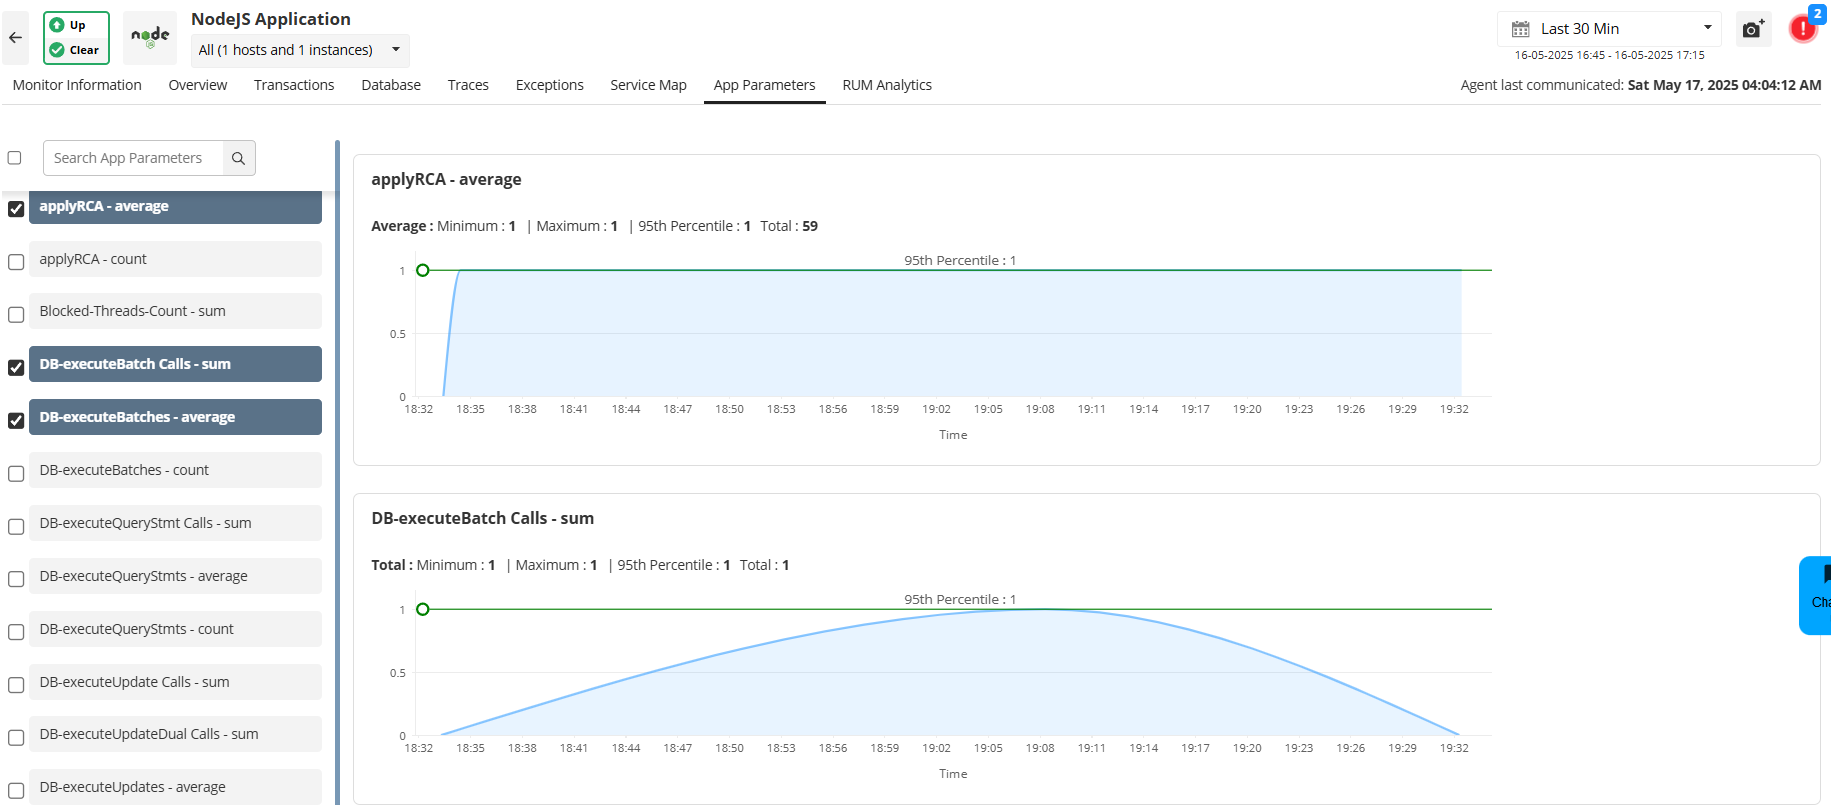
Troubleshoot performance degradation caused by an overload of hits by monitoring the frequency of hits to DB calls, service calls, or user-defined framework calls. This can be useful while you want to check if a particular segment of your code is working properly.
Applications Manager's Java web transaction monitoring tool allows you to configure custom app parameters for your application which can be tracked during runtime. This helps you to determine the hit frequency of specific code blocks, helping you identify parts of your application code that might need optimization.
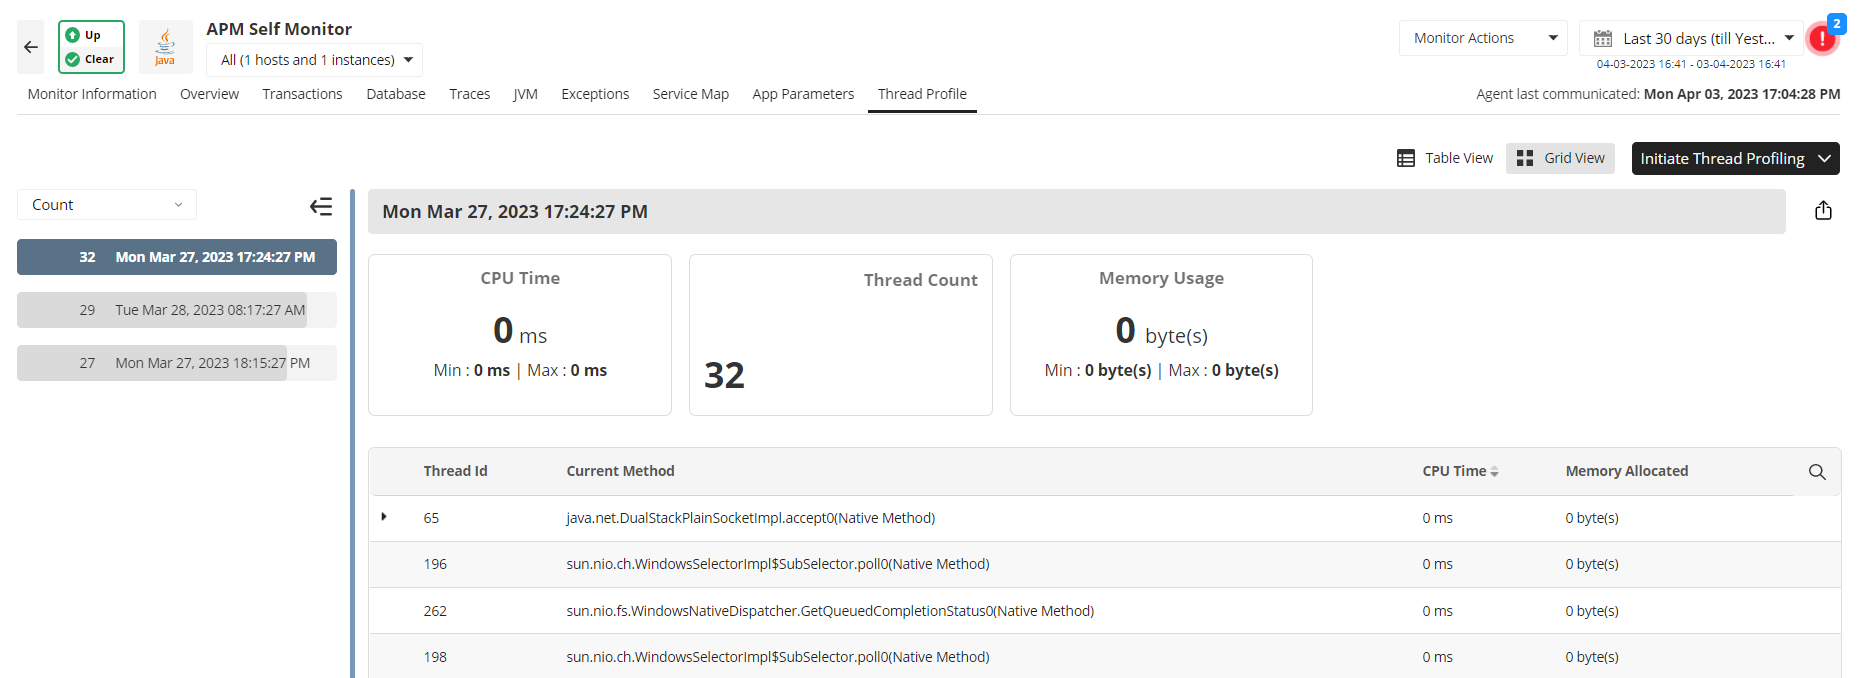
Pinpoint problem areas using Thread Profiling
Resolve issues in production with the help of thread profiling. Identify and isolate high CPU consuming threads and time-consuming methods, and avoid degradation of application performance. Pinpoint the root cause of CPU spikes with ease without having to inspect large amounts of raw data in the thread dumps.
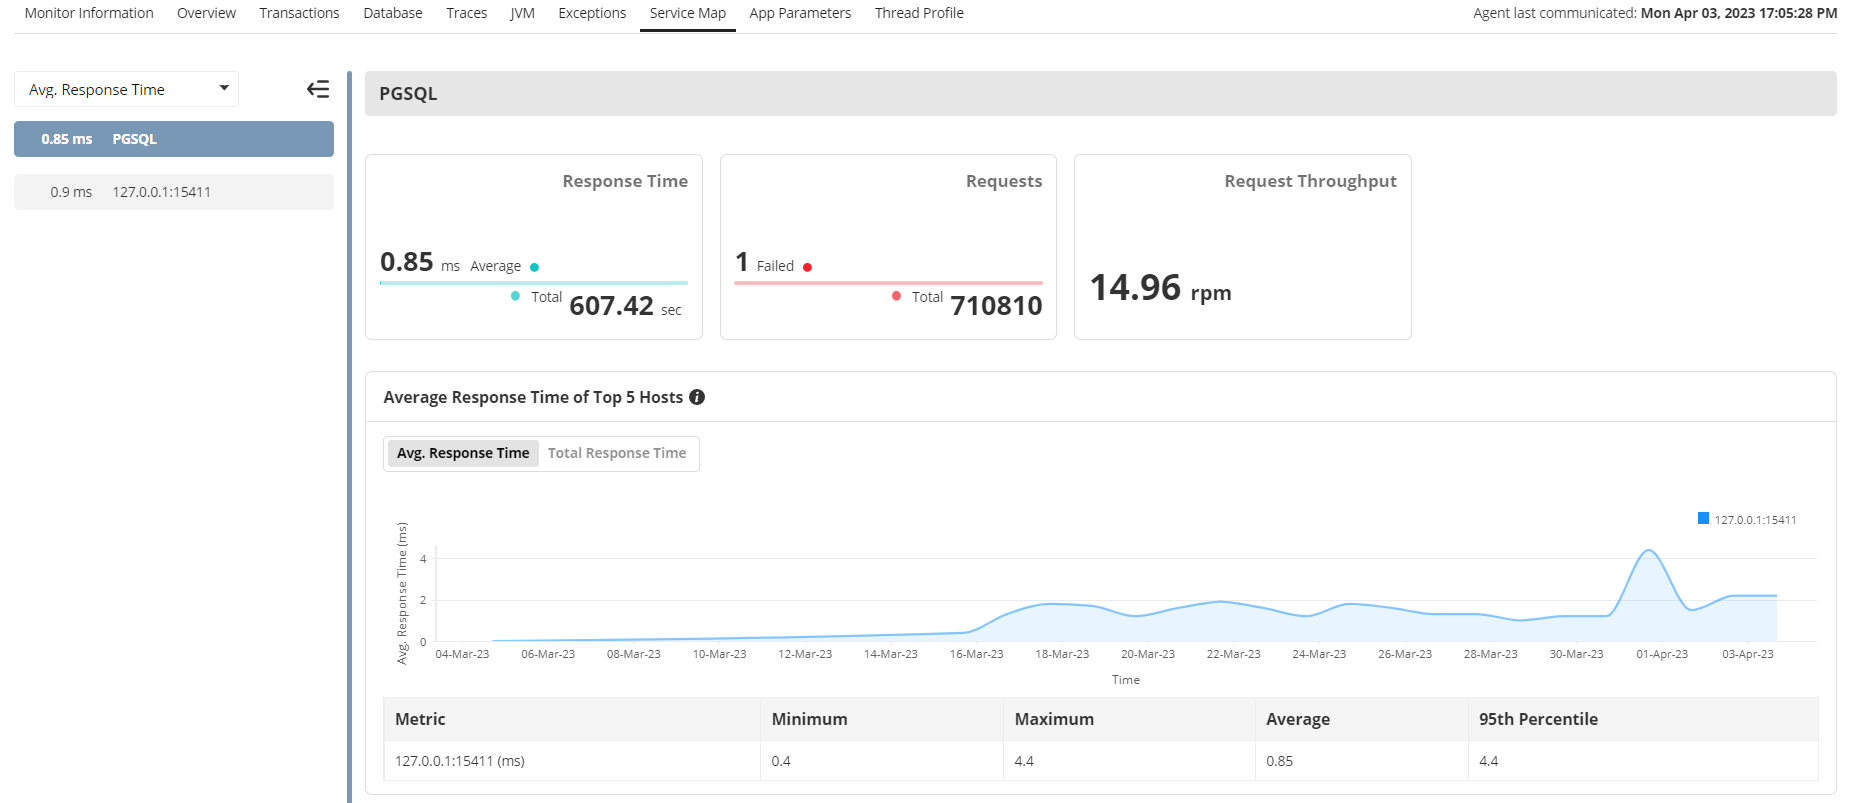
Get an overview of application architecture with automated Service Map
Visualize the topology of your Java application and get information about the status of all external components that your Application is connected to. Use the Service Map's Graph View option to sort the components based on different critical metrics and get minimum, maximum, average, and 95th percentile values. Analyze the failed requests and optimize their health to enhance the performance of your Java applications. You will also be able to quickly understand what other components can be potentially affected by a failing service.