Working with dashboards
Analytics Plus offers a wide range of interactive options for dashboards. When accessing a dashboard, users can view the underlying data, sort, export, share and publish the reports. In this section, we will discuss each of these options in detail.
- Dashboard interactions
- Exporting dashboards and reports
- Emailing a dashboard
- Sharing a dashboard
- Publishing a dashboard
Dashboard interactions
Analytics Plus allows you to perform exploratory analysis of your data using the following interactive features in dashboards.
View underlying data
Users can view the underlying data of a report on the dashboard. Follow the steps below to view the chart's underlying data.
- Navigate to the desired report, click the required data point, and select View Underlying Data. The underlying data of that data point will be displayed.
You can also view the underlying data of the entire report by clicking the More Options at the top right corner of the report and selecting the View Underlying Data option.
Sync Pan and Zoom Movements Across Maps
Keep your maps in sync as you explore data across geographies. When enabled, zooming and panning on one map automatically mirrors the same view across other compatible maps on the same dashboard, making it easier to compare regional data side by side. This includes scroll gestures, drag to pan, and +/— zoom buttons.
Sync pan and zoom movements across maps is enabled by default when you open or create a dashboard. For two maps to sync, they must meet the following conditions:
They must use the same projection type - either both Mercator or both Albers USA projection.
They must display the same geographic scope. For example, two maps showing the entire world will sync, but a map showing only the United States and a map showing only India will not.
When the Home button is clicked, each map returns to its own saved home view. If maps have different home configurations, sync applies only when their bounds are similar.
To disable pan and zoom sync across maps,
Navigate to Settings on your dashboard.
Locate Sync pan and zoom movements across maps and toggle it Off.
Note:
This setting is tab-specific. Maps on other tabs of the same dashboard are not affected.
Maps with no data are excluded from sync and will not be affected by zoom or pan actions from other maps.
Zoom and pan state is not retained in exports.
Drill down
Using this feature, you can click on any data point and visualize the underlying data as a chart. You can either drill down using the path that is already set for the chart, or choose from the list of compatible columns suggested by Analytics Plus.
Follow the steps below to drill down on a chart:
- Navigate to the required chart, and click the data point you want to drill down on. The following options will be displayed:
- Drill Down To: This option allows you to drill down the chart based on the drill down path configured during report creation.
- Drill Down By: This option allows you to dynamically select any column to drill down on the chart.
- Select the required option. Now the chart will be drilled down and the drill down path will be listed as a breadcrumb at the top of the report.
Note: To drill down on data in a dashboard that has been shared to you, the Drill Down permission needs to be enabled while sharing.
Change chart type
Analytics Plus allows you to change the chart type of individual charts in a dashboard.
- Click the Change Chart Type option that appears on mouse over the required chart.
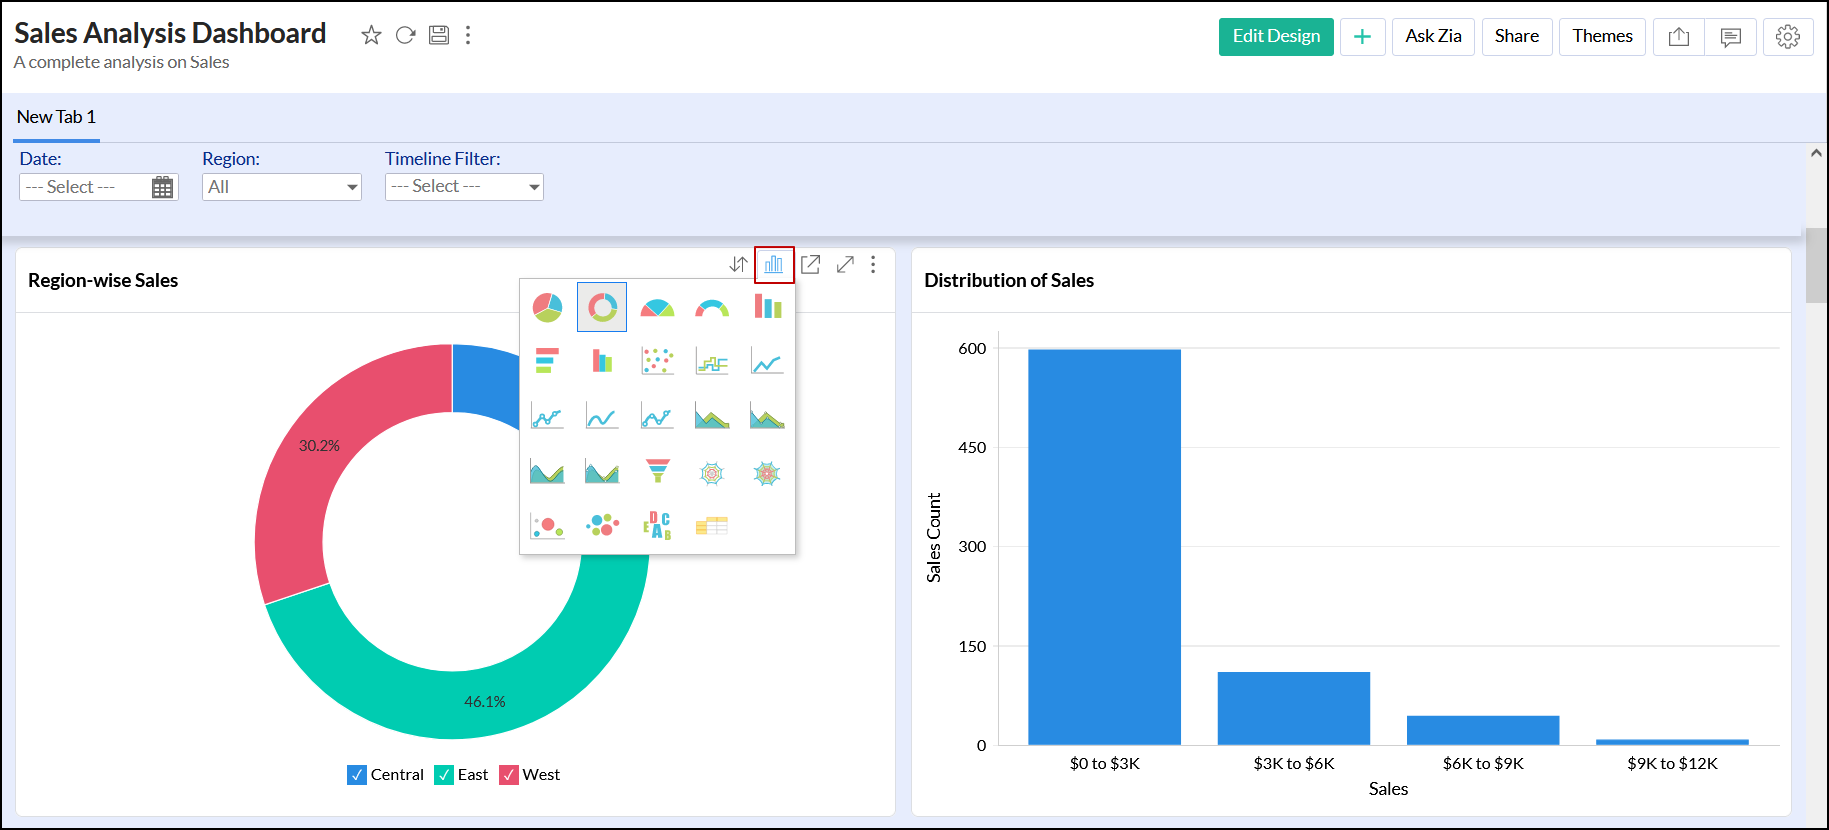
Note: This change will only be reflected for the current session, and cannot be saved. To change the chart type of a report permanently, use the Open in new tab option to open and modify the report as needed.
Maximize embedded reports
You can maximize the embedded report to view in full dashboard layout. To do this,
- Click the Maximize icon that appears on mouse over the required chart, or double-click the report header. The report will be open in full dashboard layout along with the user filters.
- To minimize the report, you can either double-click the report header again or click the Minimize icon.
Note: When maximizing a particular report, the other components of the dashboard apart from the user filters will be hidden. However, any changes made to the user filters will be applied to those hidden components as well.
Exporting dashboards and reports
ManageEngine Analytics Plus allows you to export the entire dashboard or individual reports in your dashboard.
Exporting a dashboard
Analytics Plus offers exporting and emailing capabilities, which enable you to view the dashboard when you have to work offline and email them. You can export a dashboard as PDF, PPT, or HTML zip file. Click here to learn more.
Exporting a report
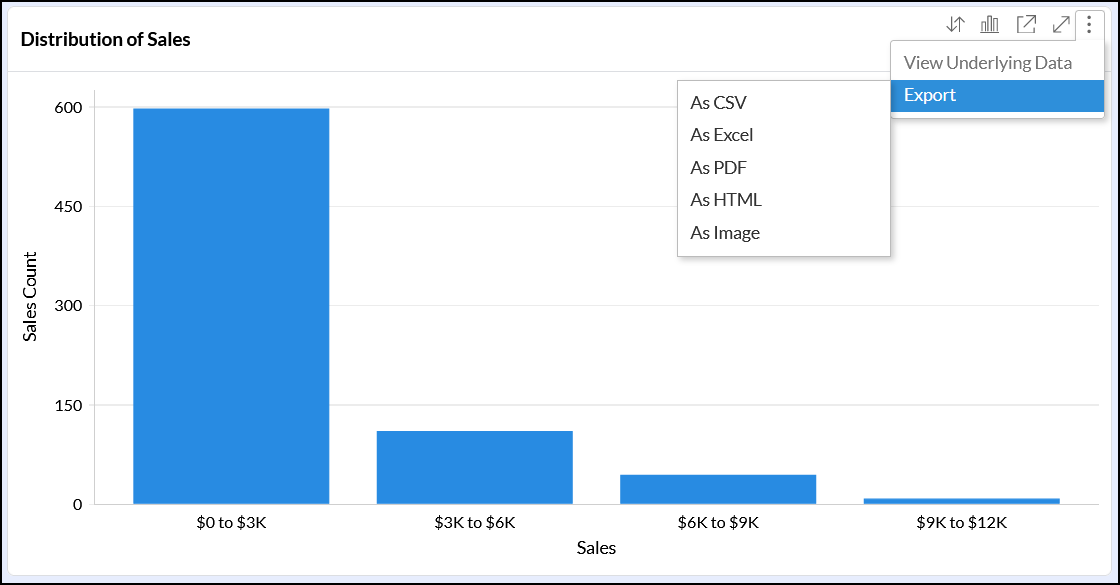
ManageEngine Analytics Plus allows you to export the individual reports in a dashboard. Follow the steps below to export a report:
- Navigate to the required report in the View Mode of the dashboard.
- Click the More Options icon that appears on mouse over.
- Choose the Export option and select the required file format. Click here to learn more about exporting a report.
Emailing Dashboard
ManageEngine Analytics Plus allows you to email your dashboard easily, to facilitate better collaboration with your colleagues. You can also configure schedules to automatically email dashboards at periodic intervals.
Follow the steps below to email a dashboard:
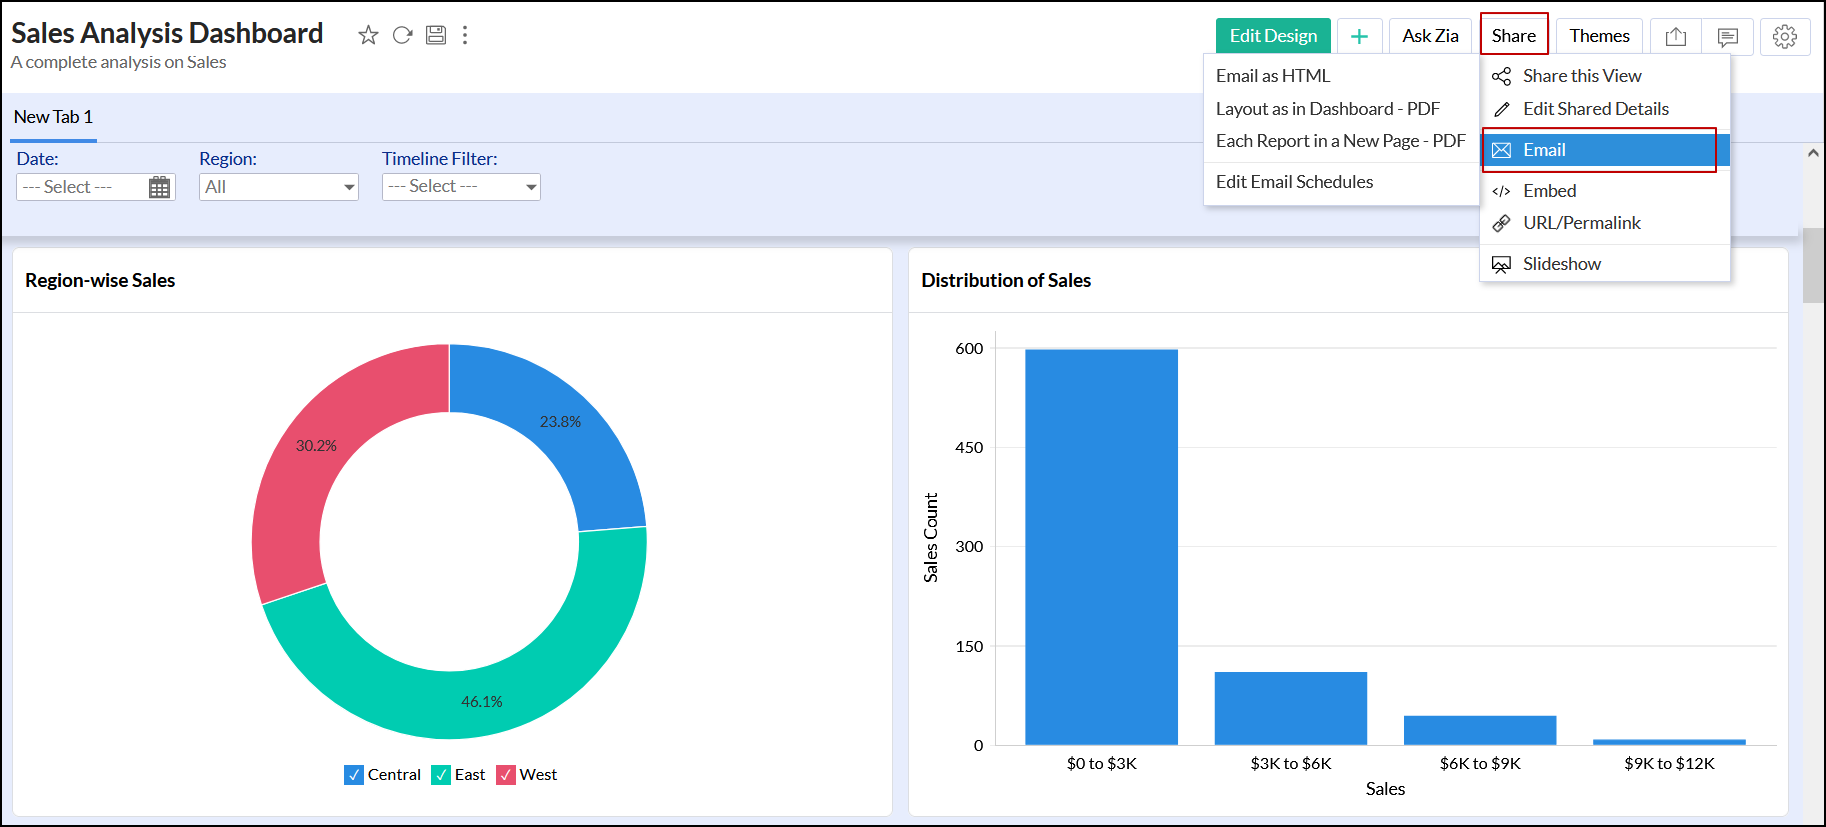
- Click the Share button at the top right corner of your dashboard and navigate to the Email option. The following options will be available:
- Email as HTML: This options allows you to email the dashboard in HTML file format.
- Layout as in Dashboard - PDF: Select this option to email the dashboard in a PDF while retaining the dashboard's original layout.
- Each Report in a New Page - PDF: This option allows you to email the dashboard as a PDF file with a single column layout containing each report in a new page.
On selecting the required option, the Email As screen appears. Add the required email addresses, edit the email's subject and contents, apply the required filter criteria, and click Send. To learn more about the various options available while emailing a dashboard, refer to this documentation.
Sharing a dashboard
ManageEngine Analytics Plus allows you to share your dashboards with a set of user permissions to read, write, export and share. The shared users will be allowed to do only the permitted actions when they access the shared dashboard.
Refer to the sharing and collaboration documentation to know more about sharing a dashboard.
Publishing a dashboard
ManageEngine Analytics Plus also allows you to embed your dashboards in a website, web application, blog or an intranet page.
Refer to the publishing options documentation to know more about publishing a dashboard.

