Viewing workspaces
Analytics Plus homepage
- How do I access the workspaces that I have created in Analytics Plus?
- How do I access the workspaces that have been shared to me?
- How do I access dashboards in Analytics Plus?
- How do I rename a workspace?
- Can I delete a workspace in Analytics Plus?
- Can I take a backup of my Workspaces?
- How do I copy a workspace?
- Is it possible to create a workspace that is similar to another workspace?
- Can I bookmark a workspace as favorite?
- Can I set a workspace as default?
- Is it possible to access any sample workspaces in Analytics Plus?
- Can I view the public workspaces shared by users?
Workspace Explorer
- What is the Workspace Explorer?
- Is it possible to customize the way the tables, reports and dashboards are displayed in the Explorer?
- Is it possible to organize the way views are grouped in the side panel?
- What is Viewer Mode?
- Can I create folders and sub-folders in a workspace?
- Is it possible to move the sub-folder of one folder to another within a workspace?
- Can I make parent folders as sub-folders within another folder?
- Is it possible to turn a sub-folder into a parent folder?
- Is it possible to mark a sub-folder as a default folder?
- Is it possible to move views from one folder to another within a workspace?
- Is there an easy way to search for views in the workspace?
- Is it possible to bookmark important views in a workspace?
- How do I view the workspace's data source?
- How can I get all the details of the Views in my workspace?
- Can I view the relational data model of my Workspace?
- Can I view a report or table's dependency details?
- Is it possible to recover the views that have been deleted in Analytics Plus?
Tagging Views in your Workspace
- What are tags and how do they help manage your workspace?
- How to add a tag to a view in Analytics Plus?
- How to modify or remove tags in Analytics Plus?
- How do I manage tags globally across your workspace?
Analytics Plus homepage
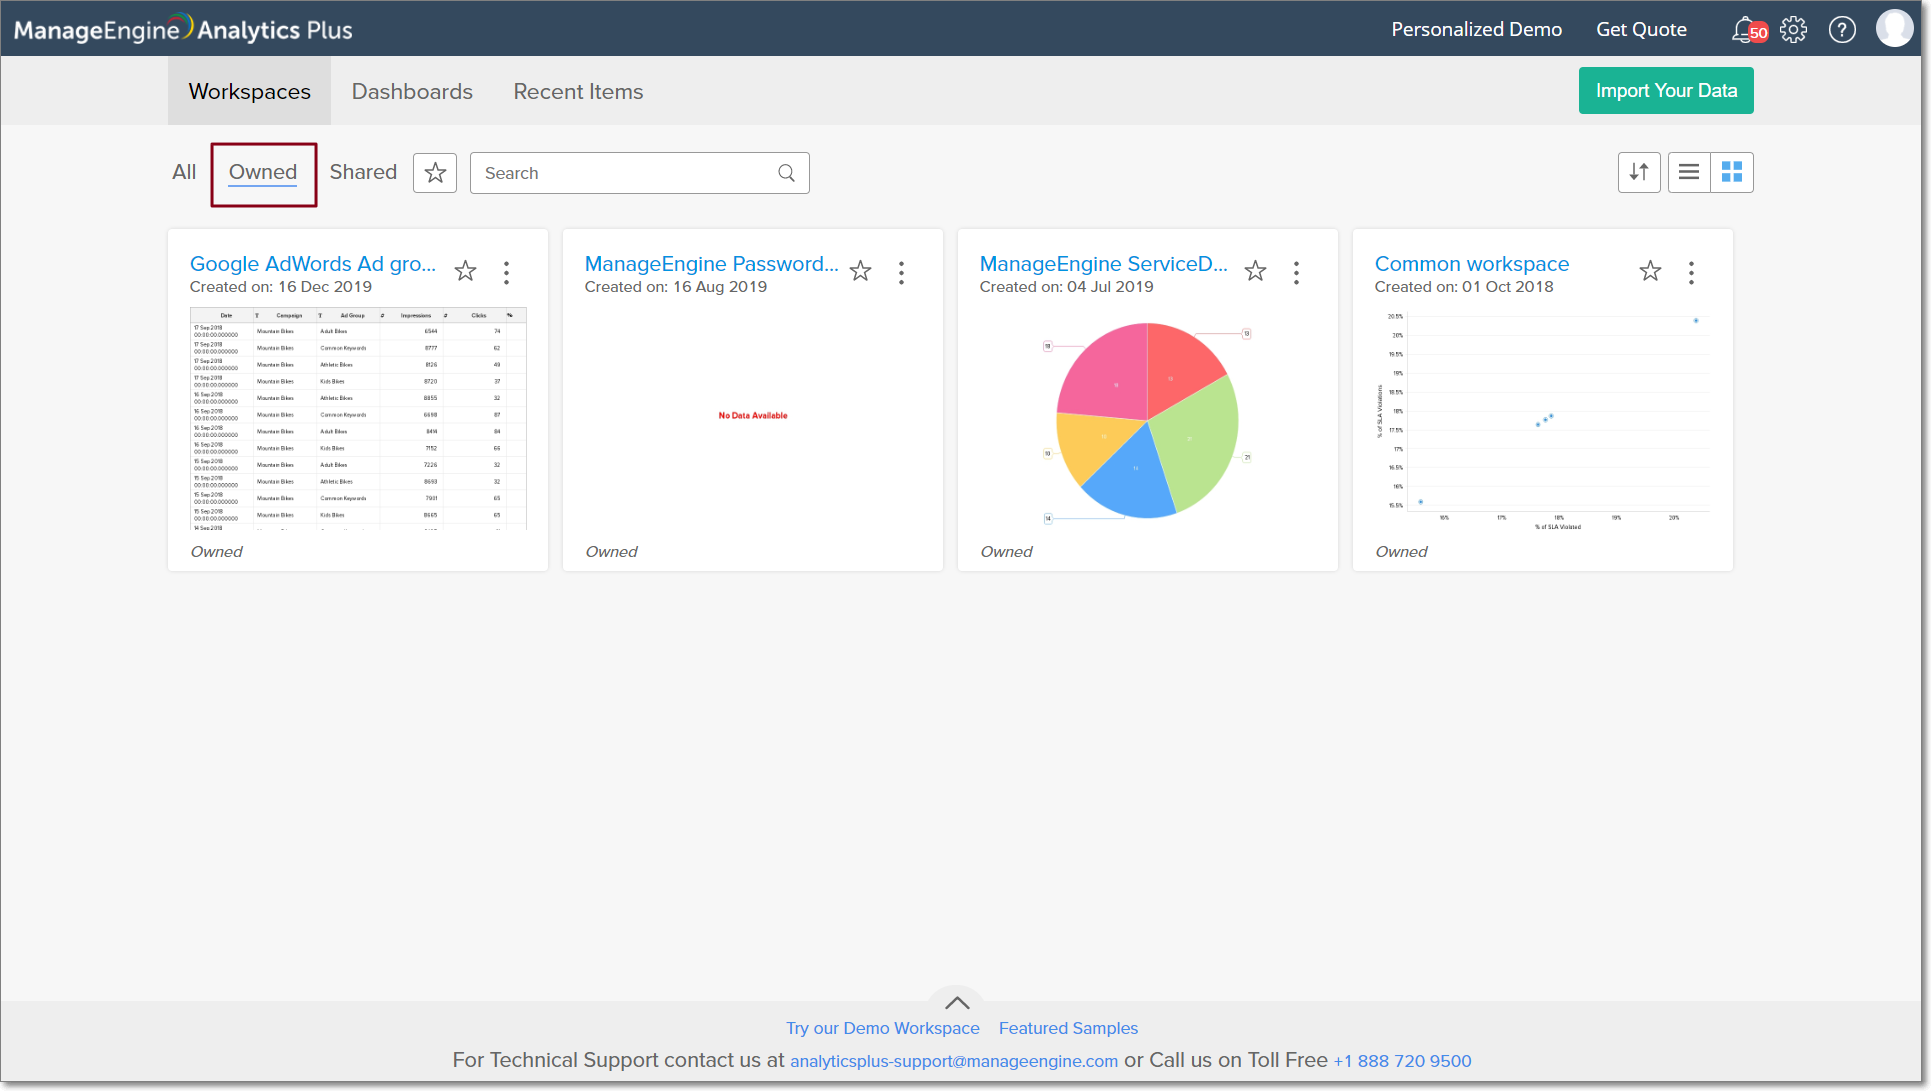
1. How do I access the workspaces that I have created in Analytics Plus?
All the workspaces that you have access to will be listed in the Workspaces tab of the Analytics Plus homepage. To view the workspaces that you have created, click the Owned button.
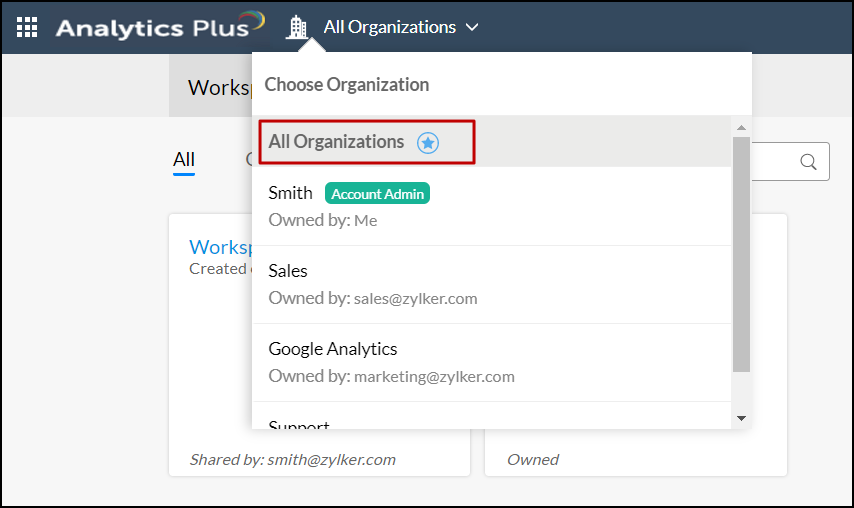
2. How do I access the workspaces that have been shared to me?
To view all the workspaces shared by different organizations, follow the steps below.
Navigate to the Analytics Plus home page, click the Organization icon and choose All Organizations.
Head to the workspaces section and click the Shared button. This lists the shared workspaces, along with the details of the workspace owner.
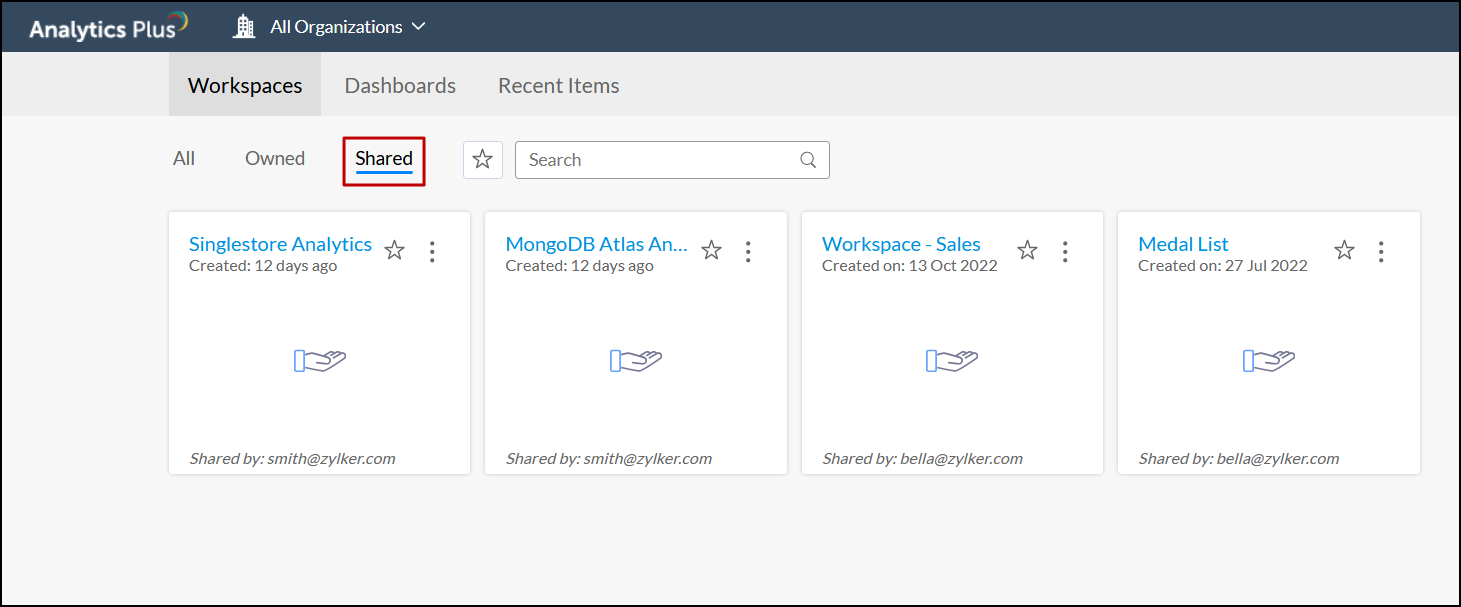
To view the workspaces shared by a specific organization, click the Organization icon and select the required organization from the dropdown.
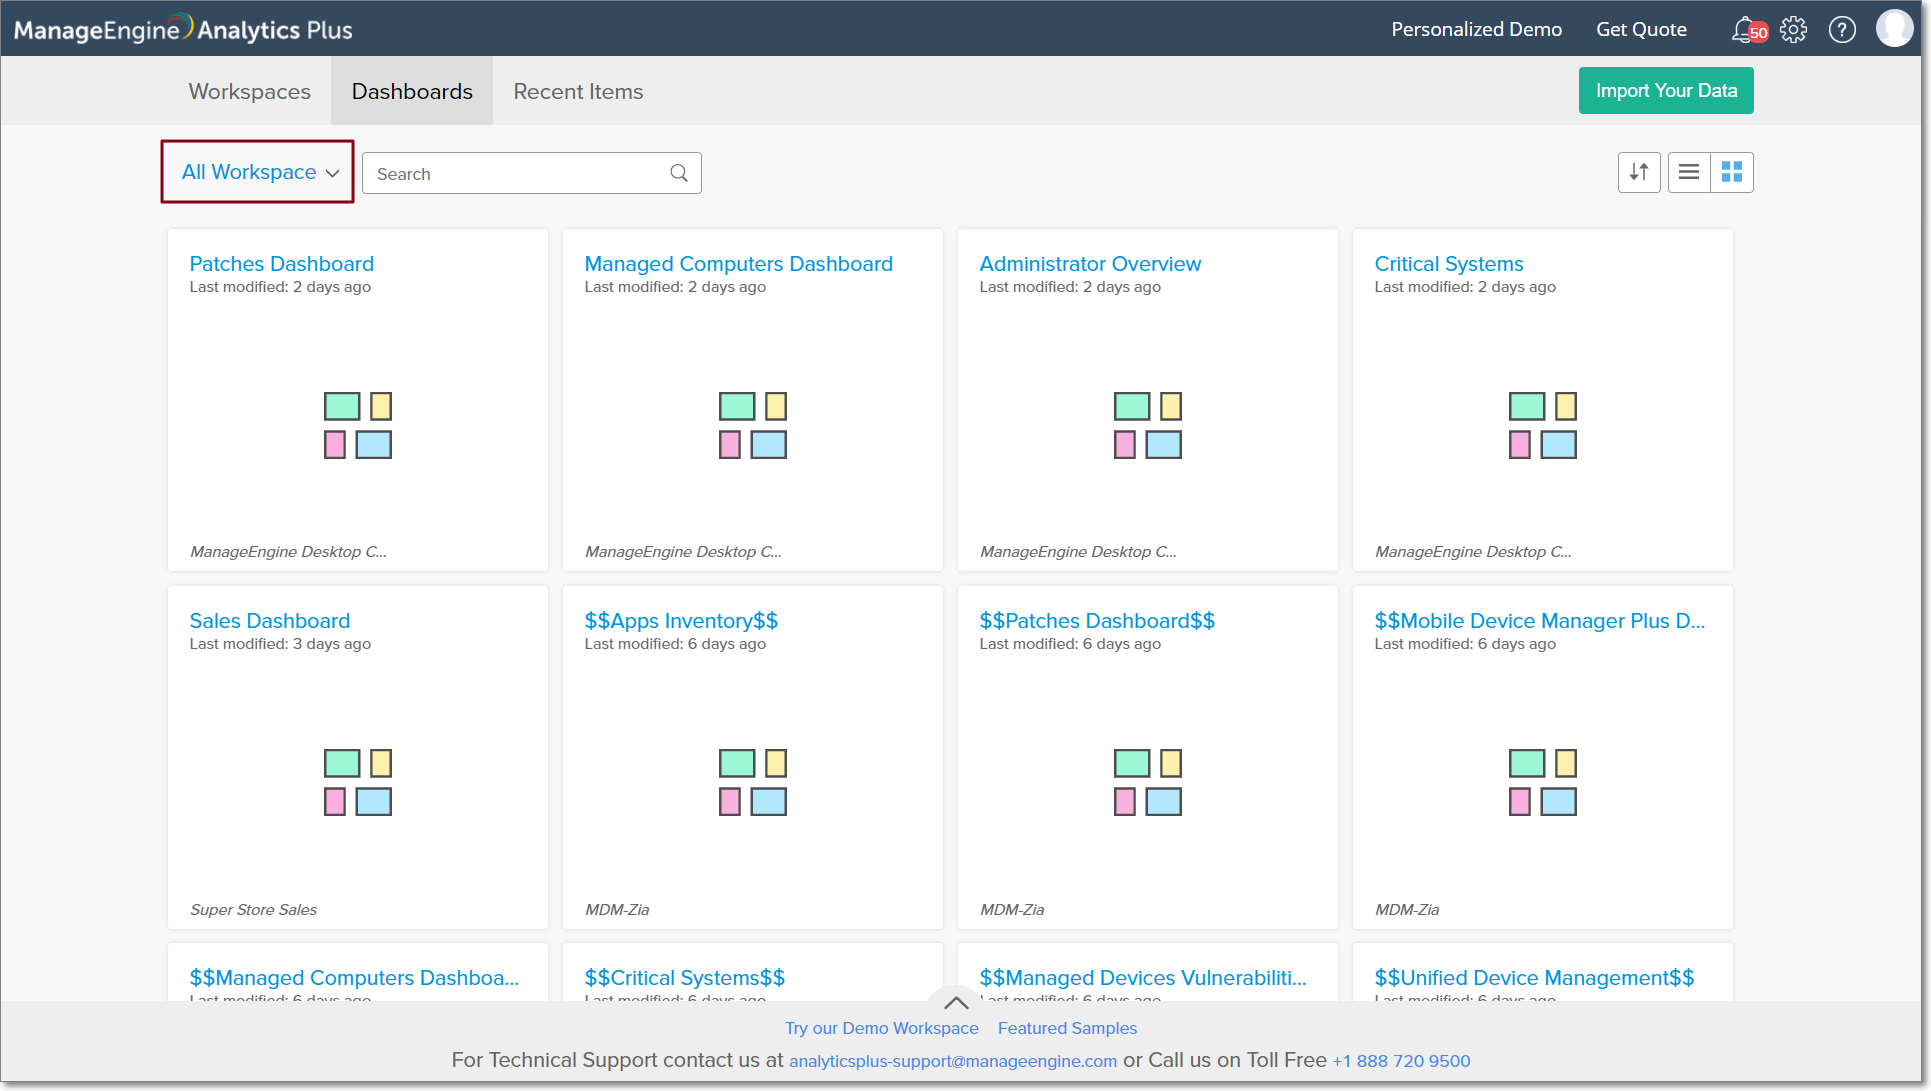
3. How do I access dashboards in Analytics Plus?
To view the dashboards that you have access to, navigate to the Dashboards tab in the Analytics Plus homepage. You can view the dashboards that you have created, or only the ones that have been shared to you, by navigating to the corresponding tabs. To list dashboards specific to individual workspaces, select the required workspace from the All Workspace drop down.
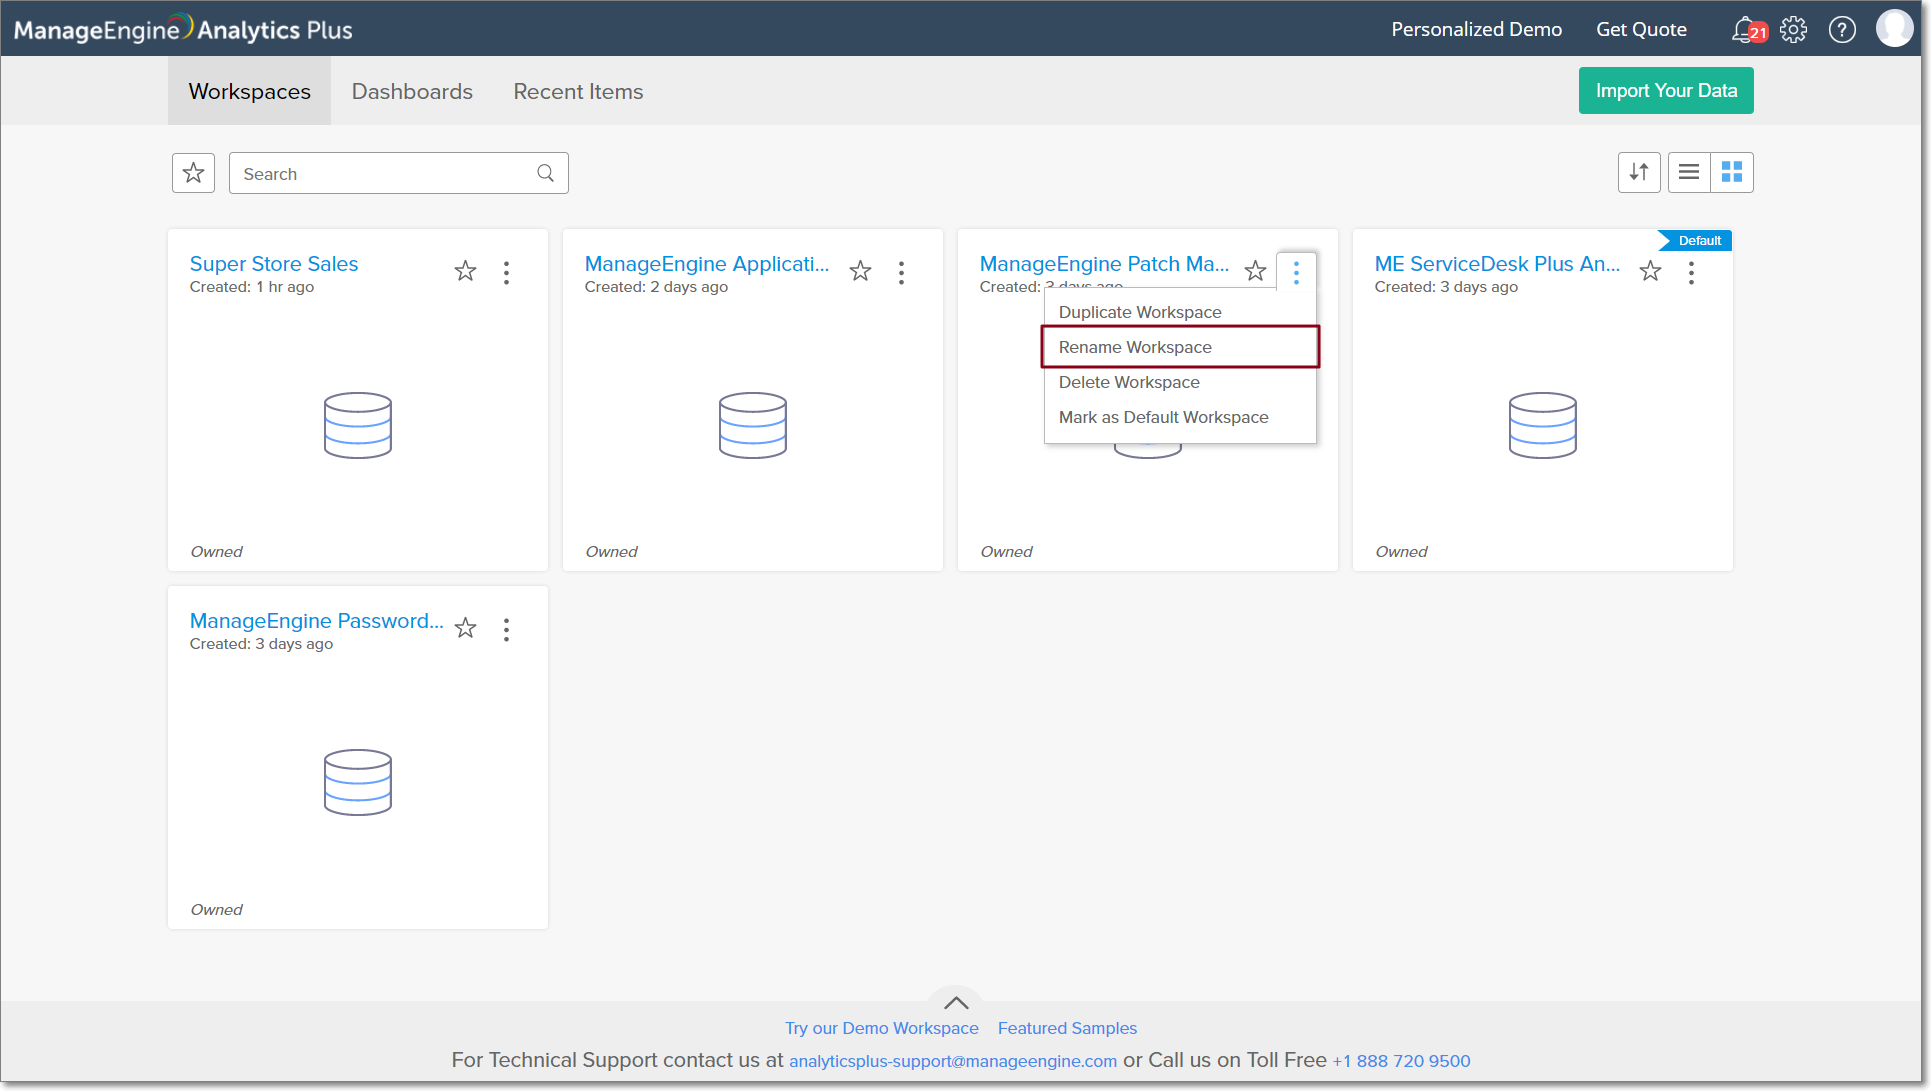
4. How do I rename a workspace?
Follow the steps below to rename a workspace in Analytics Plus.
- Navigate to the required workspace in the Analytics Plus homepage, and click the More Actions icon and select the Rename Workspace option.
- Modify the workspace name as needed, and click OK.
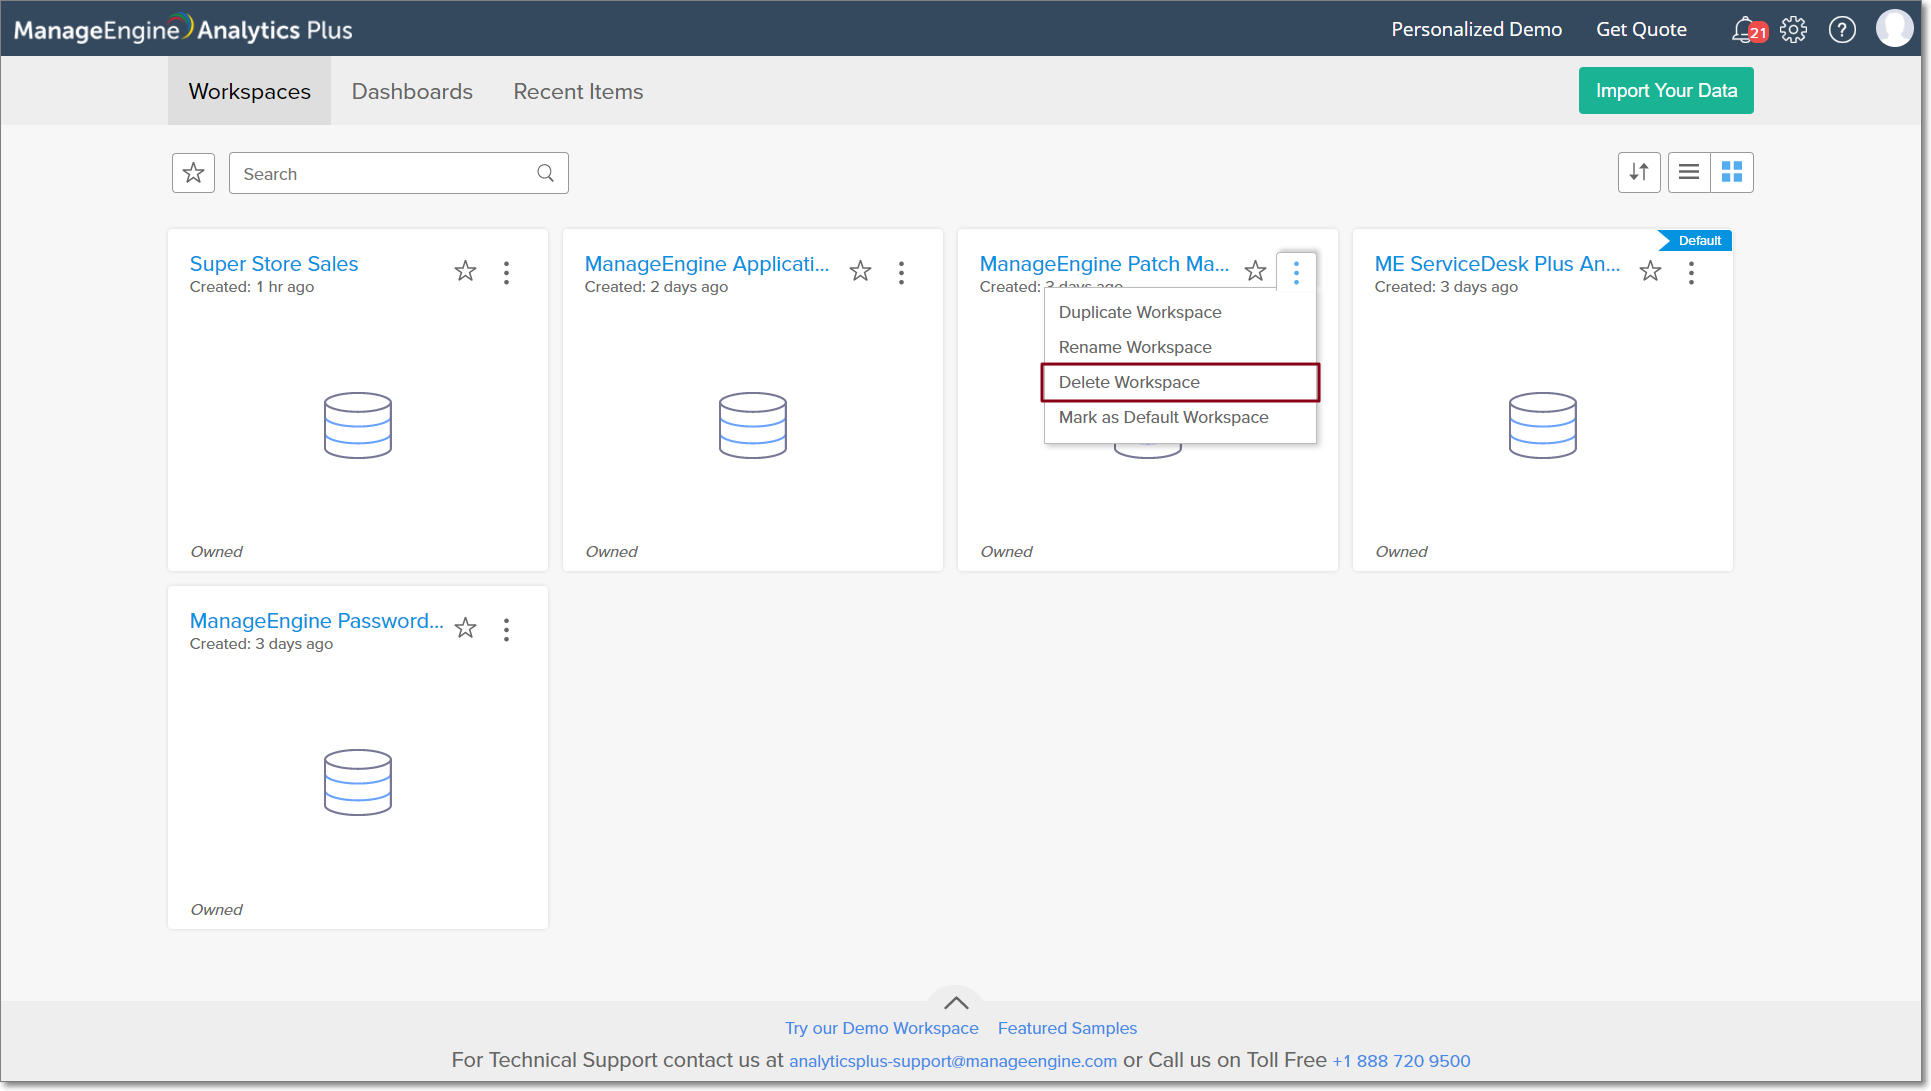
5. Can I delete a workspace in Analytics Plus?
To delete a workspace, navigate to the required workspace in the Analytics Plus homepage, and click the More Actions icon. Select the Delete Workspace option and confirm your action in the popup that appears.
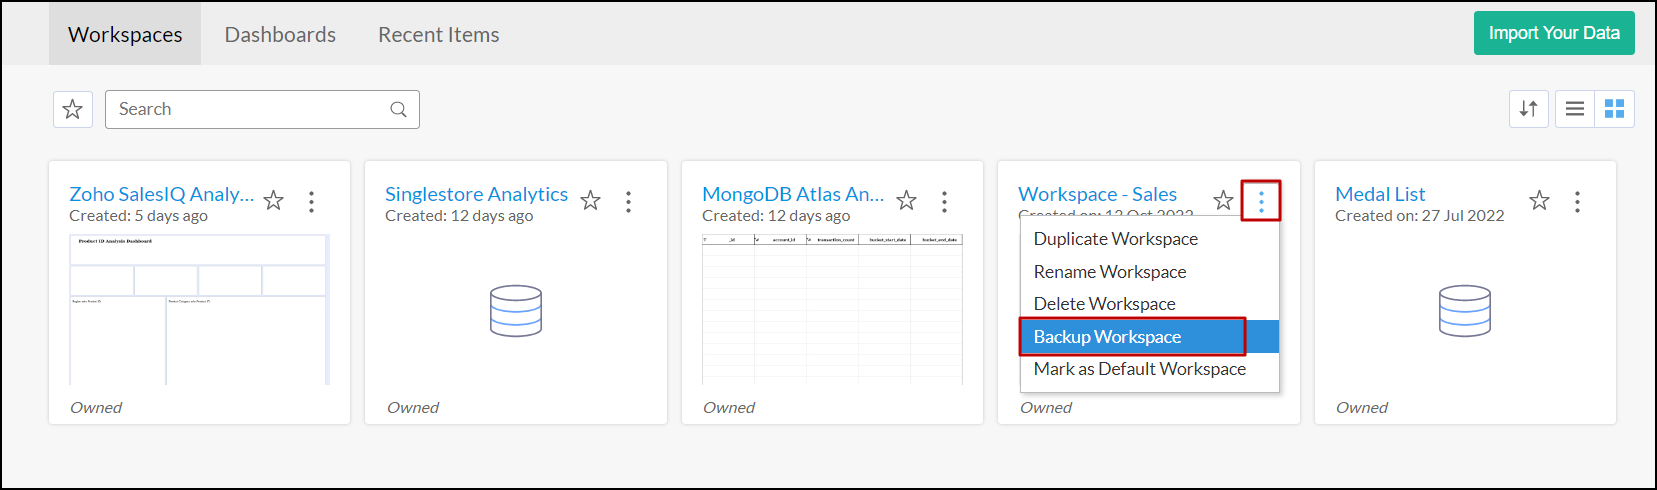
6. Can I take a backup of my Workspaces?
Yes. Analytics Plus allows you to backup your data in every workspace individually. This option backs up only the data from tables and query tables and makes it downloadable to have a local copy of your data (please note that the reports and dashboards cannot be backed up). To take a backup, follow the steps below.
From the Analytics Plus home page, click the More Actions icon of a workspace from which you need to take a backup, and click Backup Workspace.
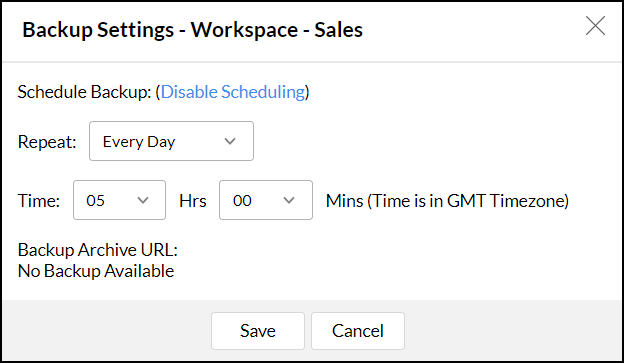
- In the pop-up that appears, choose one of the following options:
- Every Day: This option allows you to backup your data everyday at a specified time.
- Weekly Once: This option lets you backup your data every week at a specified day and time.
- Monthly Once: This option allows you to backup your data every month at a specified date and time.
Click Save to schedule the backup.
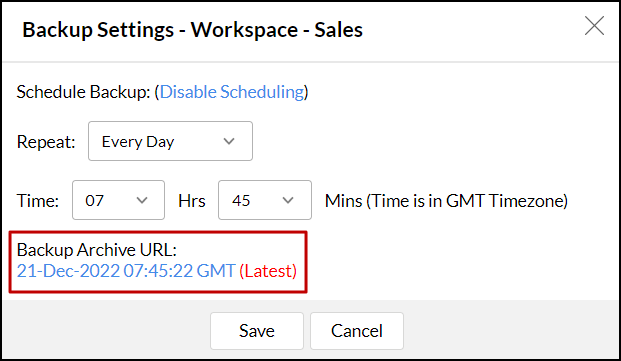
Once the data is backed up, you can download the file from the Analytics Plus home page. Click the More Actions icon of the workspace that is being backed up and choose Backup Workspace.
In the pop-up that appears, click the Date link in the Backup-Archive URL section. Analytics Plus allows you to download the last 3 versions of your data backup.
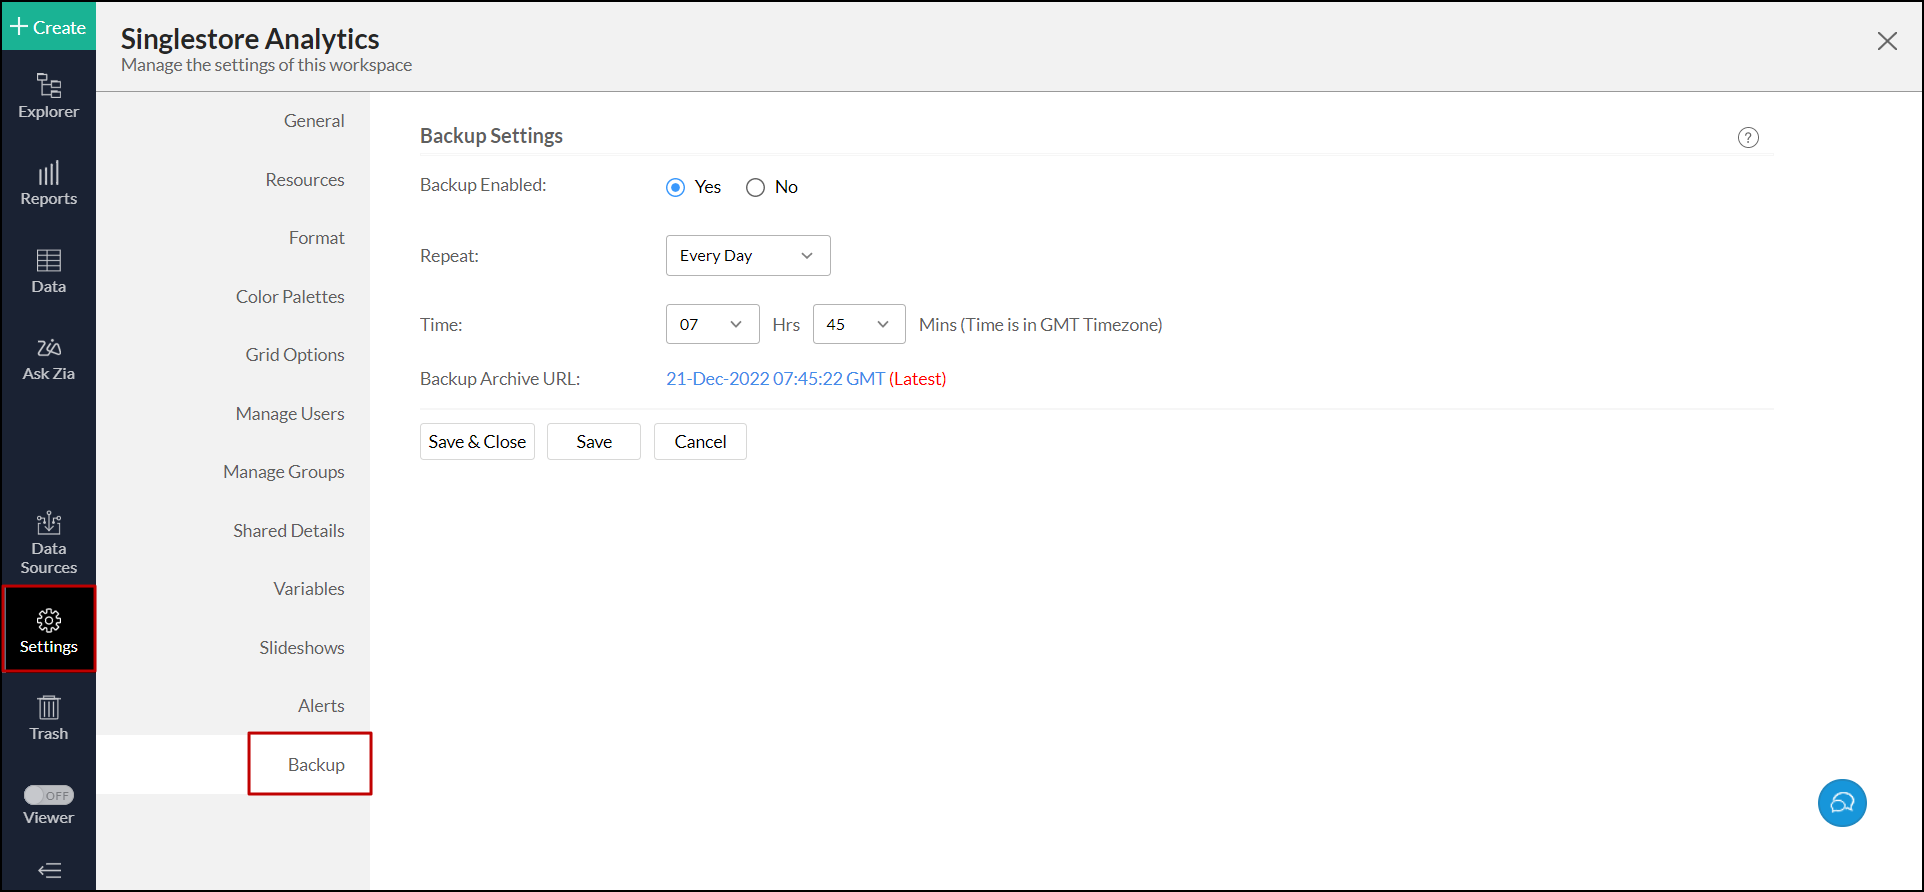
The workspace administrators can also take the data backup from the Backup tab on the Workspace Settings page.
The account administrators can also configure the data backup at the account level. Click here to learn more.
7. How do I copy a workspace?
Follow the steps below to copy a workspace in Analytics Plus.
- Navigate to the required workspace in the Analytics Plus homepage, and click the More Actions icon.
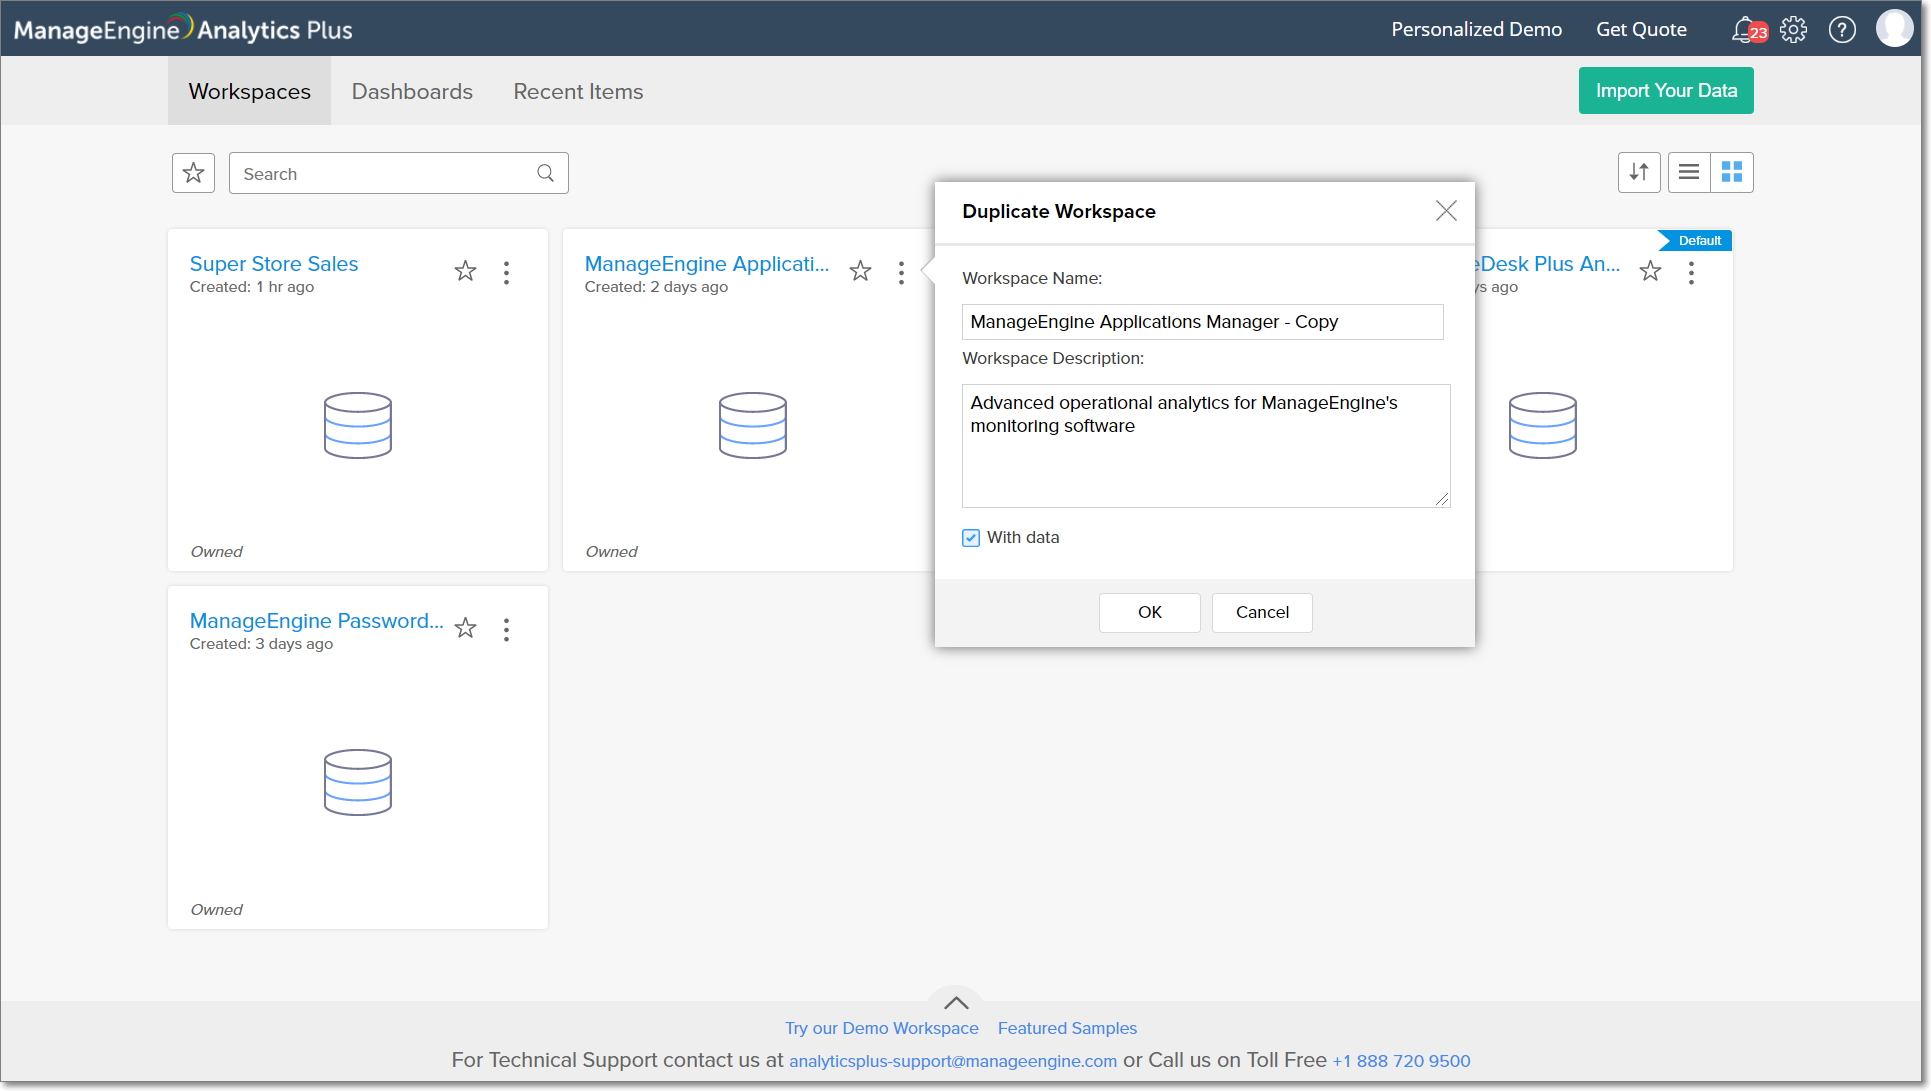
- Select the Duplicate Workspace option, provide a name and description for the duplicate workspace, select the With data checkbox, and click OK.
8. Is it possible to create a workspace that is similar to another workspace?
To create a workspace similar to another one in Analytics Plus,
- Navigate to the required workspace in the Analytics Plus homepage, and click the More Actions icon.
- Select the Duplicate Workspace option and provide a name and description for the duplicate workspace.
- Ensure the With data checkbox is not selected, and click OK.

A new workspace will be created, with the same report and data structure.
9. Can I bookmark a workspace as favorite?
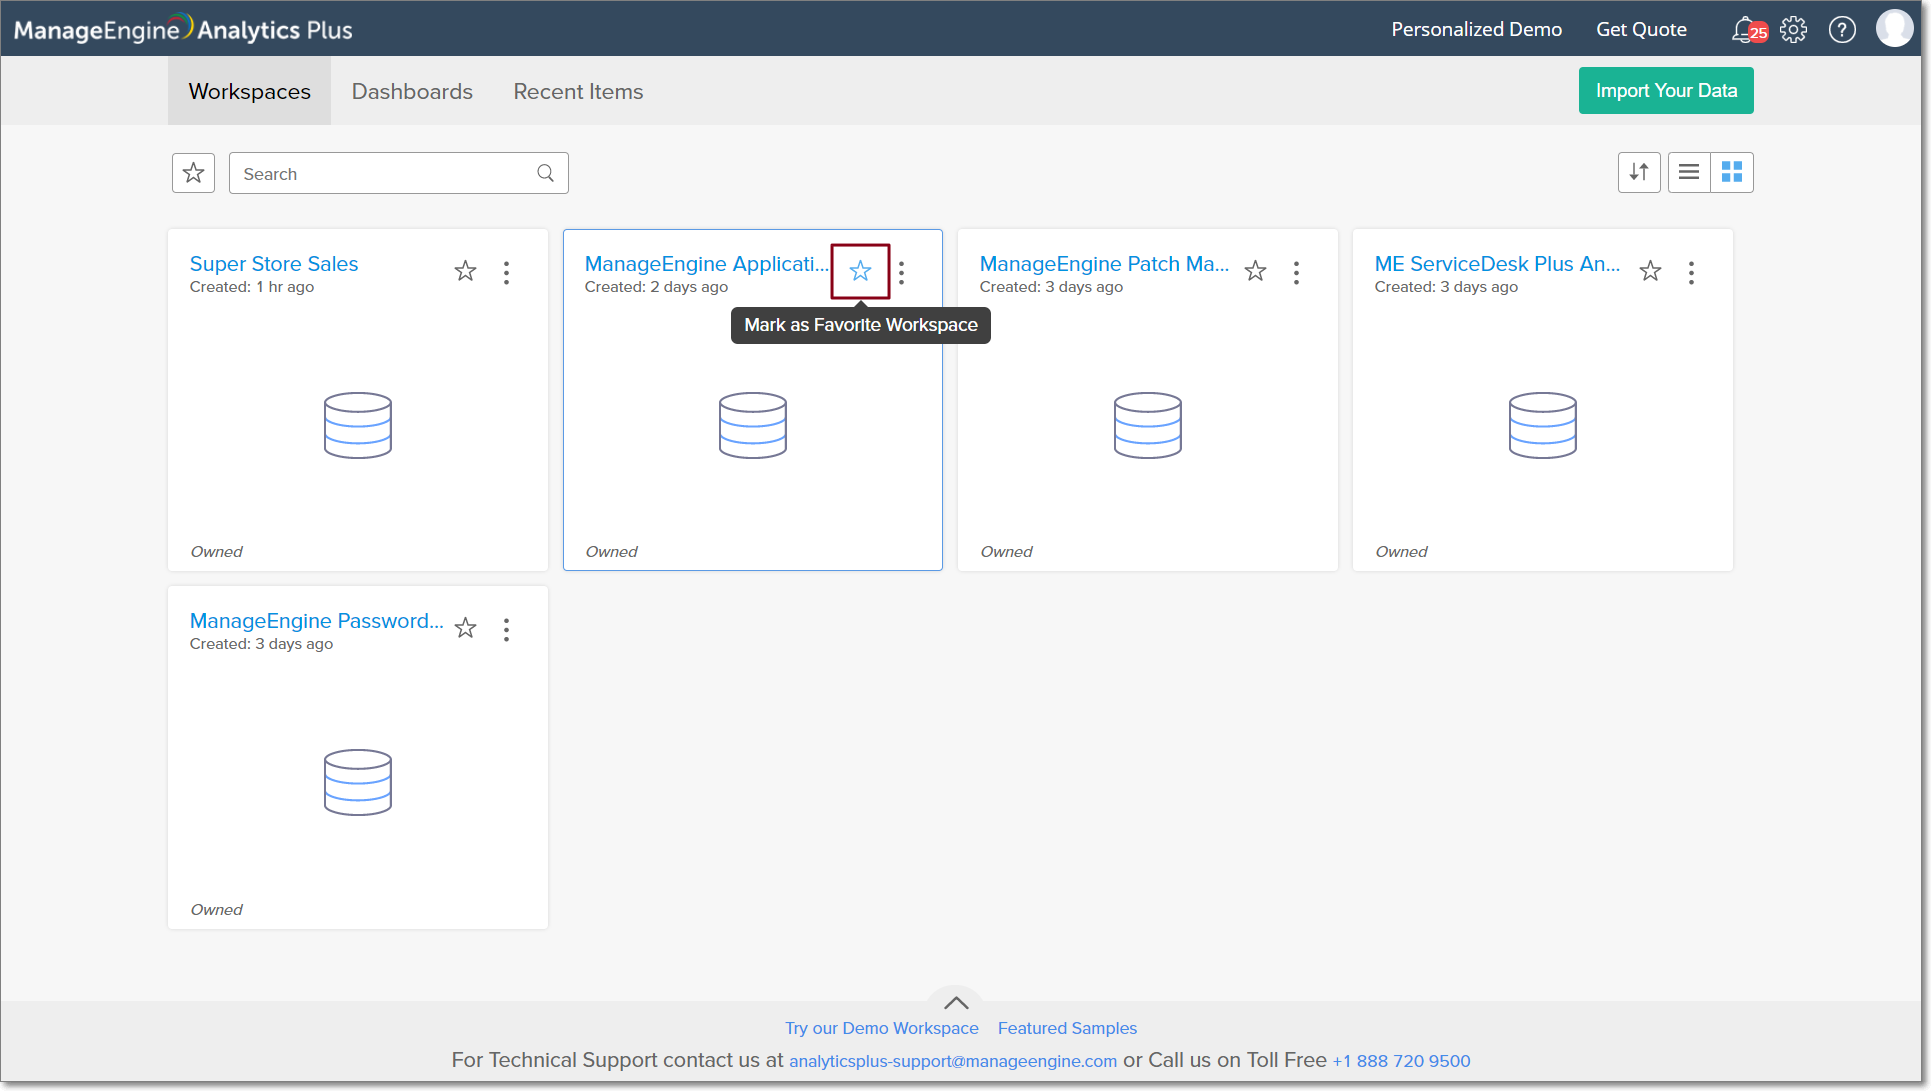
To bookmark frequently accessed workspaces, navigate to the required workspace in the Analytics Plus homepage and click the Star icon.
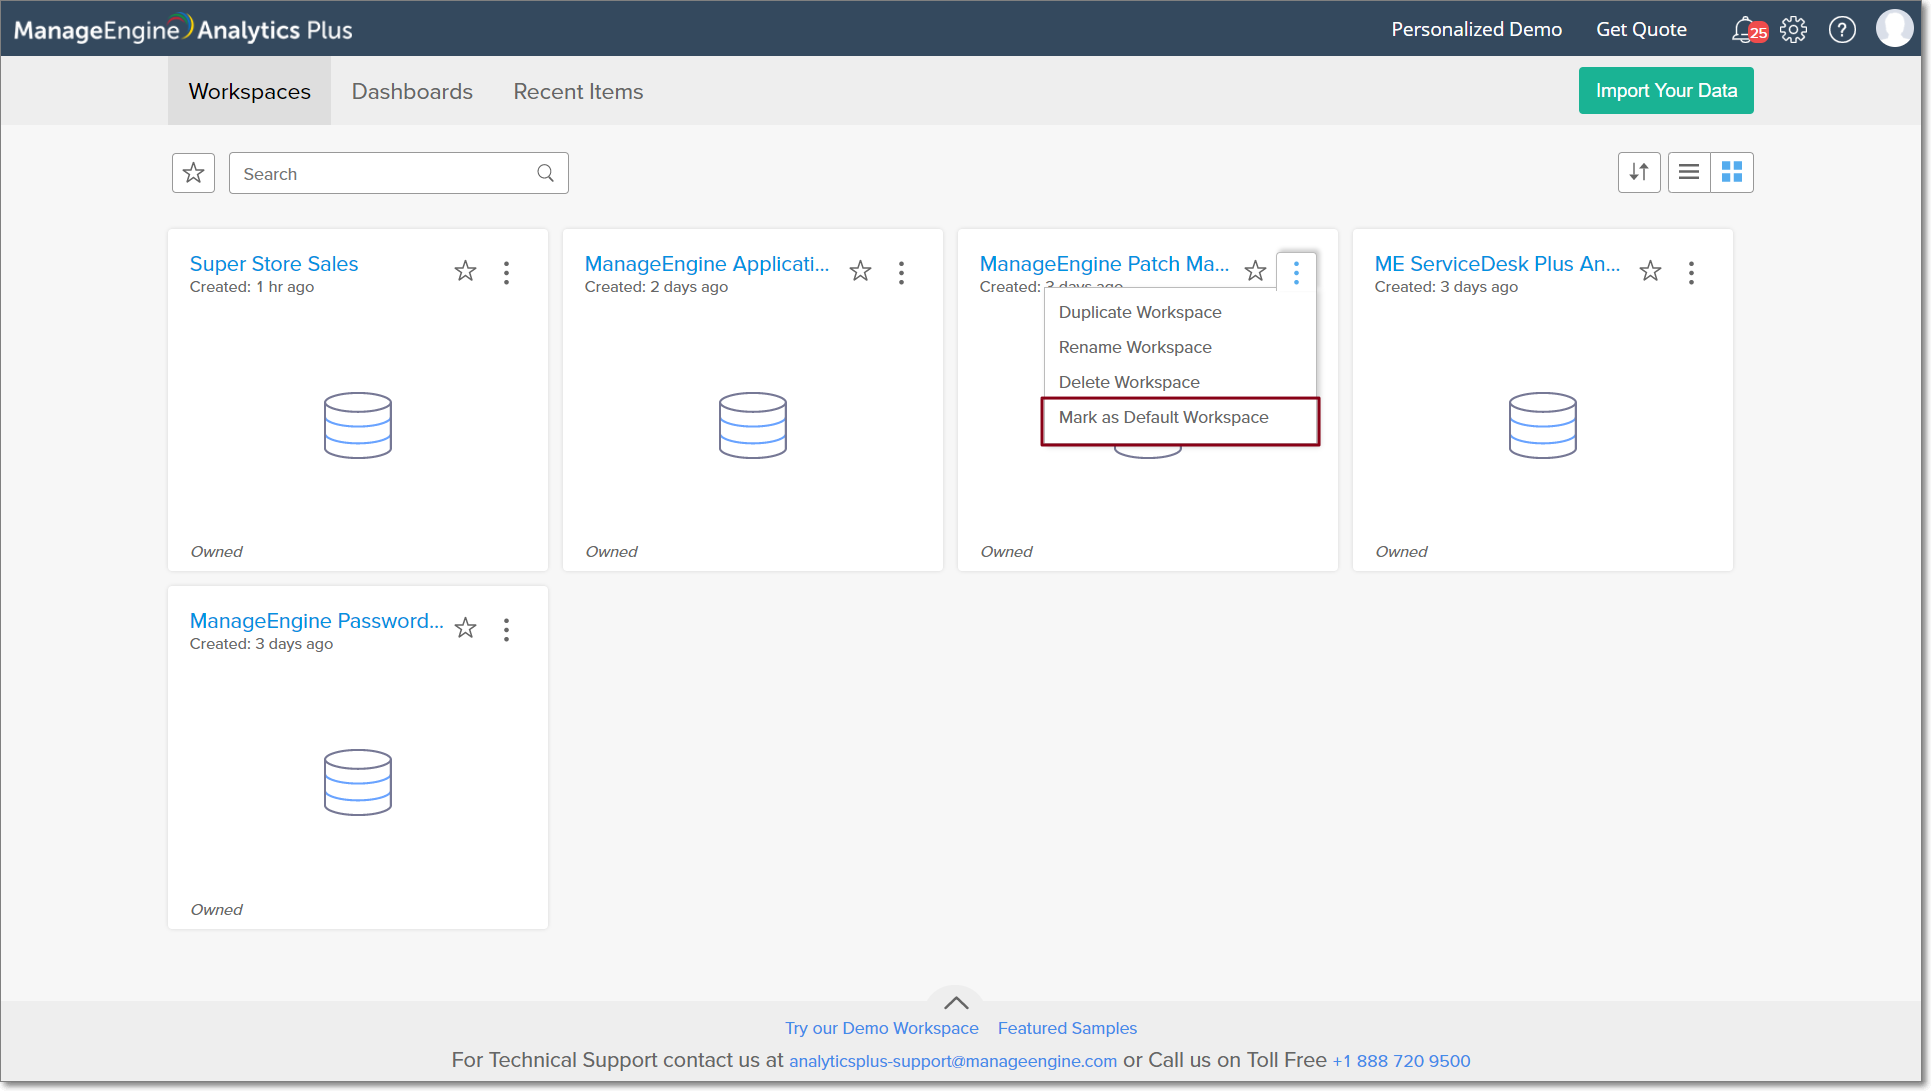
10. Is it possible to set a workspace as default?
Setting a default workspace ensures that the workspace will be opened when accessing Analytics Plus. Follow the steps below to set a workspace as default in Analytics Plus.
- Navigate to the required workspace in the Analytics Plus homepage, and click the More Actions icon.
- Select the Mark as Default Workspace option.
You can also set a workspace as default from the workspace Settings page. Click here to learn more.
11. Is it possible to access any sample workspaces in Analytics Plus?
Analytics Plus provides a set of featured sample workspaces, to facilitate a better understanding of the features offered. To access these workspaces, click the Featured Samples button at the bottom of the Analytics Plus homepage.
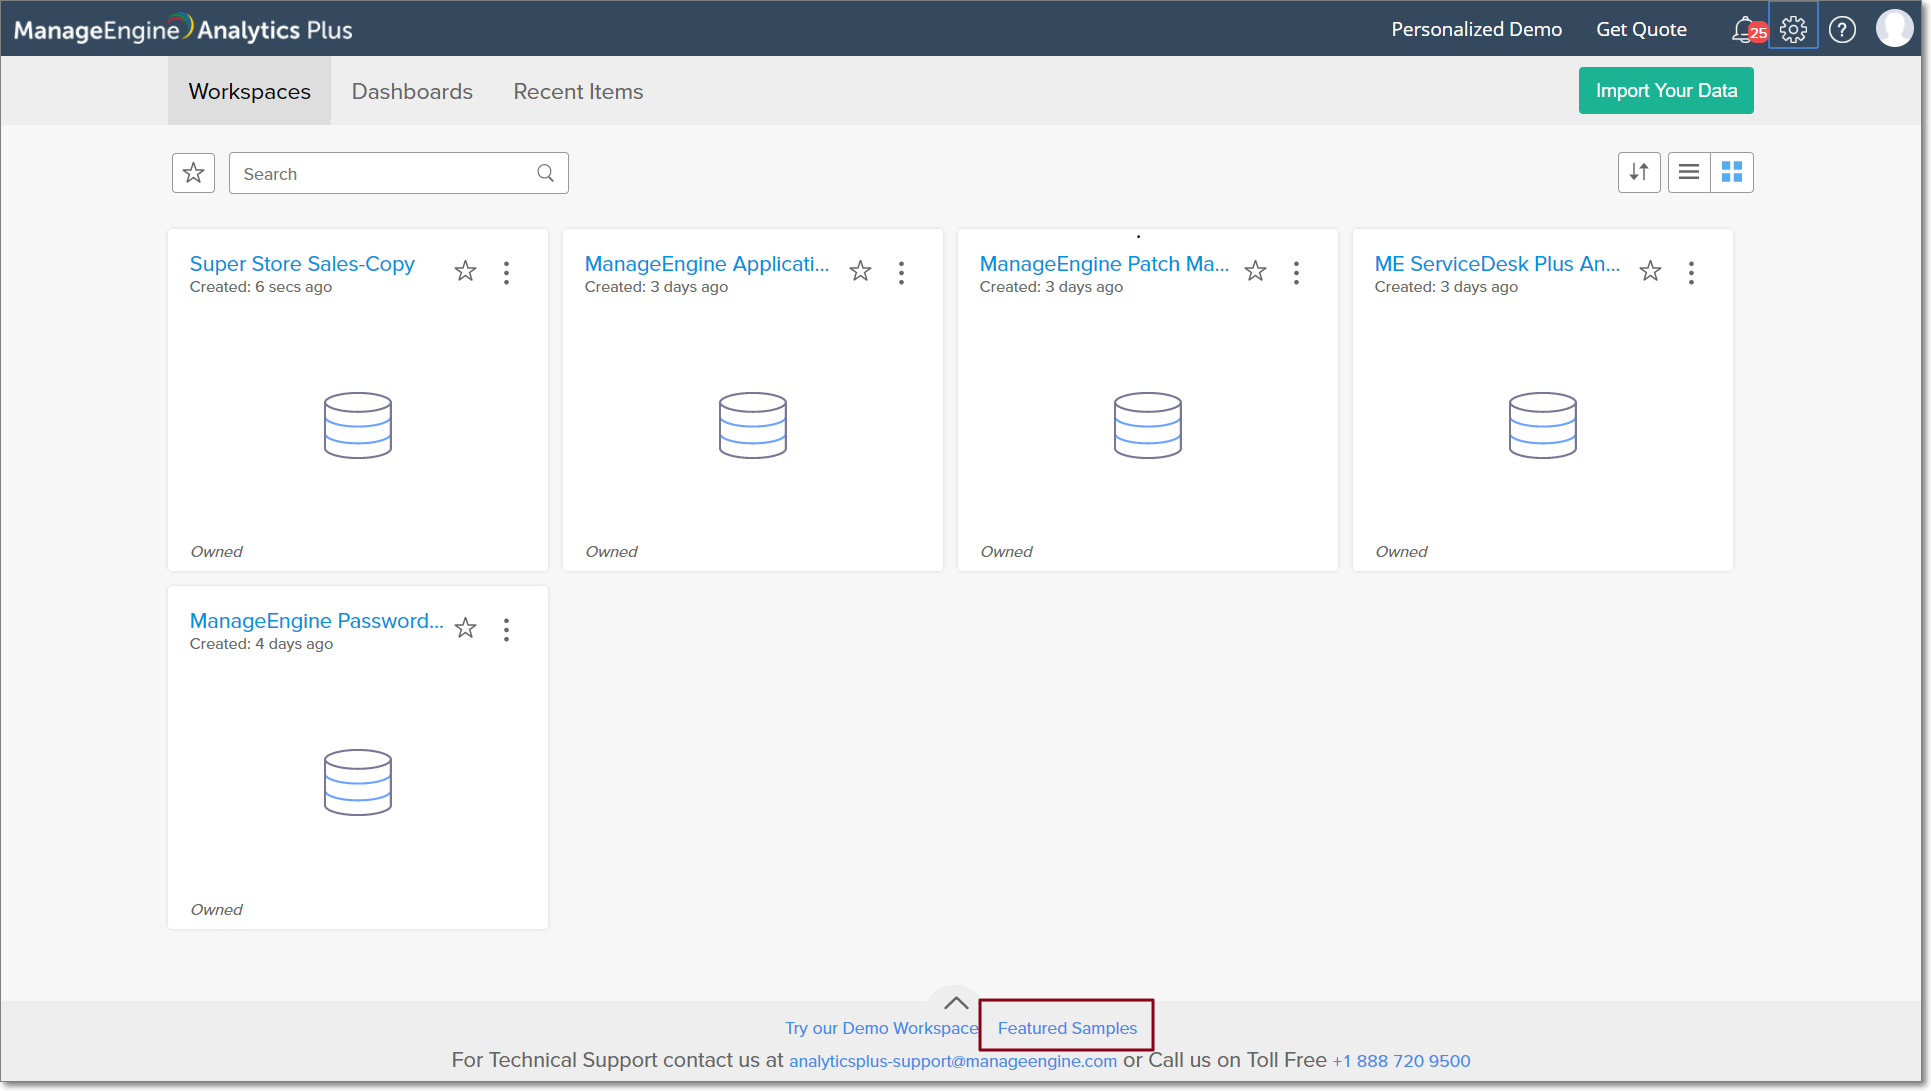
The Featured Samples Gallery appears, displaying a wide variety of sample workspaces. You can click on any of these workspaces, and copy them to your Analytics Plus setup.
12. Can I view the public workspaces shared by users?
Yes. Analytics Plus offers a Public Gallery to allow users to publish their workspaces. Any user can access the views shared in the public gallery based on the permissions configured for the workspace. To list a view in Analytics Plus gallery, the corresponding view should be made public on the web, and the List this workspace in Analytics Plus Public Workspaces option should be enabled. Click here to learn more on making views public and listing views in gallery.
Workspace Explorer
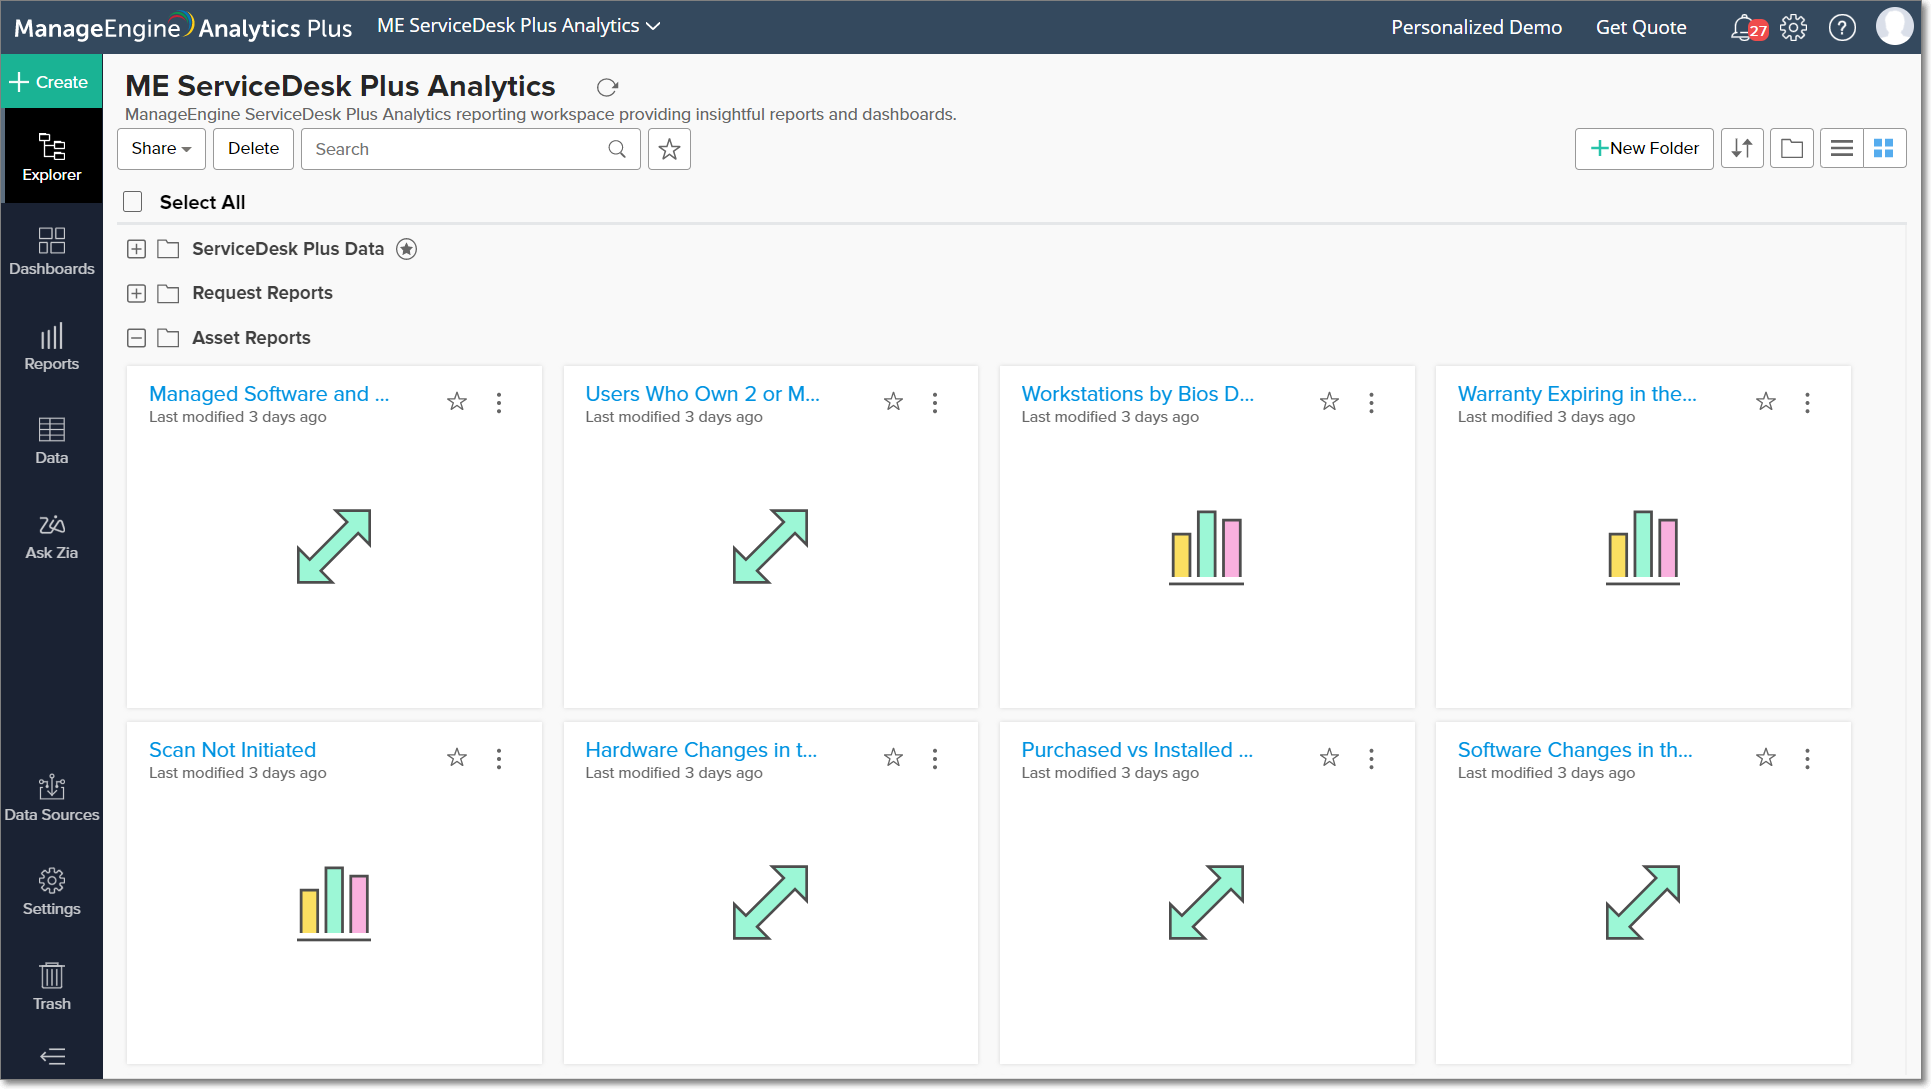
1. What is the Workspace Explorer?
The Explorer is the main page of the workspace from where you can create, access and share the views in your workspace. The following questions discuss the various operations that can be performed from the Explorer.
2. Is it possible to customize the way the tables, reports and dashboards are displayed in the Explorer?
You can easily modify the way tables, reports and dashboards are displayed in the Explorer page. You can customize the type of view, as well as the way they are grouped.
Analytics Plus allows you to display views in the Explorer in either of the following layouts.
- Grid view: This option displays the views in your workspaces as tiles.
- List view: This option displays the views as textual list, comprising of the title, description and the last modified date.
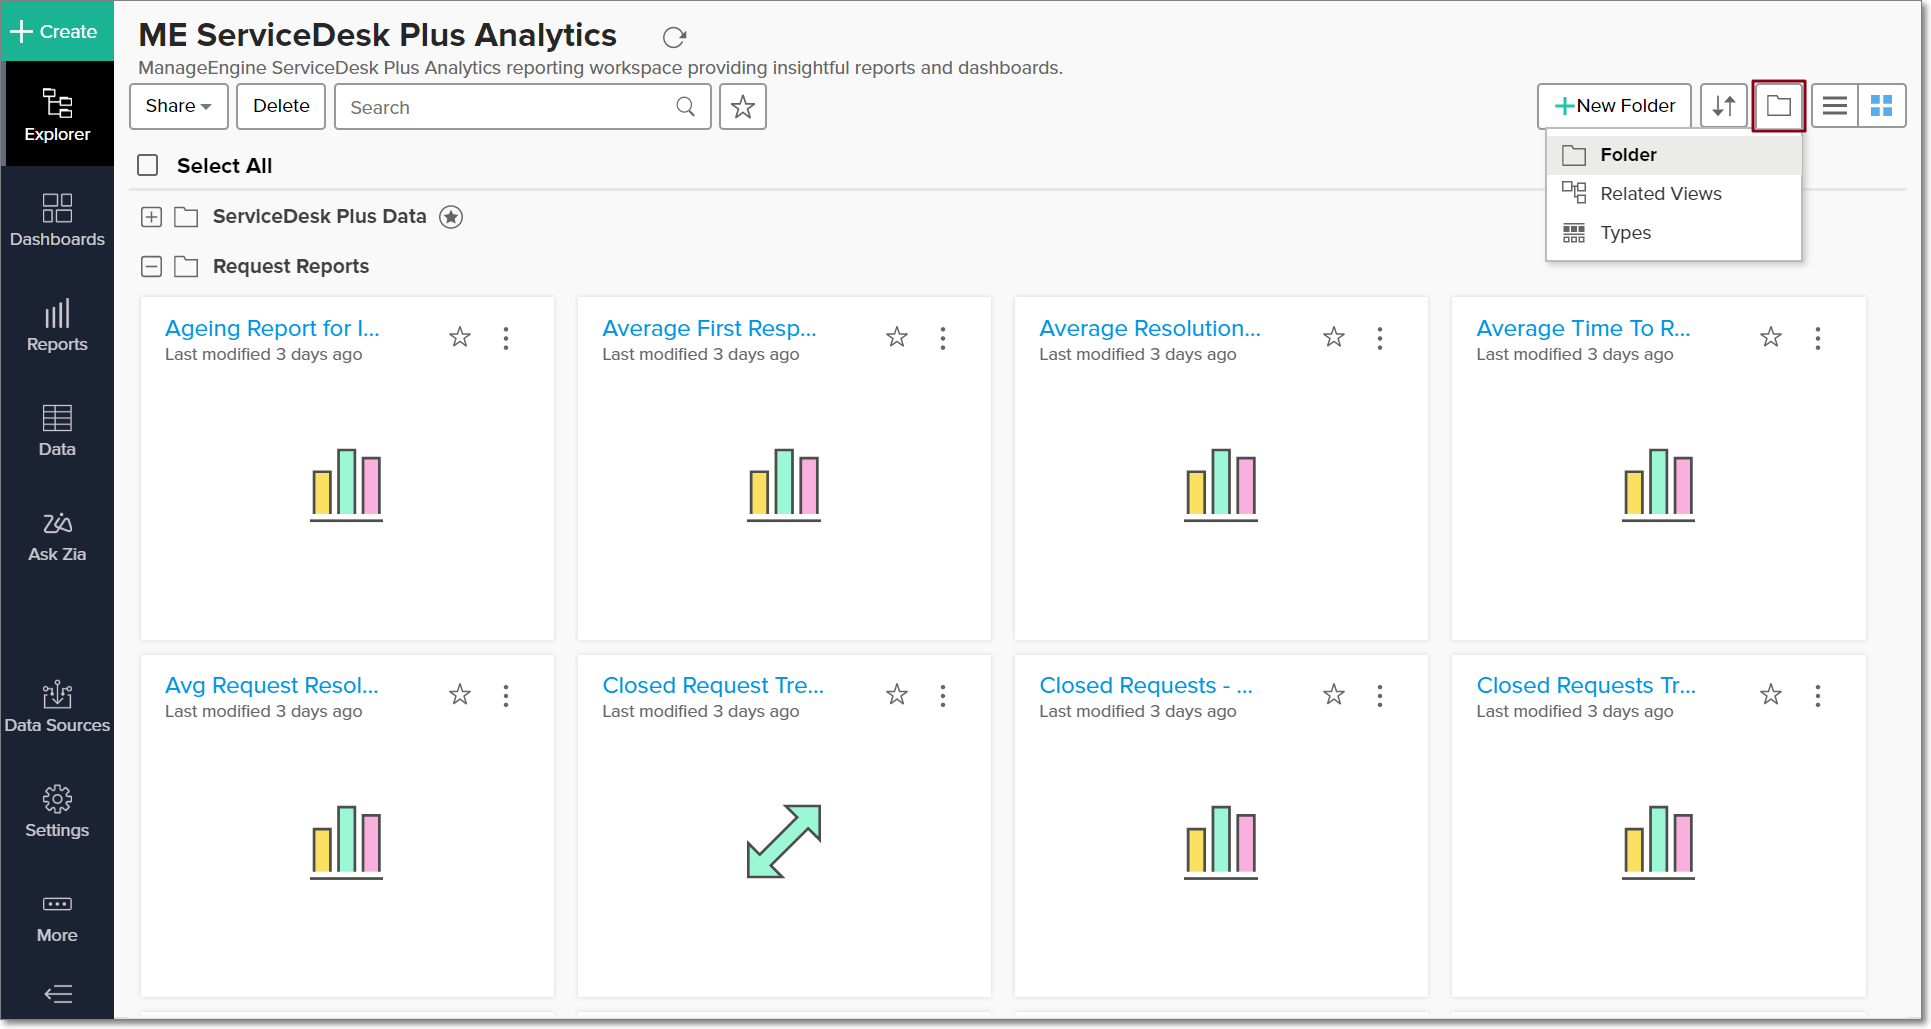
You can also modify the way the reports, dashboards and tables are grouped in the Explorer. The following options are available:
- Folder: The views will be organized according to the folders they are saved in.
- Related Views: Reports that are created over the same table will be grouped together.
- Types: The reports are organized based on the report type (Chart, Pivot, etc.).
3. Is it possible to organize the way views are grouped in the side panel?
Similar to organizing the way reports, dashboards and tables are grouped in the Explorer, you can also customize the report, dashboard and table listing style under the Reports, Dashboards and Data options in the side panel.
The following options are available:
- Folder: The views will be organized according to the folders they are saved in.
- Related Views: Reports that are created over the same table will be grouped together. This is applicable only to the Reports tile in the side panel.
- Types: The reports are organized based on the report type (Chart, Pivot, etc.).
This customization will be applied across all your workspaces, and will also be reflected in the way search results are listed in the side panel.
4. What is Viewer Mode?
Viewer mode in Analytics Plus offers a way to visualize the explorer and views from in read-only mode. When this mode is ON, the user is presented with a cleaner and lighter user interface optimized for viewing and interacting with the reports and dashboards.
Click the Viewer toggle button located at the bottom of the left pane to enable viewer mode.
The account and organization administrator can enable or disable the Viewer mode option for an organization. Click here to learn more.
5. Can I create folders and sub-folders in a workspace?
Yes, you can. Follow the steps below to do this.
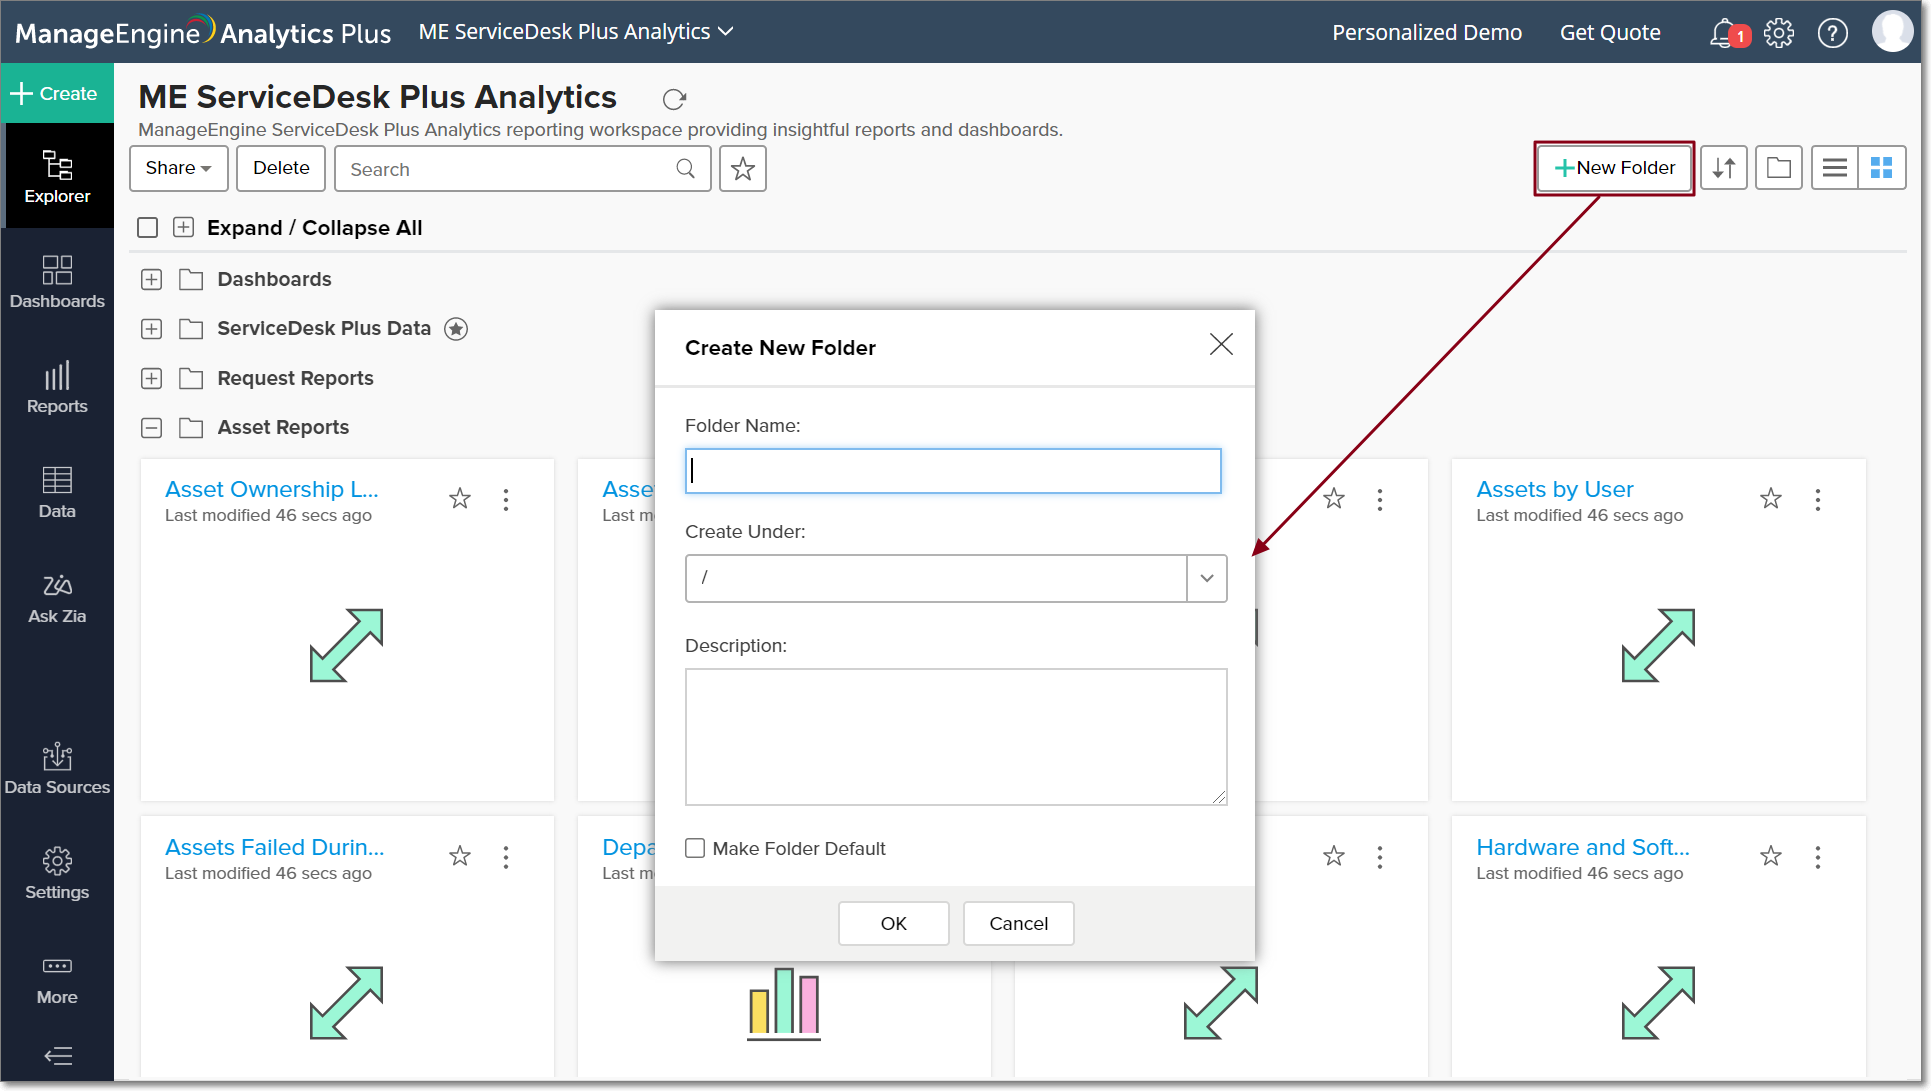
- Navigate to the Explorer page and click the +New Folder button in the top right corner.
Note: Ensure the views are organized by folders to view this button. To do this, click the View by button and select the Folder option. Click here to learn more about organizing views in your Explorer.
- In the Create New Folder popup that appears, provide a name and description for the folder. To create a sub-folder, select the folder under which you want to create the sub-folder from the Create Under drop down. Else, select the / option from the Create Under drop down.
- Select the Make Folder Default checkbox to set this as the default folder in the workspace, and click OK.
6. Is it possible to move the sub-folder of one folder to another within a workspace?
Yes, you can. Follow the steps below to do this.
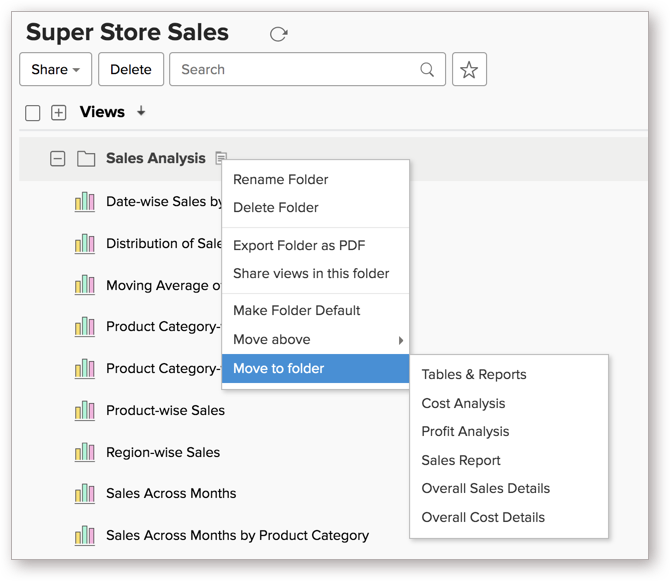
- Navigate to the Explorer page and right-click the required sub-folder.
- Select the Move to option and choose the required folder from the options listed.
7. Can I make parent folders as sub-folders within another folder?
Yes. Follow the steps below to do this.
- Navigate to the Explorer page and right-click the required parent or sub-folder.
- Select the Move to option and choose the required folder from the options listed.
8. Is it possible to turn a sub-folder into a parent folder?
Yes. Follow the steps below to do this.
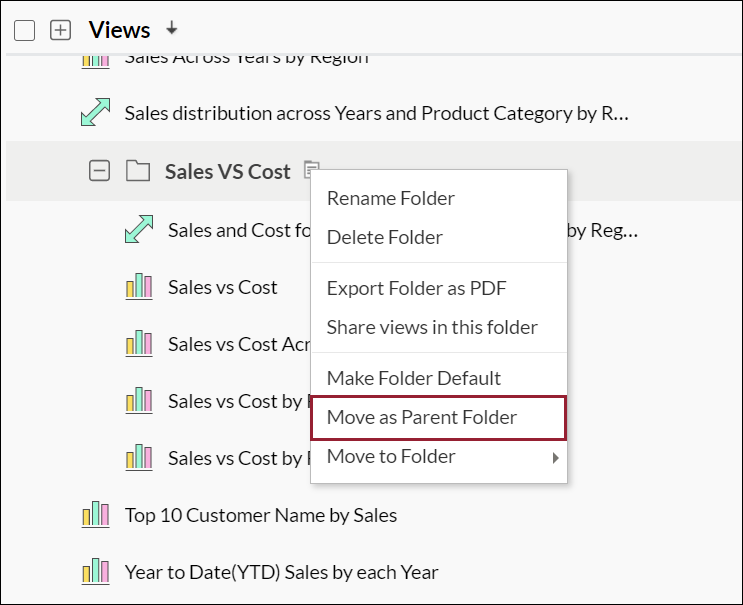
- Navigate to the Explorer page and click the Actions icon that appears on mouse over the required sub-folder.
- Select the Move as Parent Folder option.
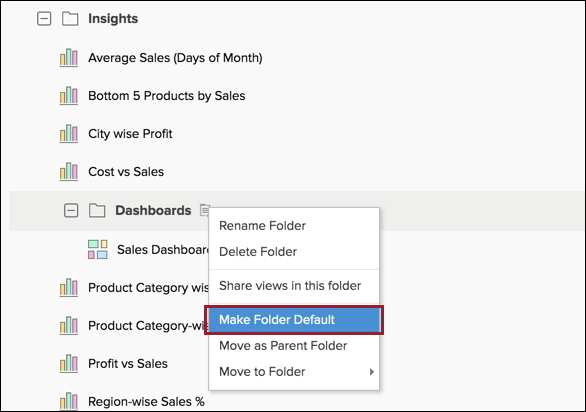
9. Is it possible to mark a sub-folder as a default folder?
Yes. Follow the steps below to do this:
- Navigate to the Explorer page and click the Actions icon that appears on mouse over the required sub-folder.
- Select the Make Folder Default option.
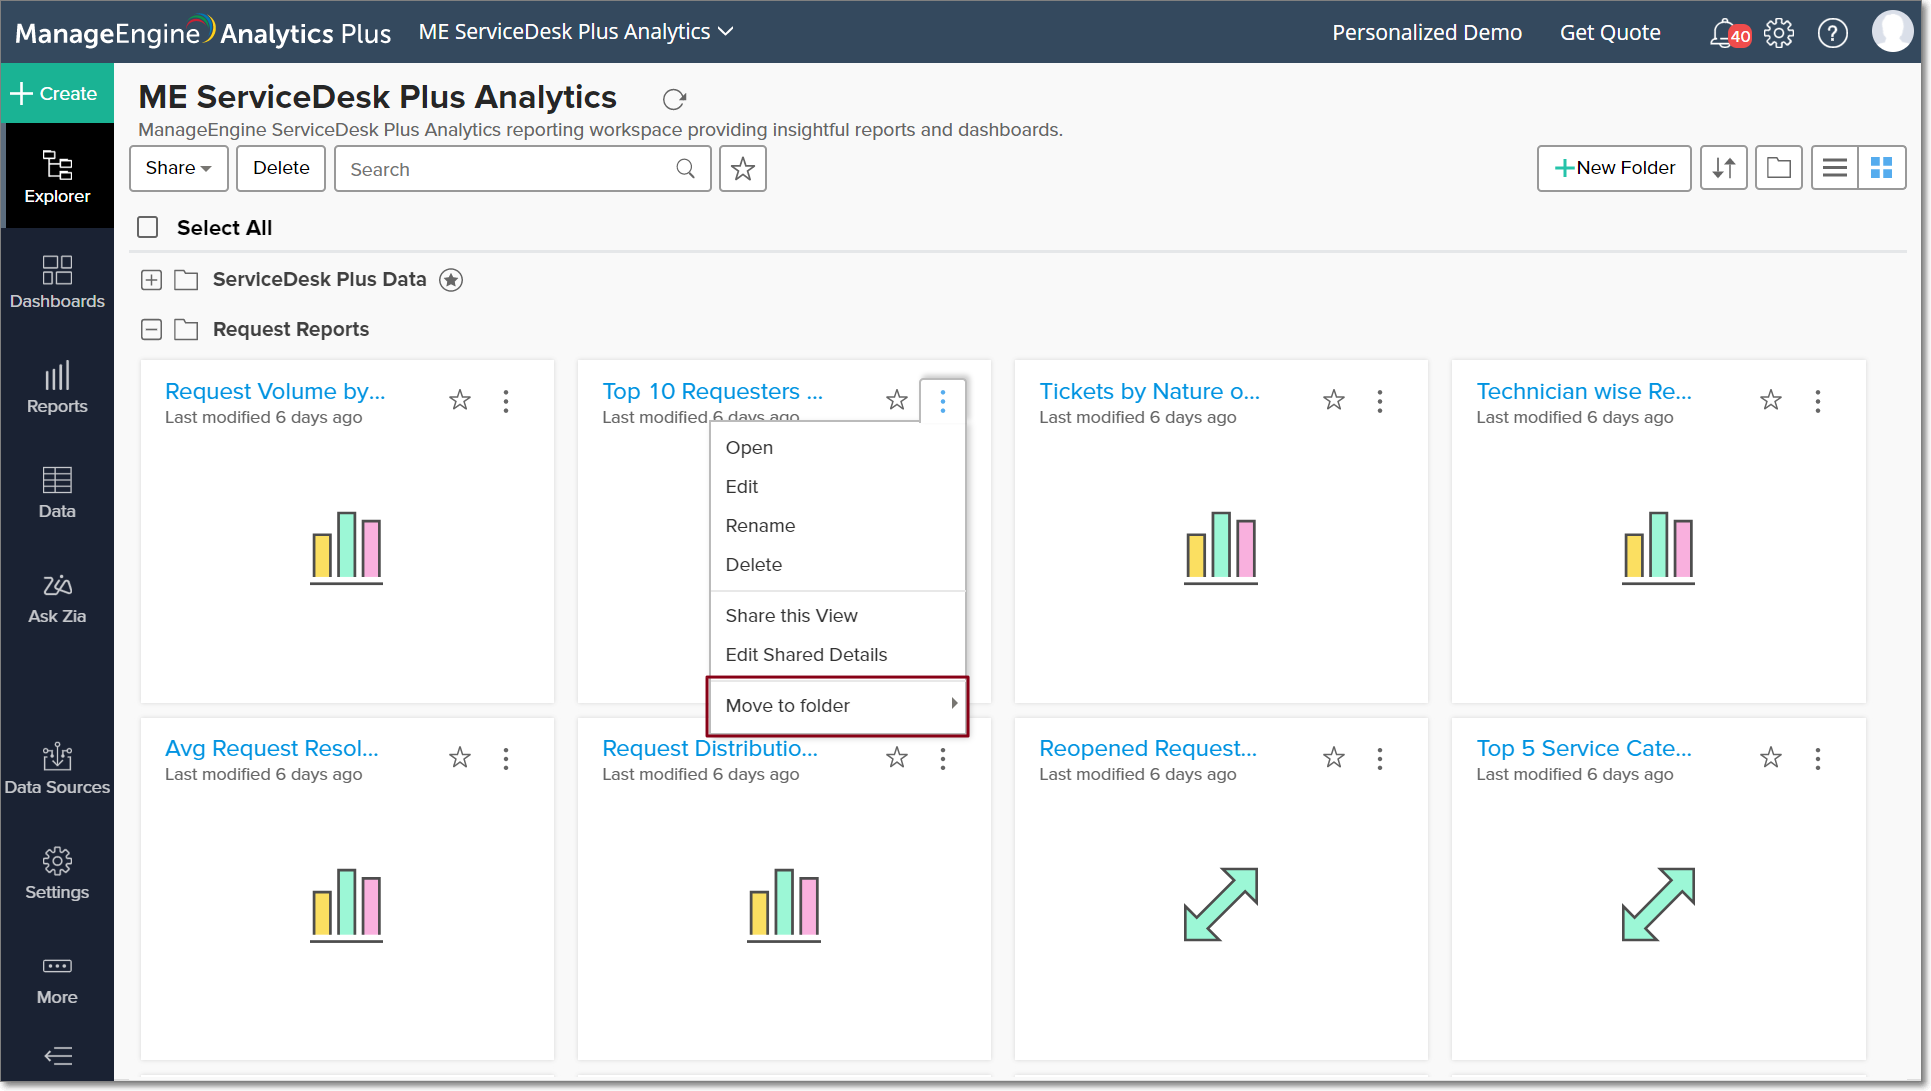
10. Is it possible to move views from one folder to another within a workspace?
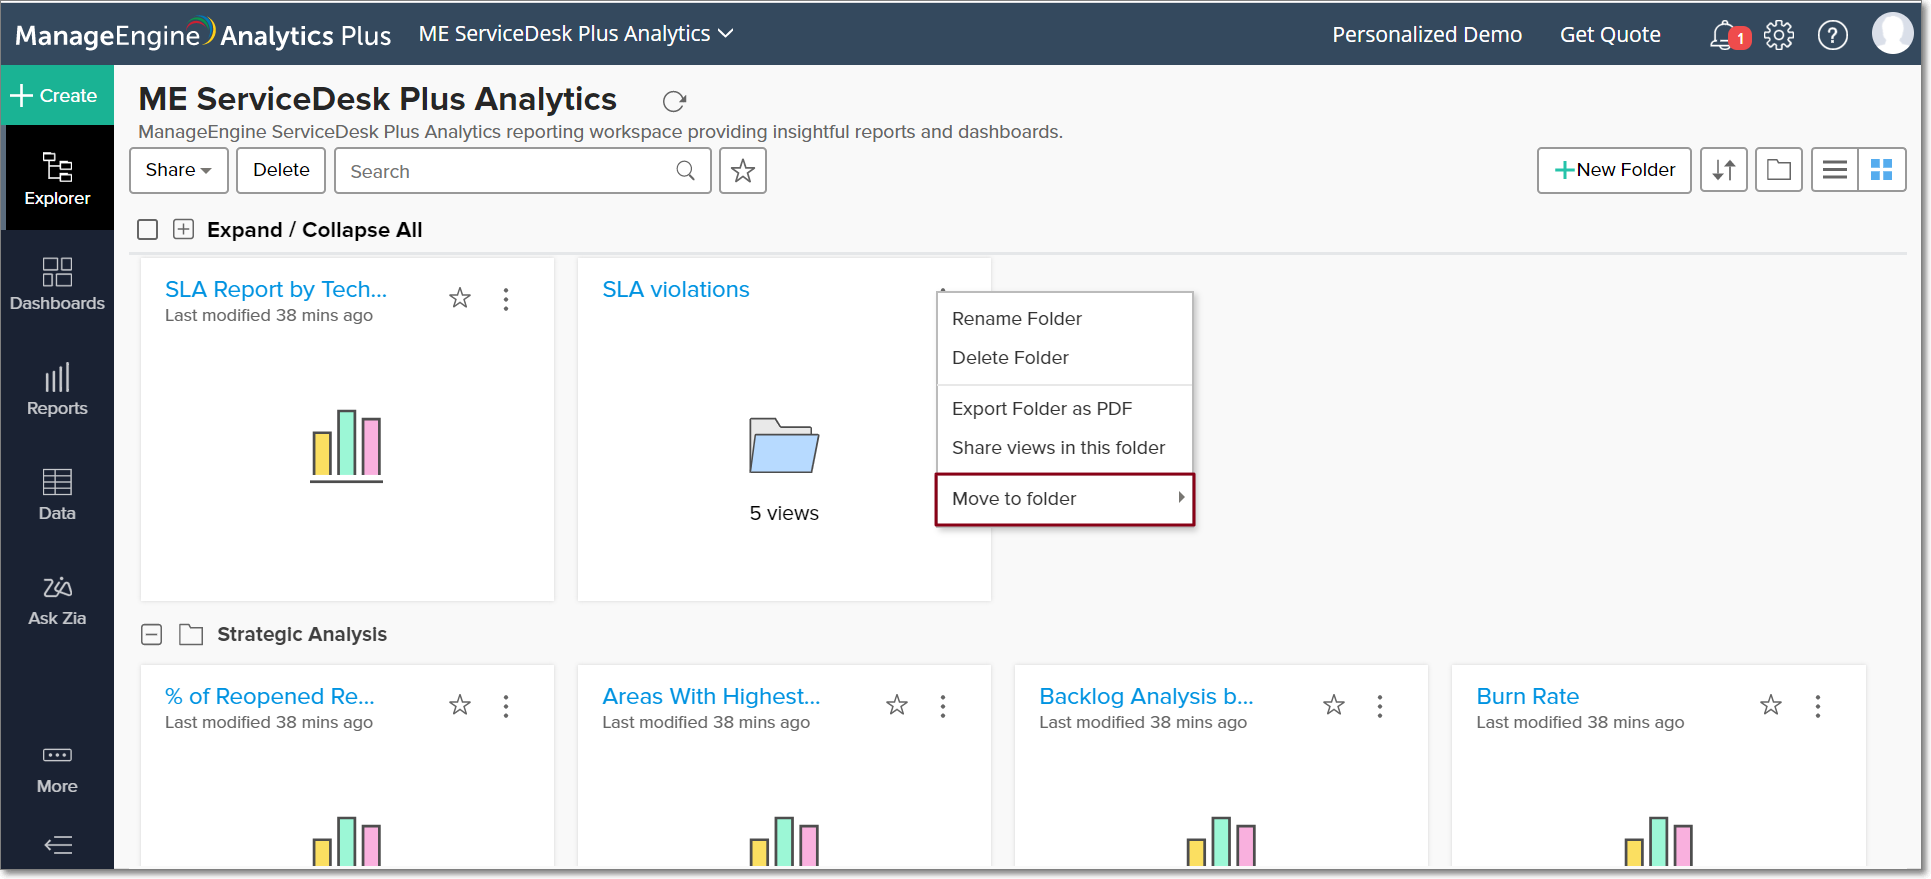
You can easily move reports, dashboards or tables from one folder to another within a workspace in Analytics Plus. Follow the steps below to do this.
- If the views in the Explorer page are displayed as grids, click the More Actions icon on the top right corner of the required report, dashboard or table. If the views are displayed in a list, click the Actions icon that appears near the report, dashboard or table name on mouse over.
- Select the Move to folder option and choose the required folder from the options listed.
The selected report, dashboard or table will be moved to the chosen folder.
11. Is there an easy way to search for views in the workspace?
Analytics Plus provides a powerful search engine on the Explorer page, which enables you to find a specific view within seconds. To do this, type in the name of the report, dashboard, or table in the Search bar at the top of the Explorer page.
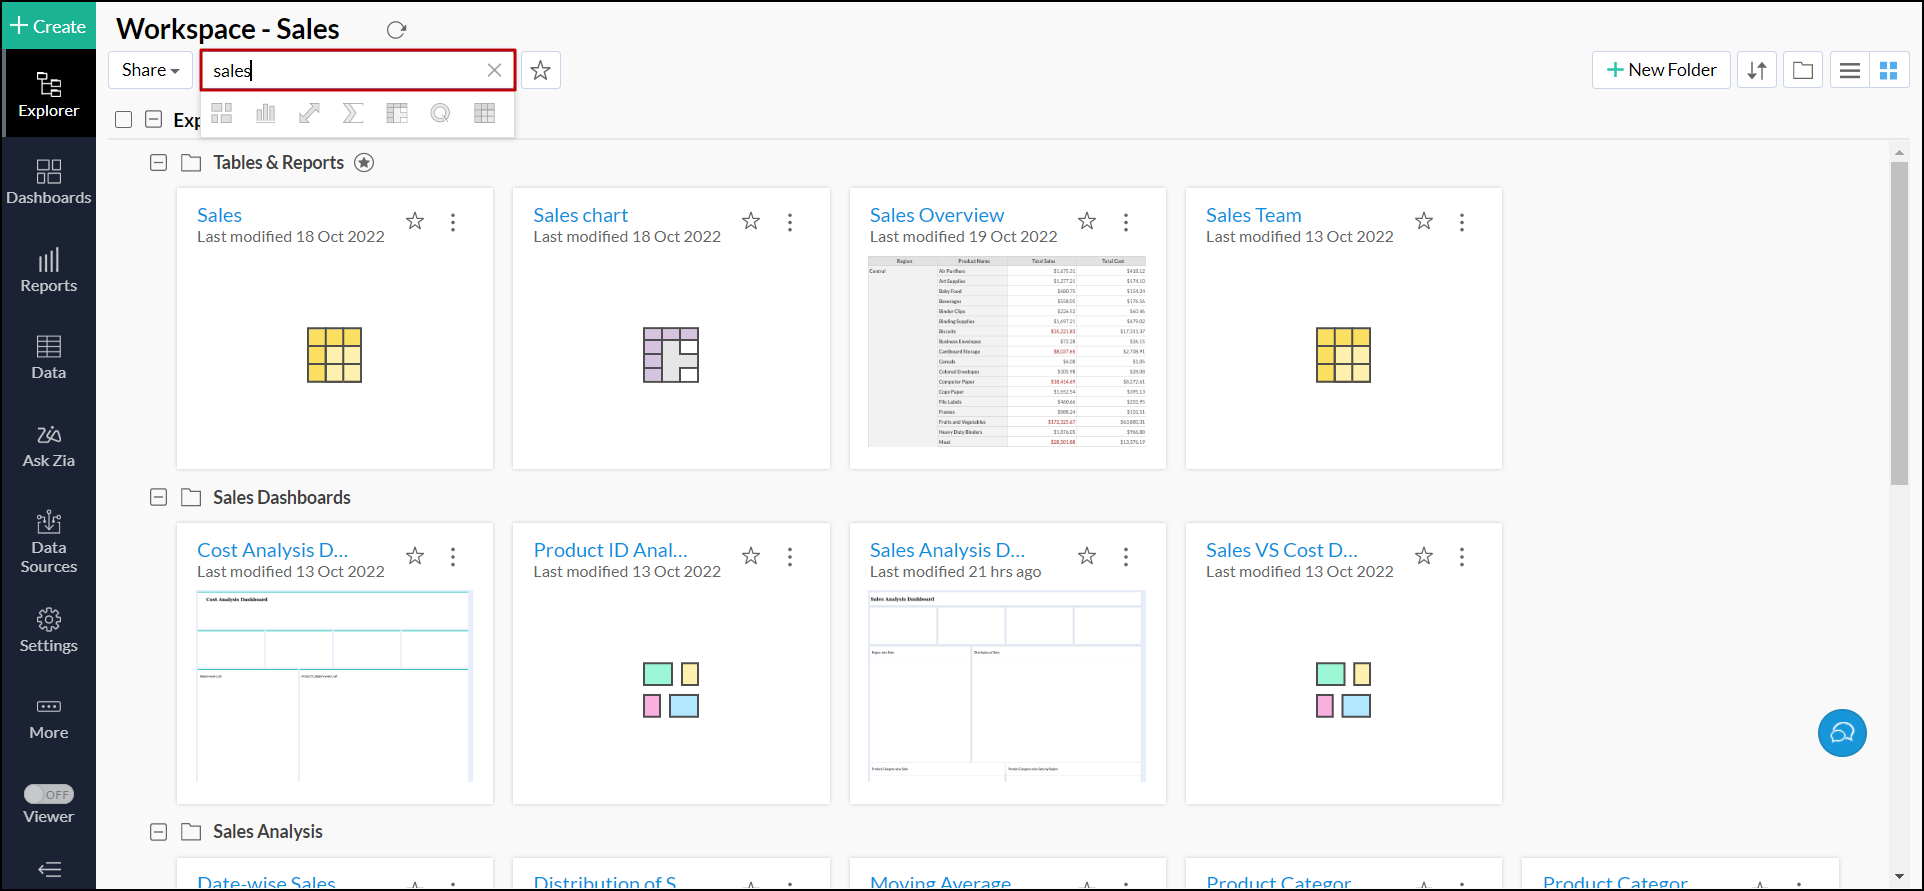
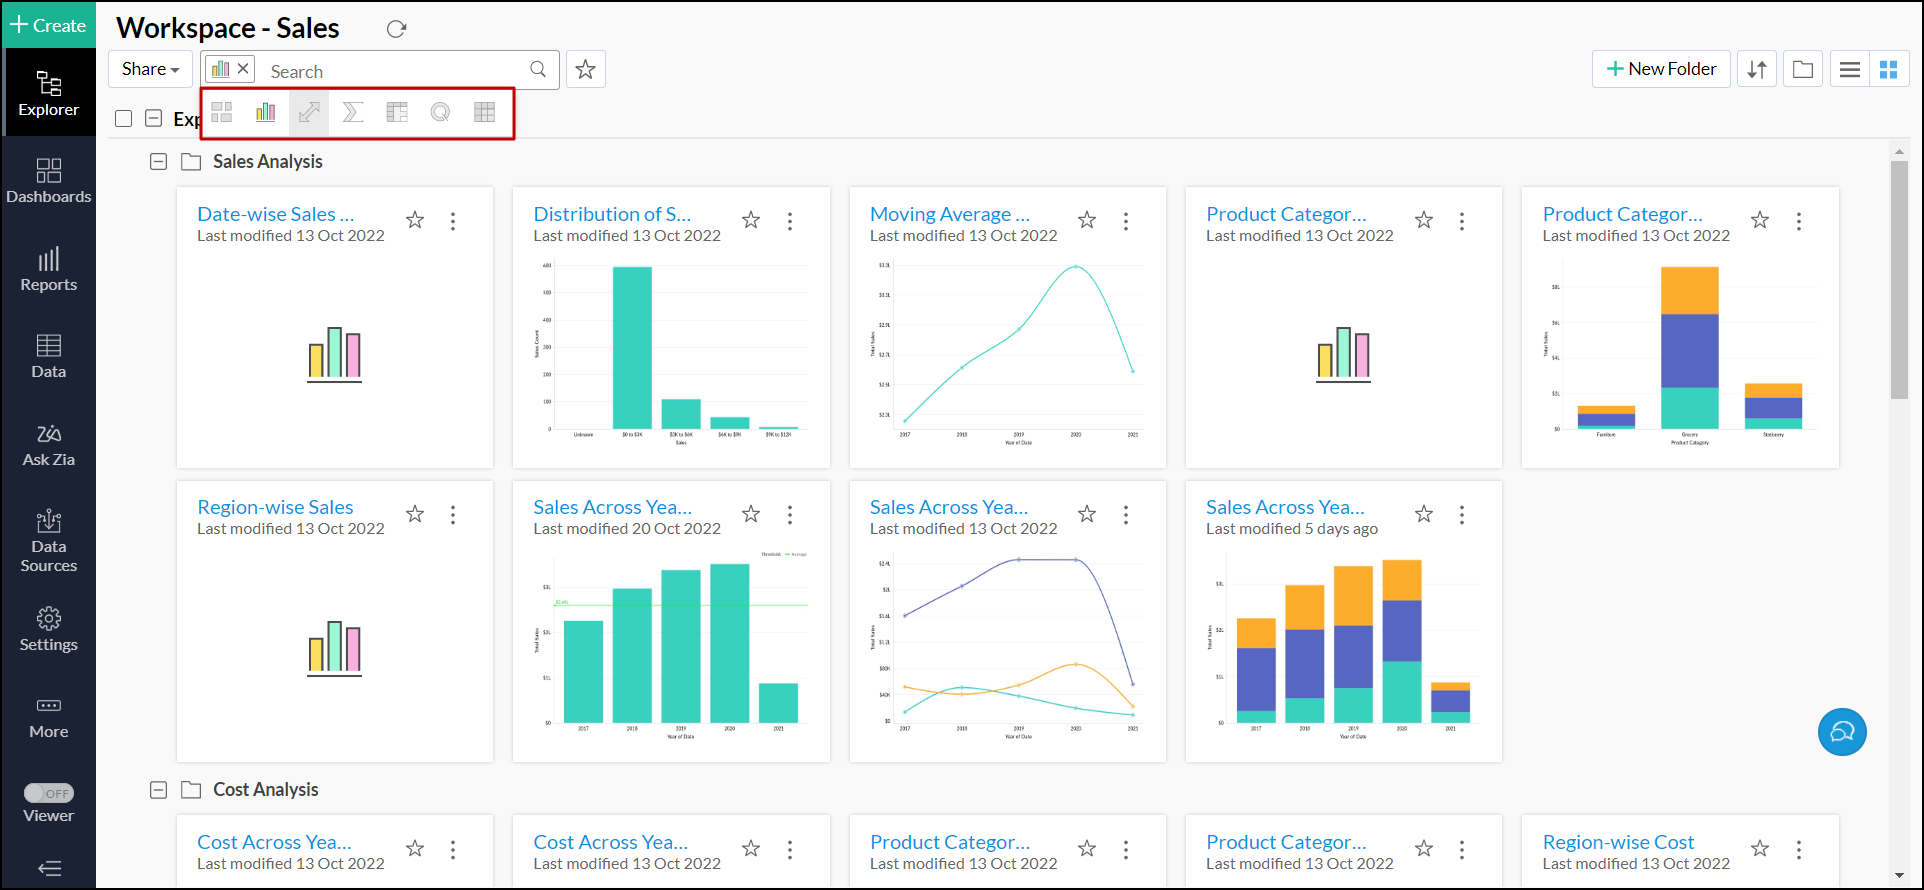
You can also choose to filter a specific type of view by clicking the corresponding icon that appears underneath the search bar.
Analytics Plus enables you to invoke the search bar using the following keyboard shortcut:
- On Windows and Linux: Ctrl + Shift + F
- On Mac: Command + Shift + F
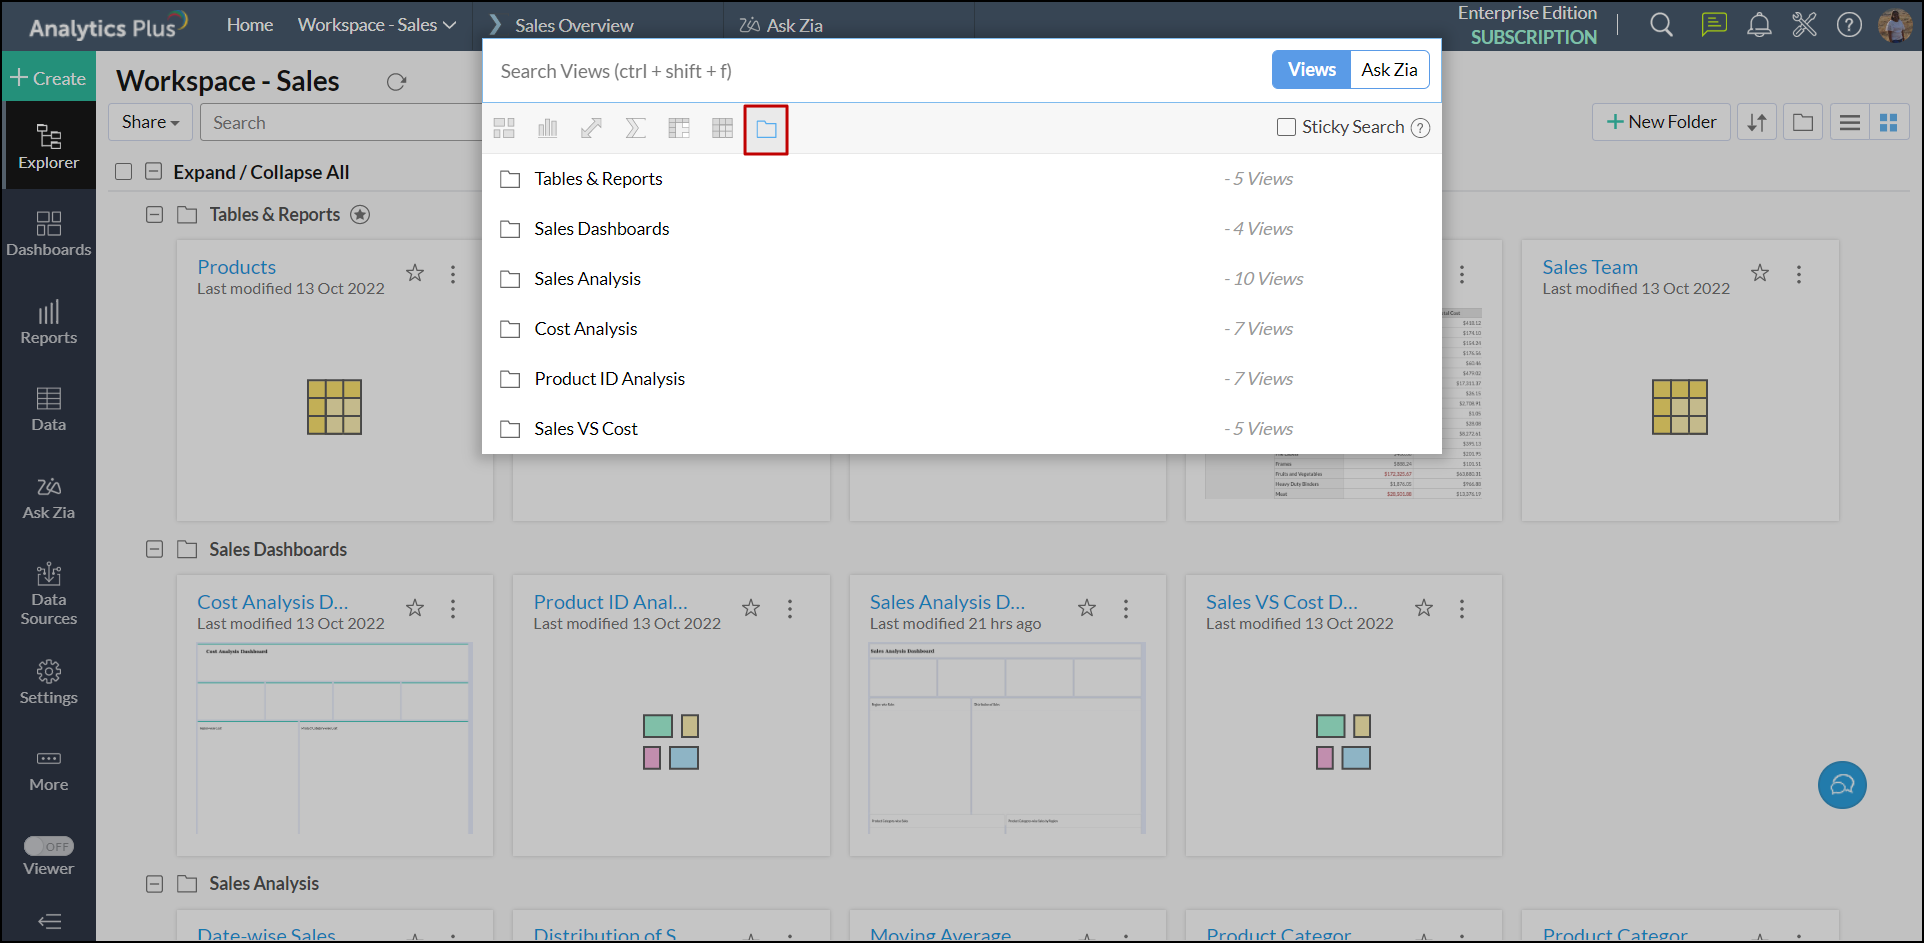
If you open the Search bar using keyboard shortcuts or by clicking the Search Views icon at the top, you can perform the following actions:
Find views specific to a folder. Click the folder icon, and choose the required folder. Analytics Plus takes you to the chosen folder.
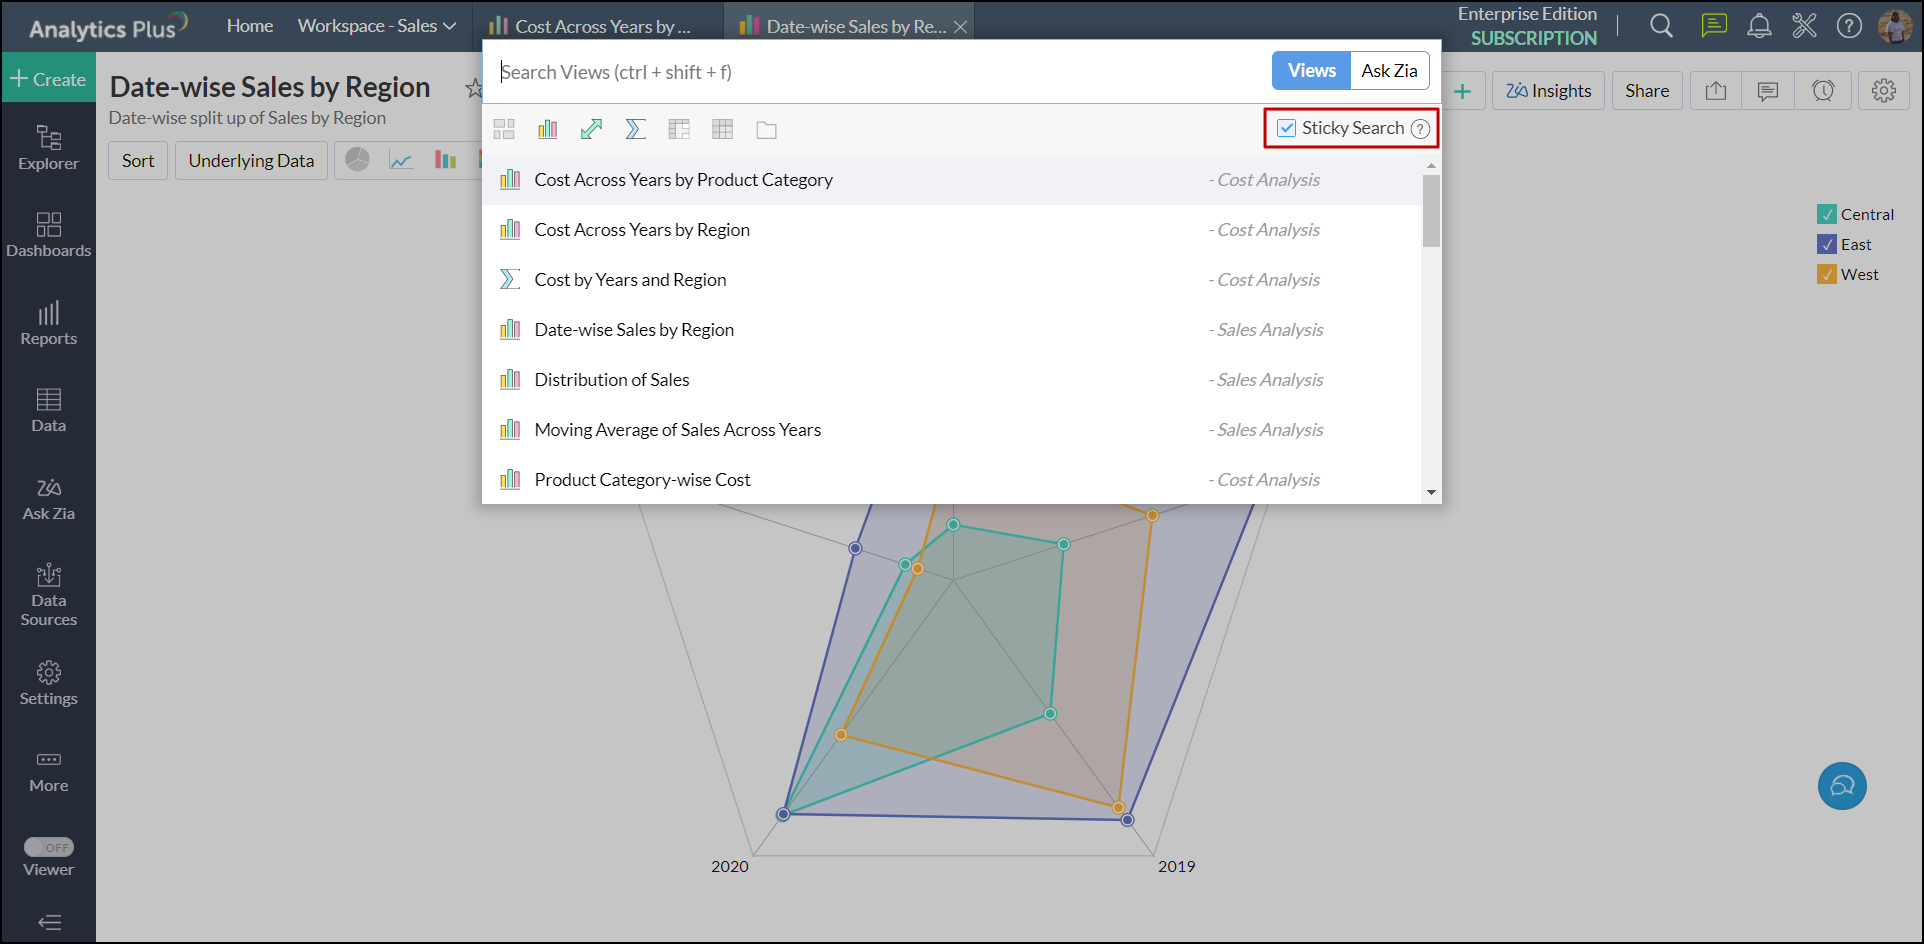
The Sticky Search option allows you to search for and open multiple views in the background without closing the search dialog.
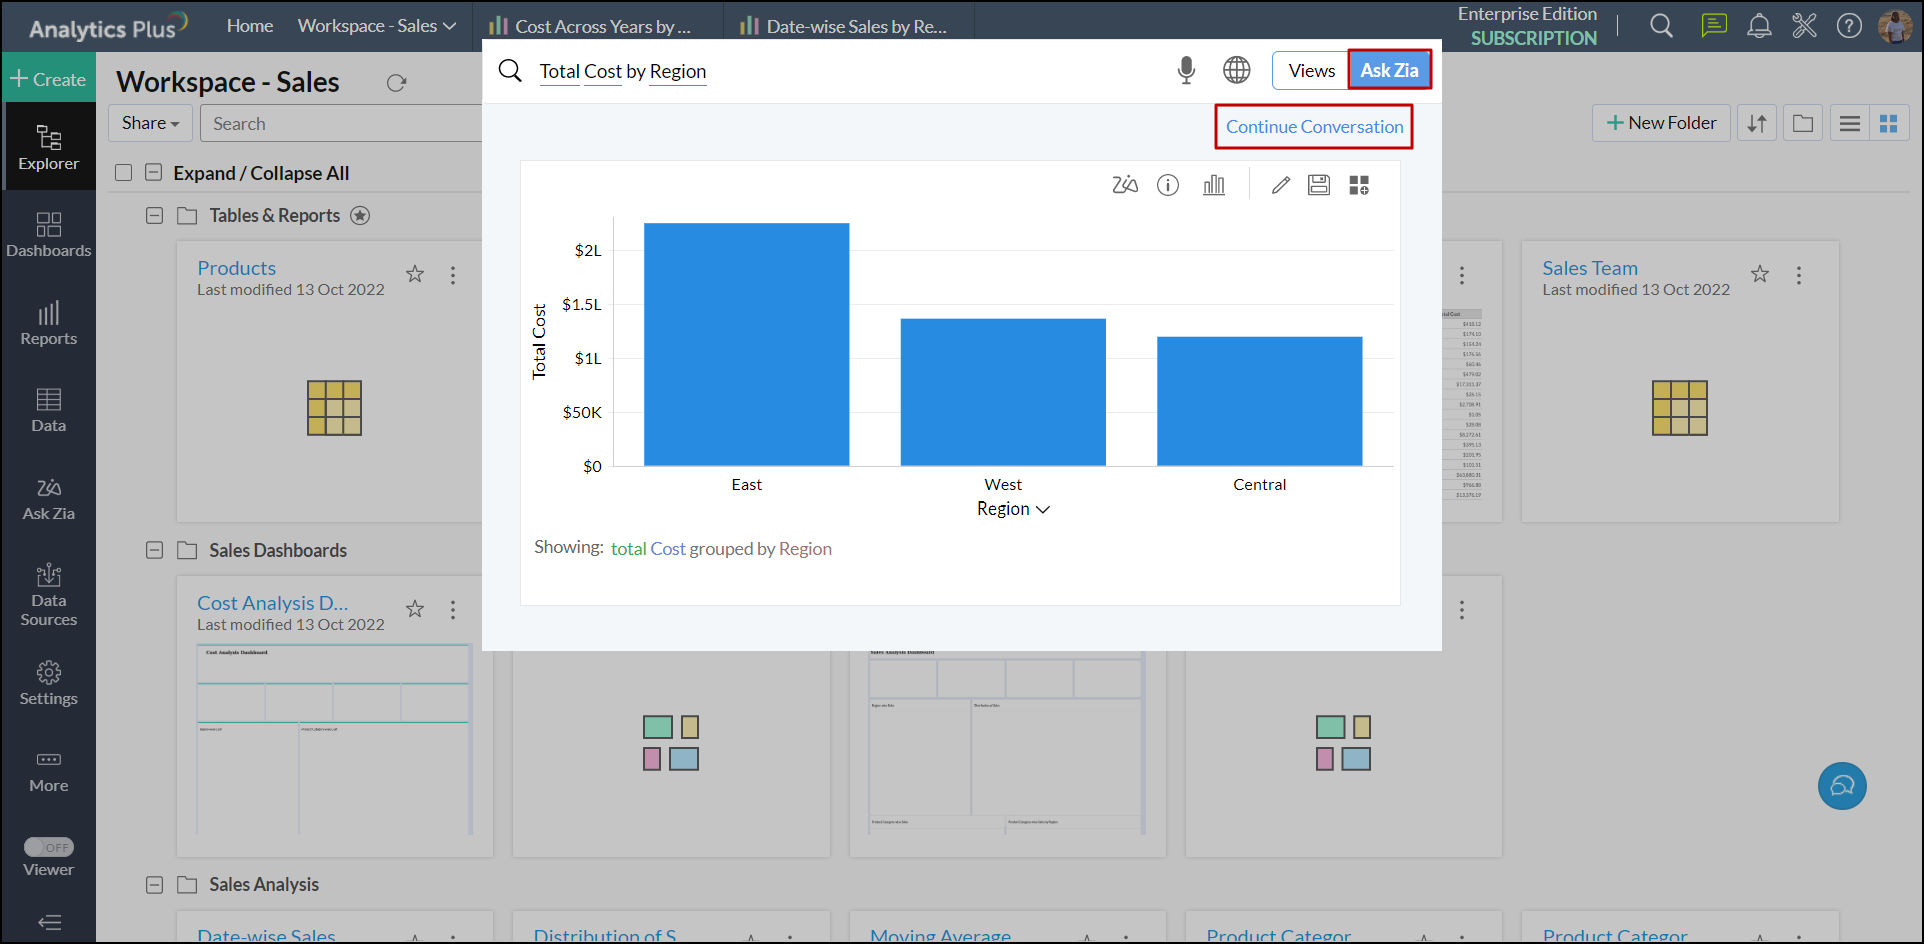
Interact with Zia to generate new reports promptly by clicking the Ask Zia button. Click the Continue Conversation link on the dialog to switch to the Ask Zia interface in Conversation Mode.
12. Is it possible to bookmark important views in a workspace?
You can do this by clicking the Favorite icon that appears near each view in the Explorer page. To view the bookmarked views, click the My favorite option at the top of the page.
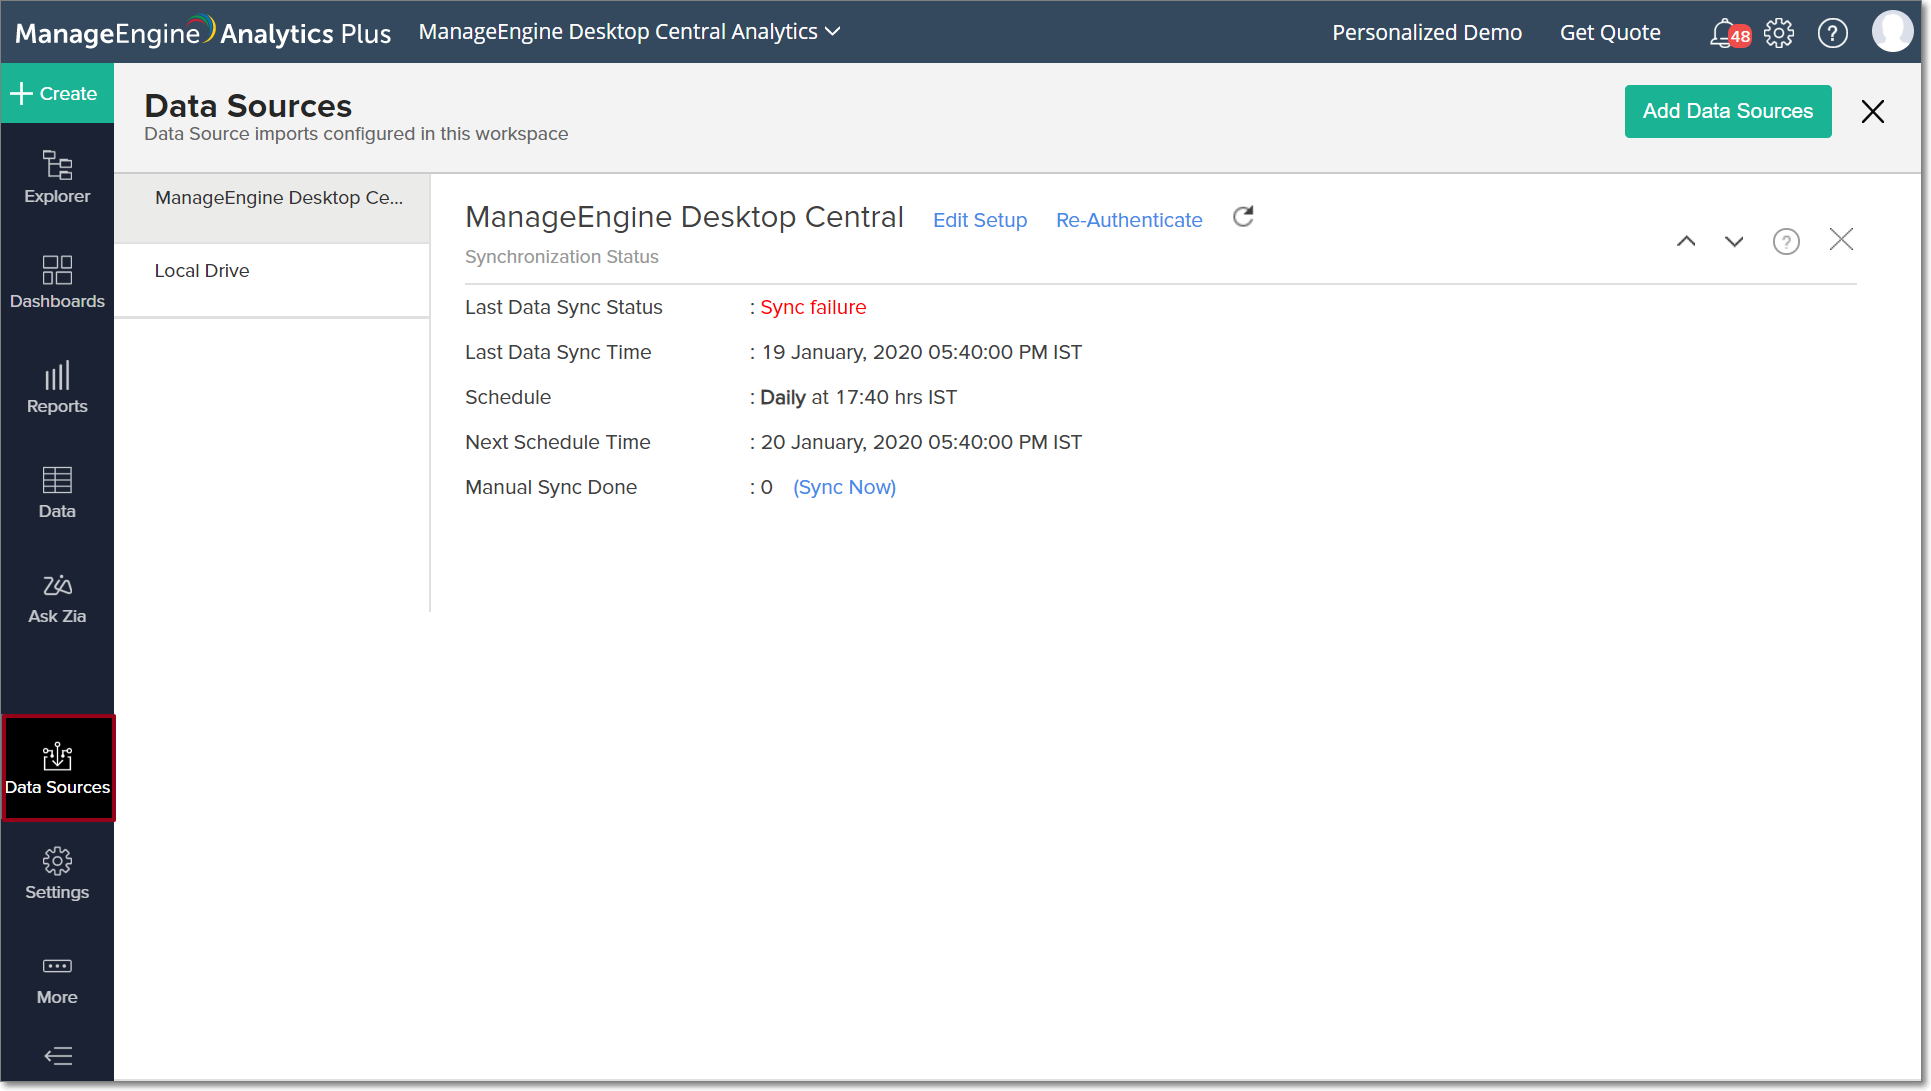
13. How do I view the workspace's data source?
To view the source from which data has been imported into the workspace, click the Data Sources button from the side panel of the required workspace. The workspace's data sources will be listed, and clicking on a required data source will display the import configurations of that source.
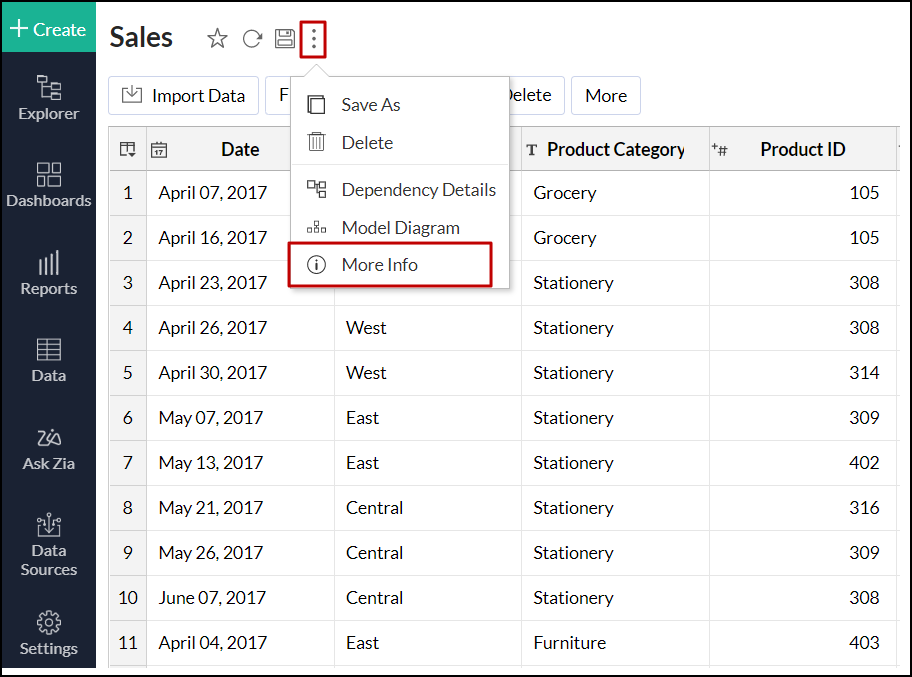
14. How can I get all the details of the Views in my workspace?
Analytics Plus enables you to get all the information about a view using the More Information option. For this, open the required view, click the More Actions icon, and choose More Info.
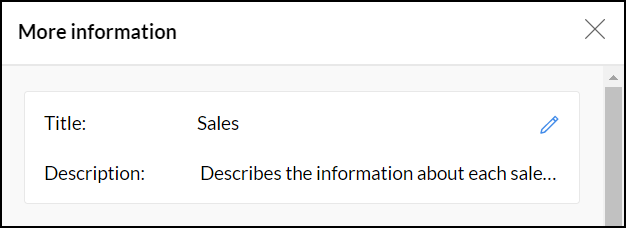
In the dialog that appears, you can view and edit the following information:
Section 1: This section includes the Title and Description of the view. Click the Edit icon that appears on mouse over the section to modify the information as required.
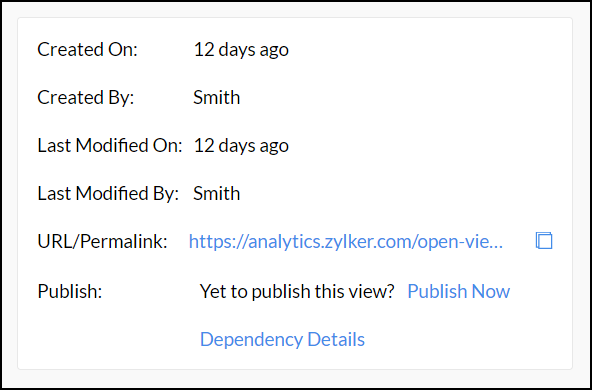
Section 2: The following details are listed in this section.
- Created On: The time at which the view is created.
- Created By: The name of the account used to create the view.
- Last Modified On: The time at which the view is modified lastly.
- Last Modified By: The name of the account used to perform the latest modification.
- URL/ Permalink: The web client URL used to access the view.
- Publish: Gives the published status of the view. If the view is not published, click the Publish Now link. Else click the Edit icon to modify the publish settings.
- Dependency Details: Click this link to view all the dependency details of the view in a new dialog.
Section 3: This section displays the data source and synchronization information of the view. The options displayed may vary based on the data source used to import data.
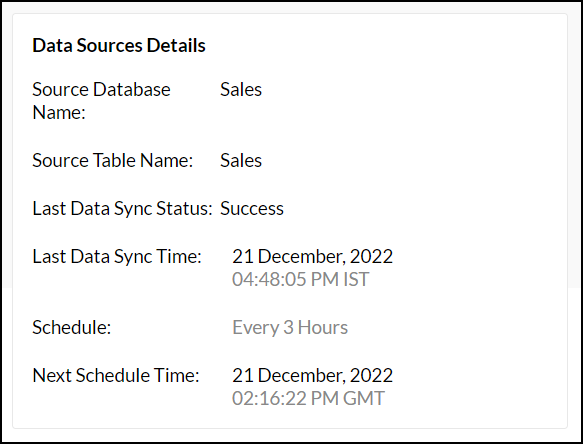
For Query tables, it displays the query used to create the view. You can copy the query from here.
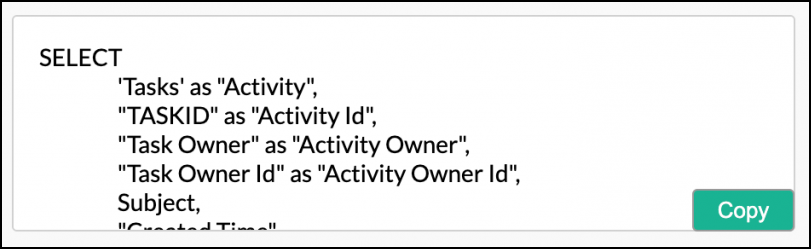
Please note that this section does not apply to reports and dashboards.
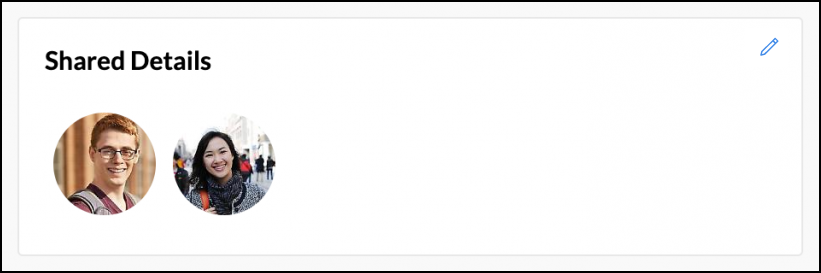
Section 4: This section gives the list of users with whom the view is shared.
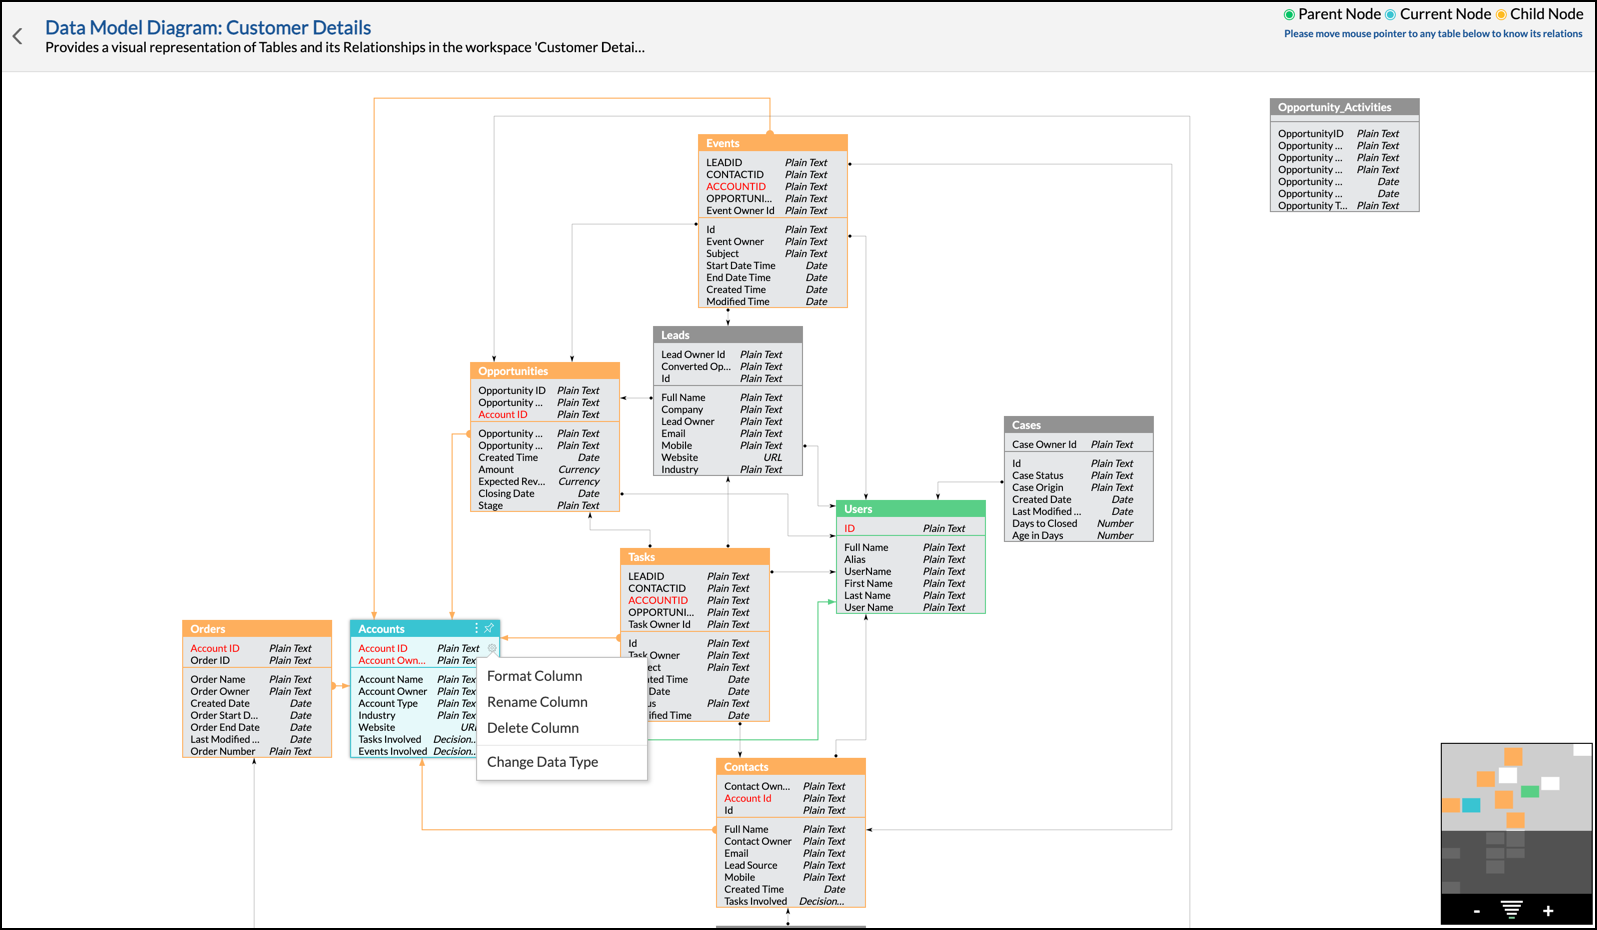
15. Can I view the relational data model of my Workspace?
Yes. Analytics Plus allows you to view the relationship between all the tables in your workspaces using the Model Diagram user interface. For this, click the Data option from the left pane and choose Model Diagram.
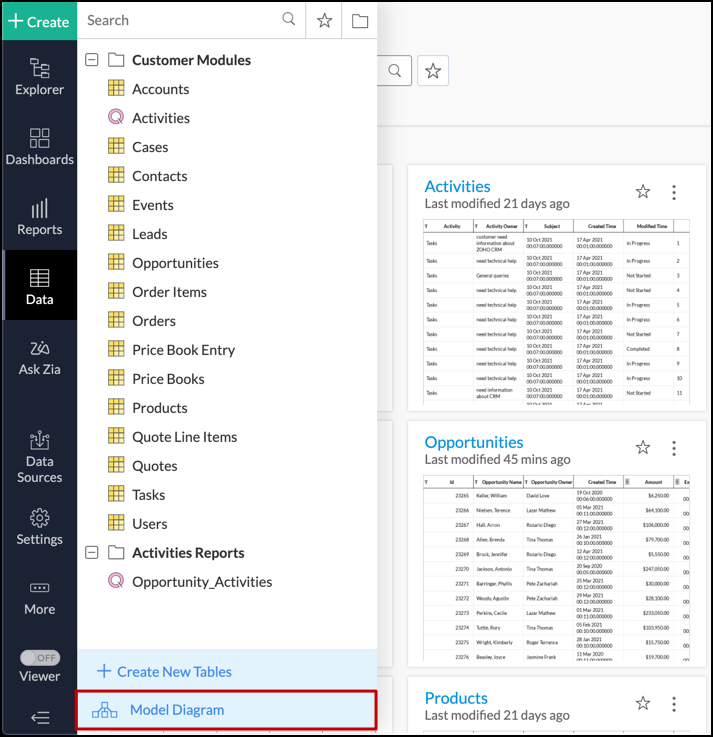
From the Model Diagram window, you can perform the following actions:
- View all the tables available in the workspace and their relationship details.
- Rename a table.
- Format, rename, delete, and change the column data types.
16. Can I view the dependency details of a table or a report?
You can easily access the details of views that are dependent on a particular report, table or query table in Analytics Plus.
Dependency details of reports
Open the required report, click the More icon and select the Dependency Details option. Every table that the report is dependent on will be listed on the screen that appears.
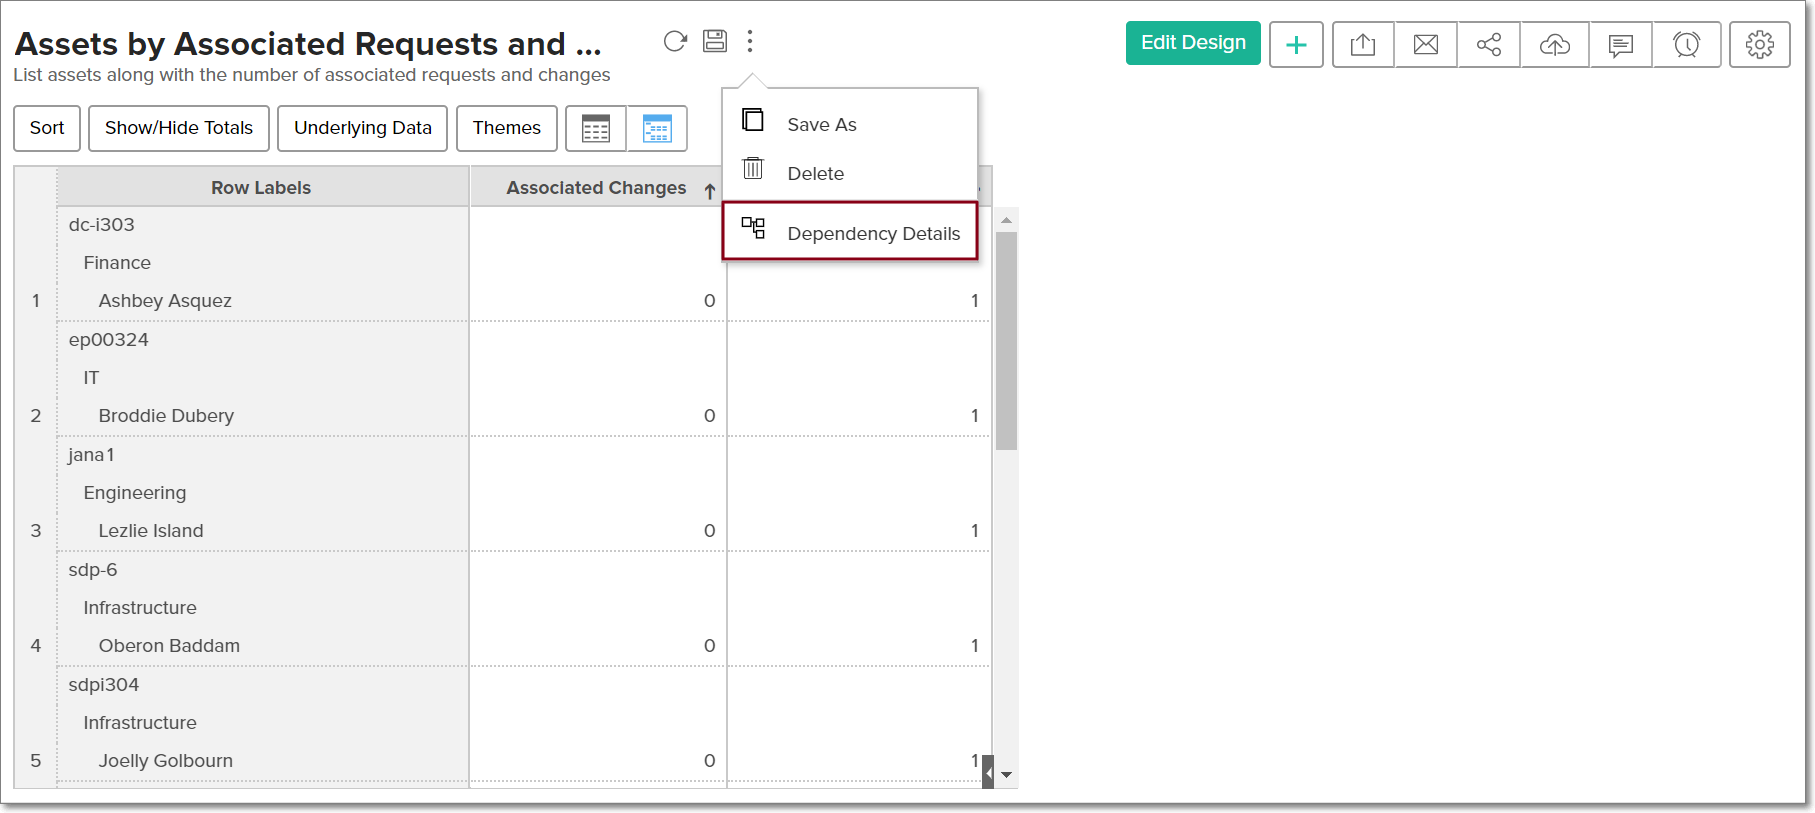
You can further view the dependency details of these tables by clicking the Child Views icon at the top right corner of every tile.
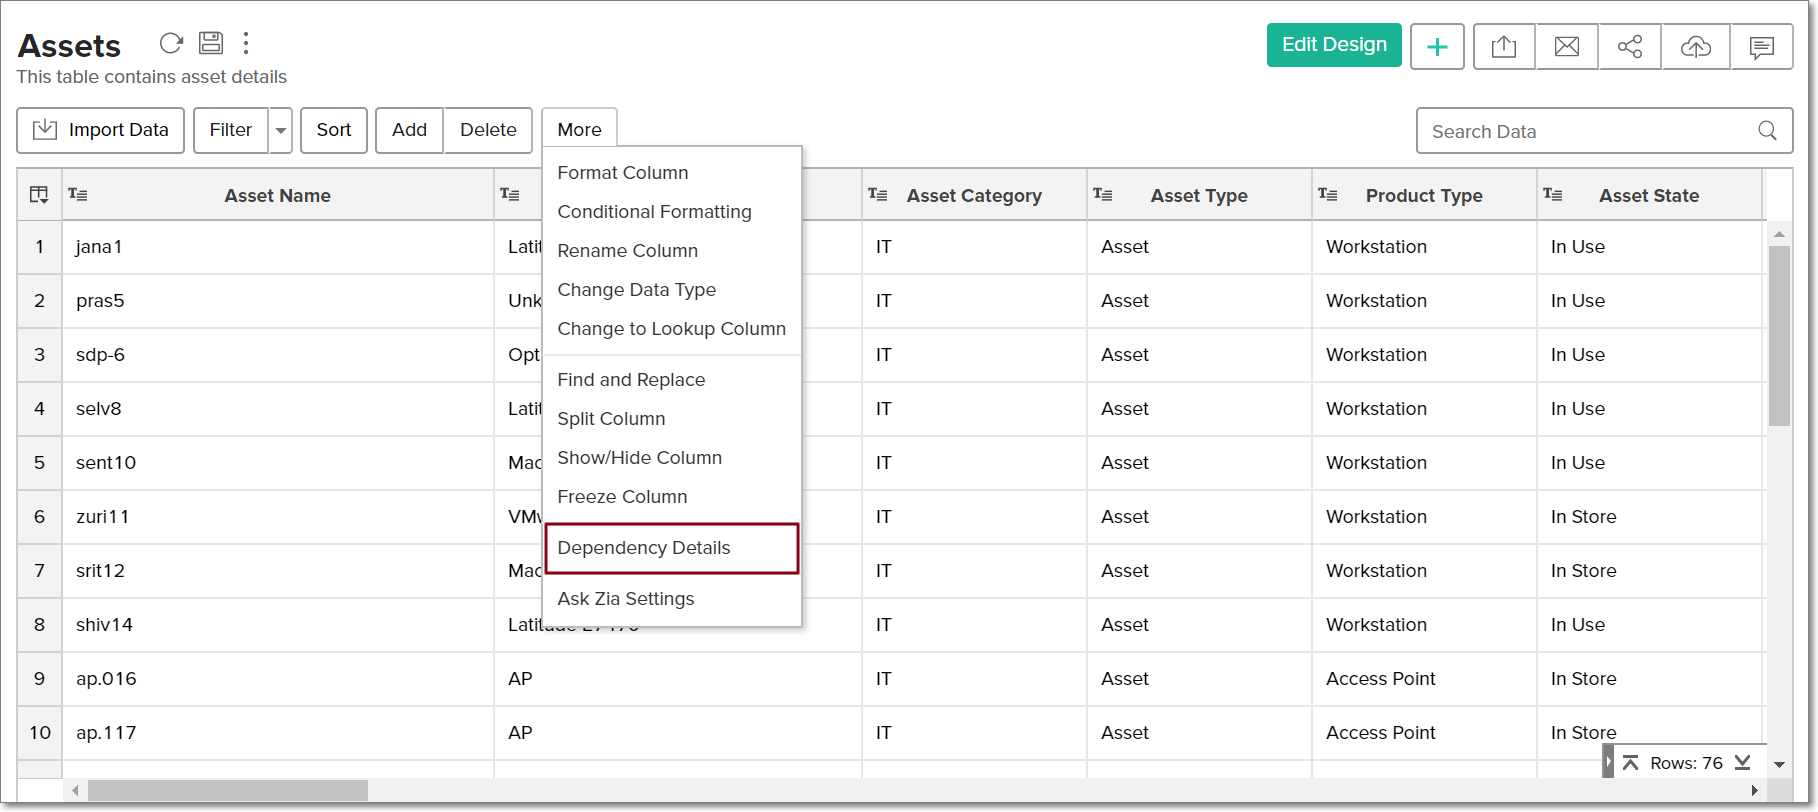
Dependency details of tables
Open the required table, click the More button and select the Dependency Details option. Every report that is dependent on this table will be listed.
Dependency details of query tables
A query table in Analytics Plus is created using other tables, and these tables are referred to as Level 1 dependent tables, with respect to the query table. However, if the query table is created using another query table, the tables used for creating the second query table are said to be Level 2 dependent tables, with respect to the first query table.
While viewing the dependency details of query tables in Analytics Plus, you can also view their level of dependency. Follow the steps below to access a query table's dependency details.
- Open the required query table, click the More button and select the Dependency Details option. The following options are available:
- By Views: This option lists only the Level 1 tables, and the reports that are created using the query table.
- By Tables: This option provides a list of every child and parent table of the query table, based on their dependency level.
17. Is it possible to recover the views that have been deleted in Analytics Plus?
To recover deleted reports, dashboards and tables in Analytics Plus, click the Trash option under the More button from the side panel. This opens the Trash page, which lists the views that have been recently deleted in the workspace. Navigate to the required visualization, and click the Restore button that appears on mouse over.
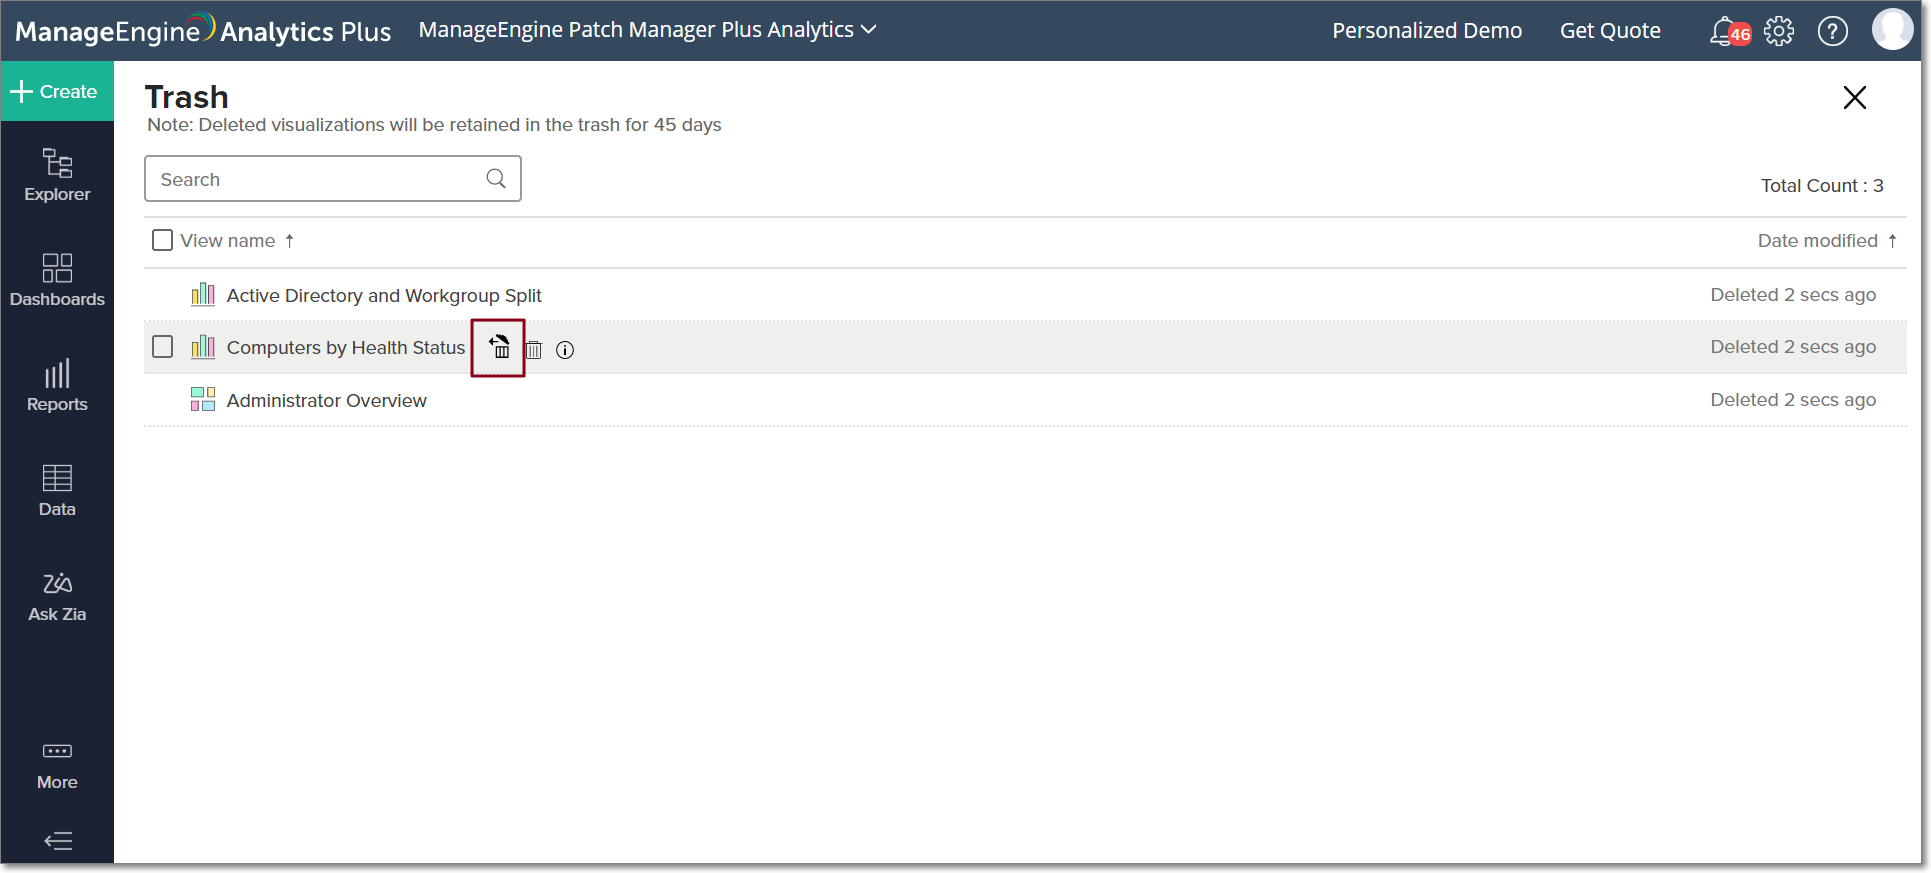
Note: Deleted views will be retained in the trash for only 45 days.
Tagging Views in Your Workspace
1. What are tags and how do they help manage your workspace?
Tags are keywords or labels assigned to views to help organize, categorize, and locate content efficiently. You can assign tags to views such as dashboards, tables, query tables, and reports. Instead of relying solely on folders, tags allow for a more flexible, cross-functional organization system.
How they help:
- Streamlined Organization: Group related items across different folders.
- Faster Discovery: Quickly filter the Explorer page by searching for a specific tag.
- Visual Identification: Color-coded tags make it easy to distinguish between different categories of data at a glance.
Once applied, tags appear alongside the view name and can be searched from the Explorer page to filter relevant views instantly.
2. How to add a tag to a view in Analytics Plus?
You can associate tags with a view using two primary methods. You can assign multiple tags to a single view.
From Report Level:
- Create or open the view you wish to tag.
- Click the Tags icon at the top.
- The Add Tags dialog will open
- To add an existing tag: Type the name and select it from the suggestions.
- To create a new tag: Type the name and click Create. You can also choose a color from the palette to make it visually distinct.
- Click OK. The tags will now appear next to the view name.
From the Explorer Page:
- Navigate to the Explorer page in your workspace.
- Locate the view, click the More icon on its card, and select Rename / Tag.
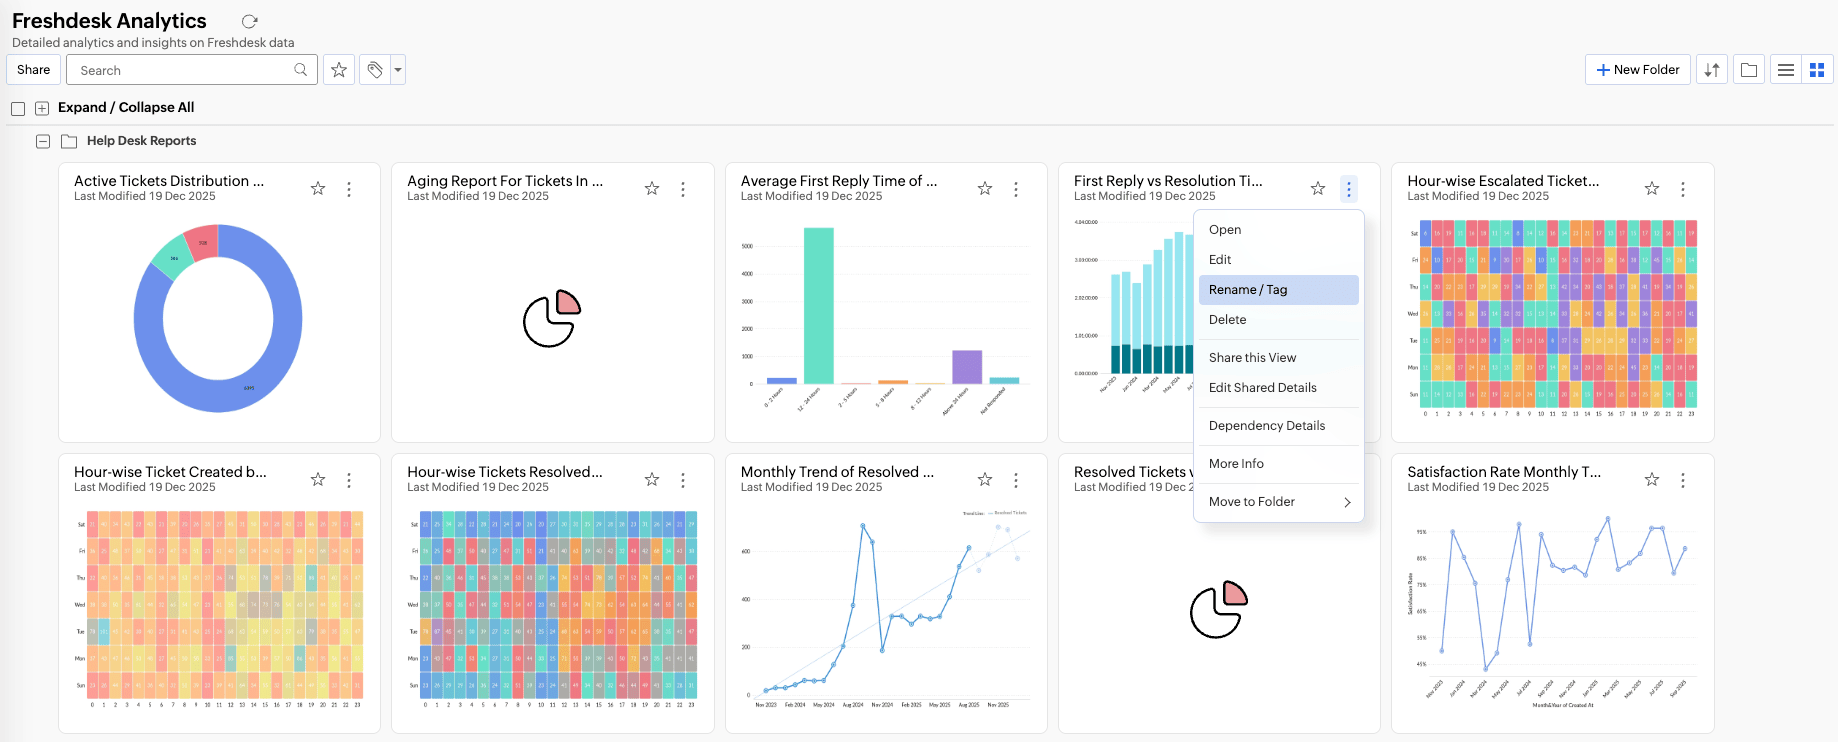
- In the Save As dialog, find the Rename View section.
- Type the tag name, select from suggestions, or create a new one.
- Click OK to save.
3. How to modify or remove tags in Analytics Plus?
You can modify or remove (dissociate) tags from views using the same method above where tags are added.
Editing tags from the Report level
- Open the view from which you want to edit a tag.
- Click the Tags icon.
- The Edit Tags dialog will open, where you can find the Tags associated with the view.
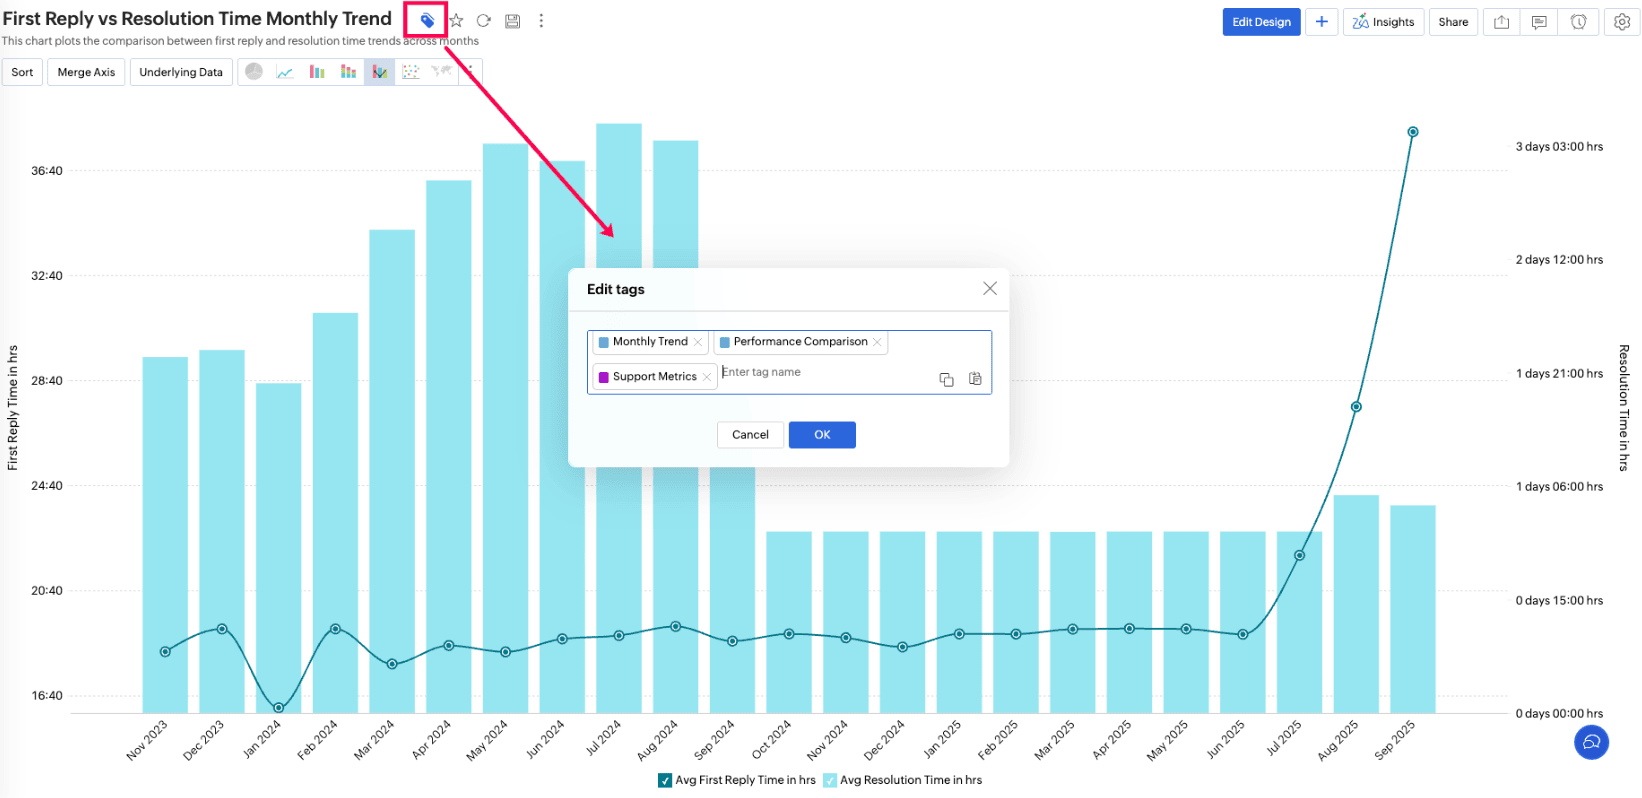
- All the tags associated with this view will be listed.
- Click the X icon next to the tag you want to remove.
- You can also add new tags to this selected view.
- Click OK to update the view.
Editing tags from the Explorer page
- Go to the Explorer page.
- Find the view and click the More icon.
- Select Rename/Tag.
- In the Edit Tags section, click the X icon next to the tag you want to remove.
- Click OK to save.
4. How do I manage tags globally across your workspace?
Analytics Plus provides a centralized Manage Tags section that allows you to control all tags within a workspace from a single location, rather than editing views individually.
How to access Manage Tags
You can reach this section using two different paths:
- Via the Explorer Page: Click the Tags drop-down menu in the top toolbar, and select Manage Tags.
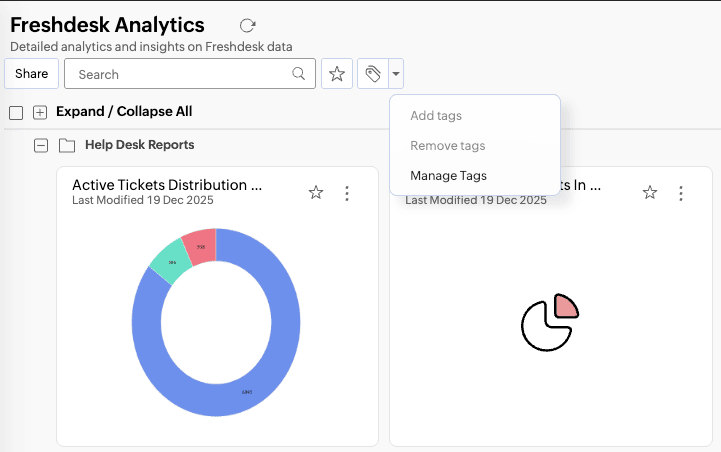
- Via Workspace Settings: Navigate to Workspace Settings and select the Manage Tags tab.
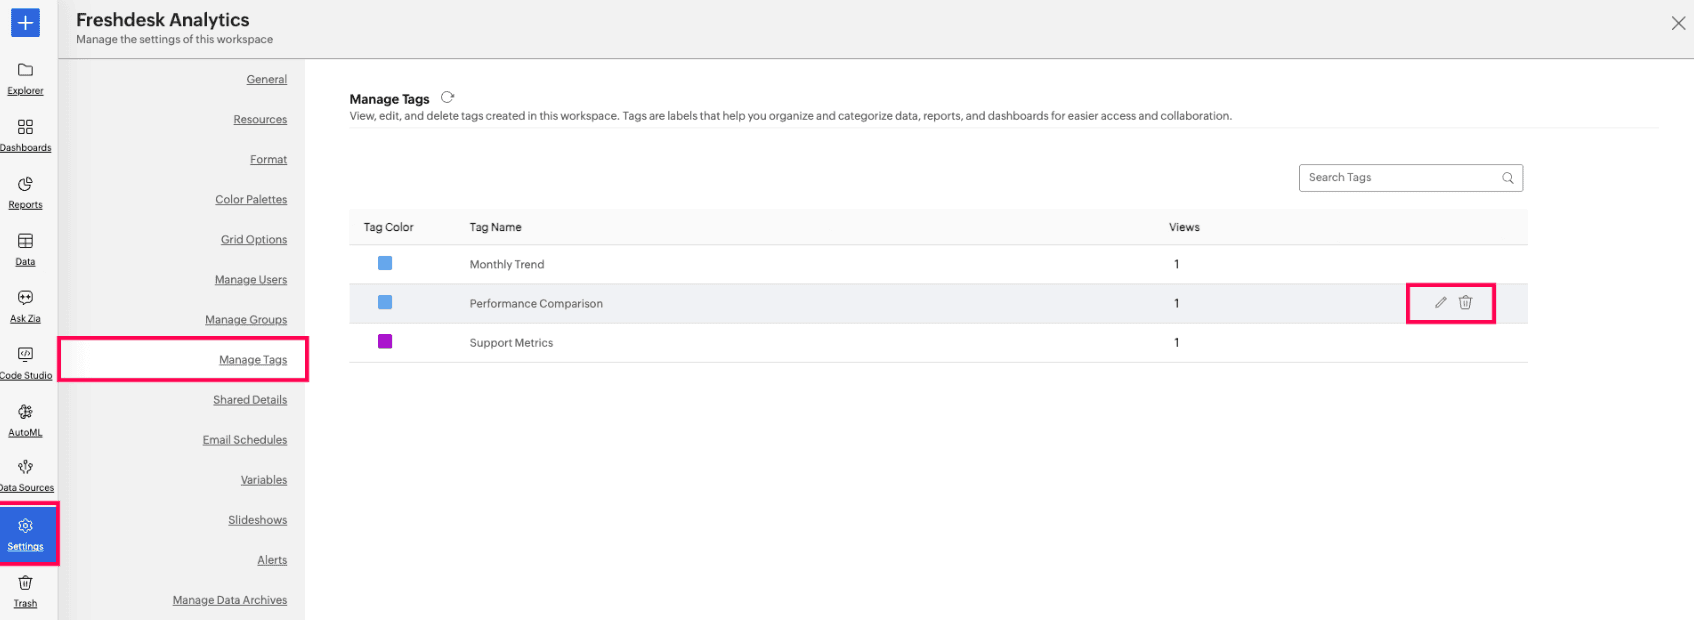
Manage Tags
Once the Manage Tags page opens, you will see a comprehensive list of all tags created in the workspace, along with the count of views associated with each tag.
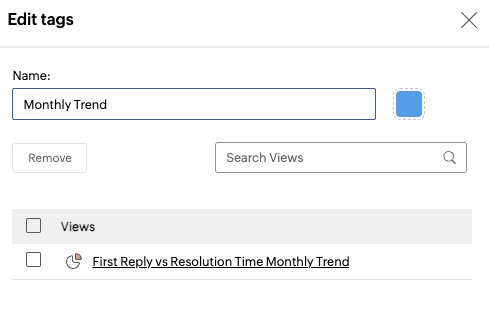
Edit Tags: Click the Edit icon next to a tag to open the Edit Tag dialog. From here, you can:
- Rename the tag.
- Update its color.
- View all associated reports and dashboards and remove specific views from the tag as needed.
Delete Tags: Click the Delete icon to remove a tag from the entire workspace permanently.

