Working with Ask Zia
Invoking Ask Zia
Analytics Plus allows you to invoke Ask Zia in the following ways:
From the navigation menu
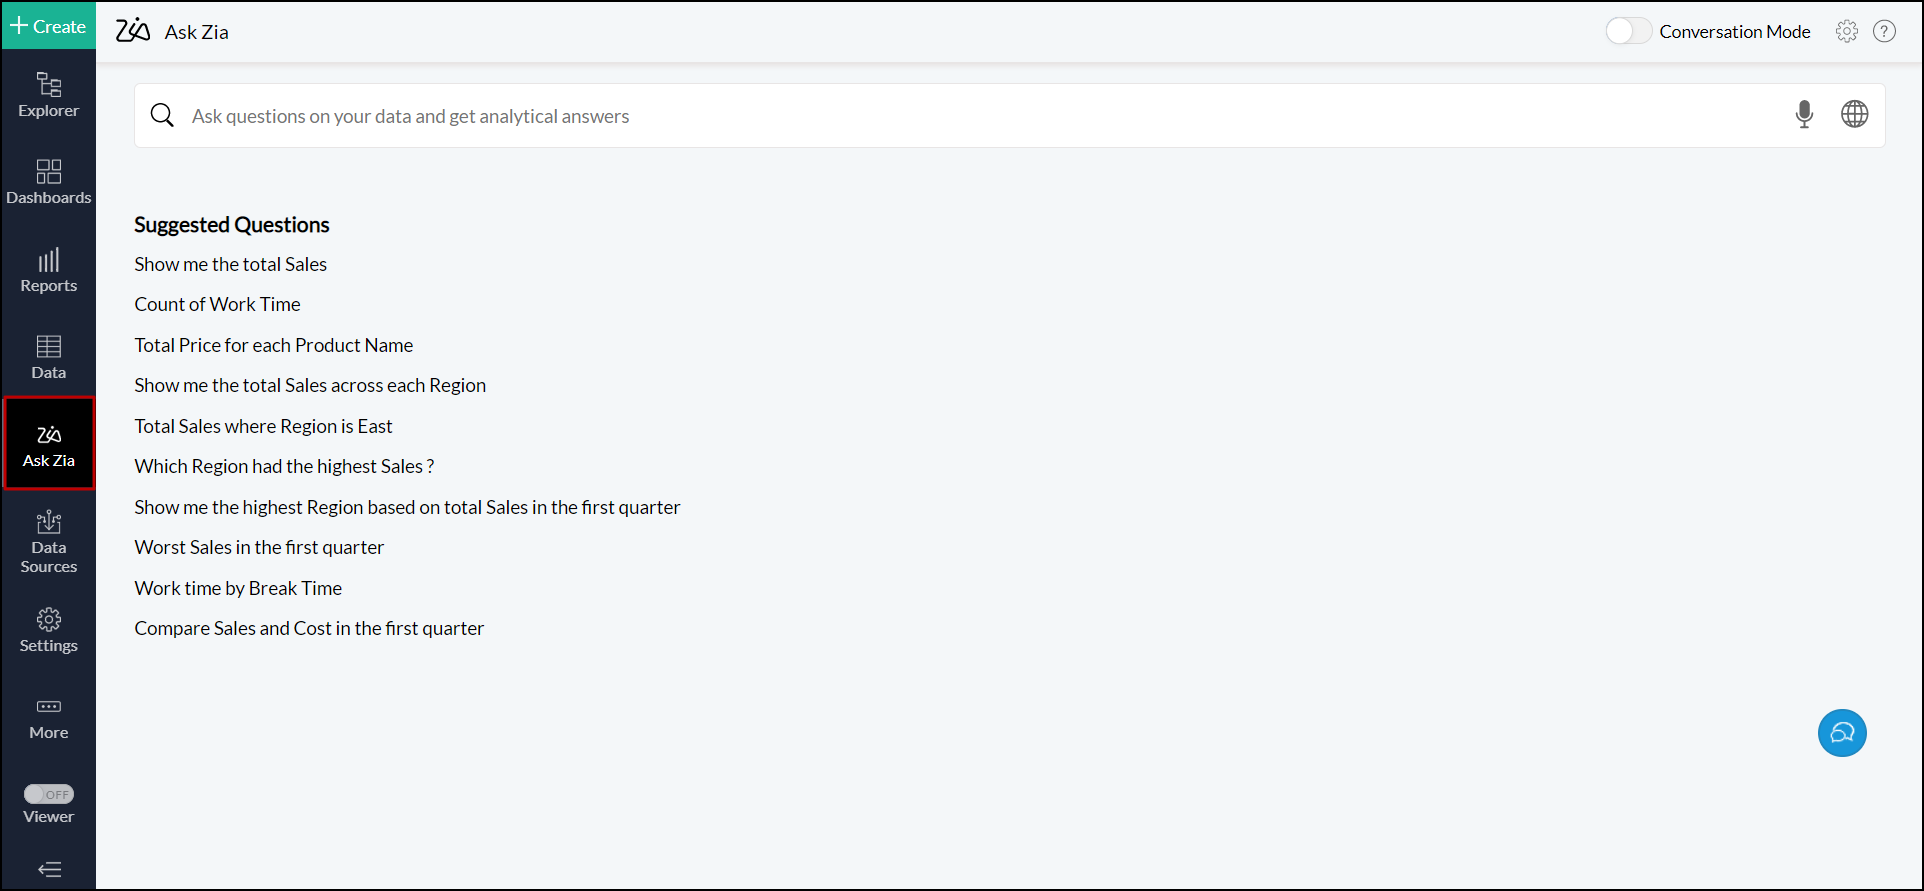
Click Ask Zia from the left pane to access the Ask Zia page.
From Workspace explorer
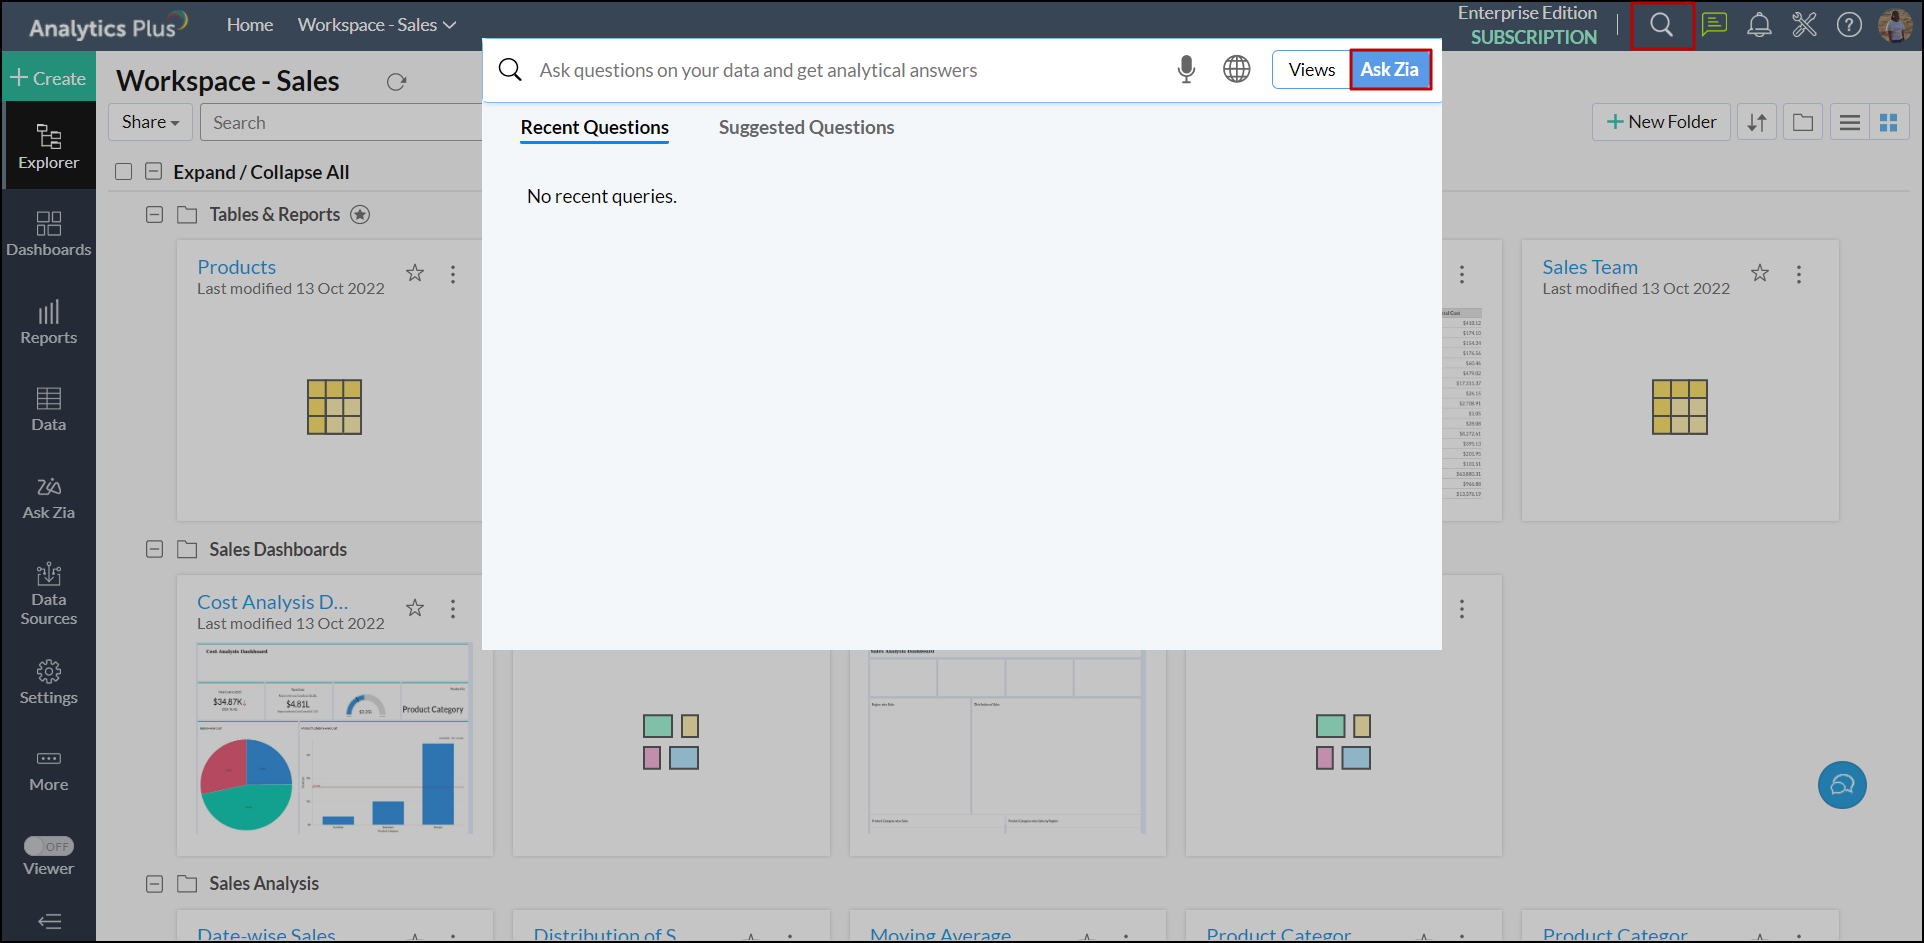
To access Ask Zia from explorer, click the Search icon from the top bar. In the search dialog that appears, switch to the Ask Zia tab to invoke it.
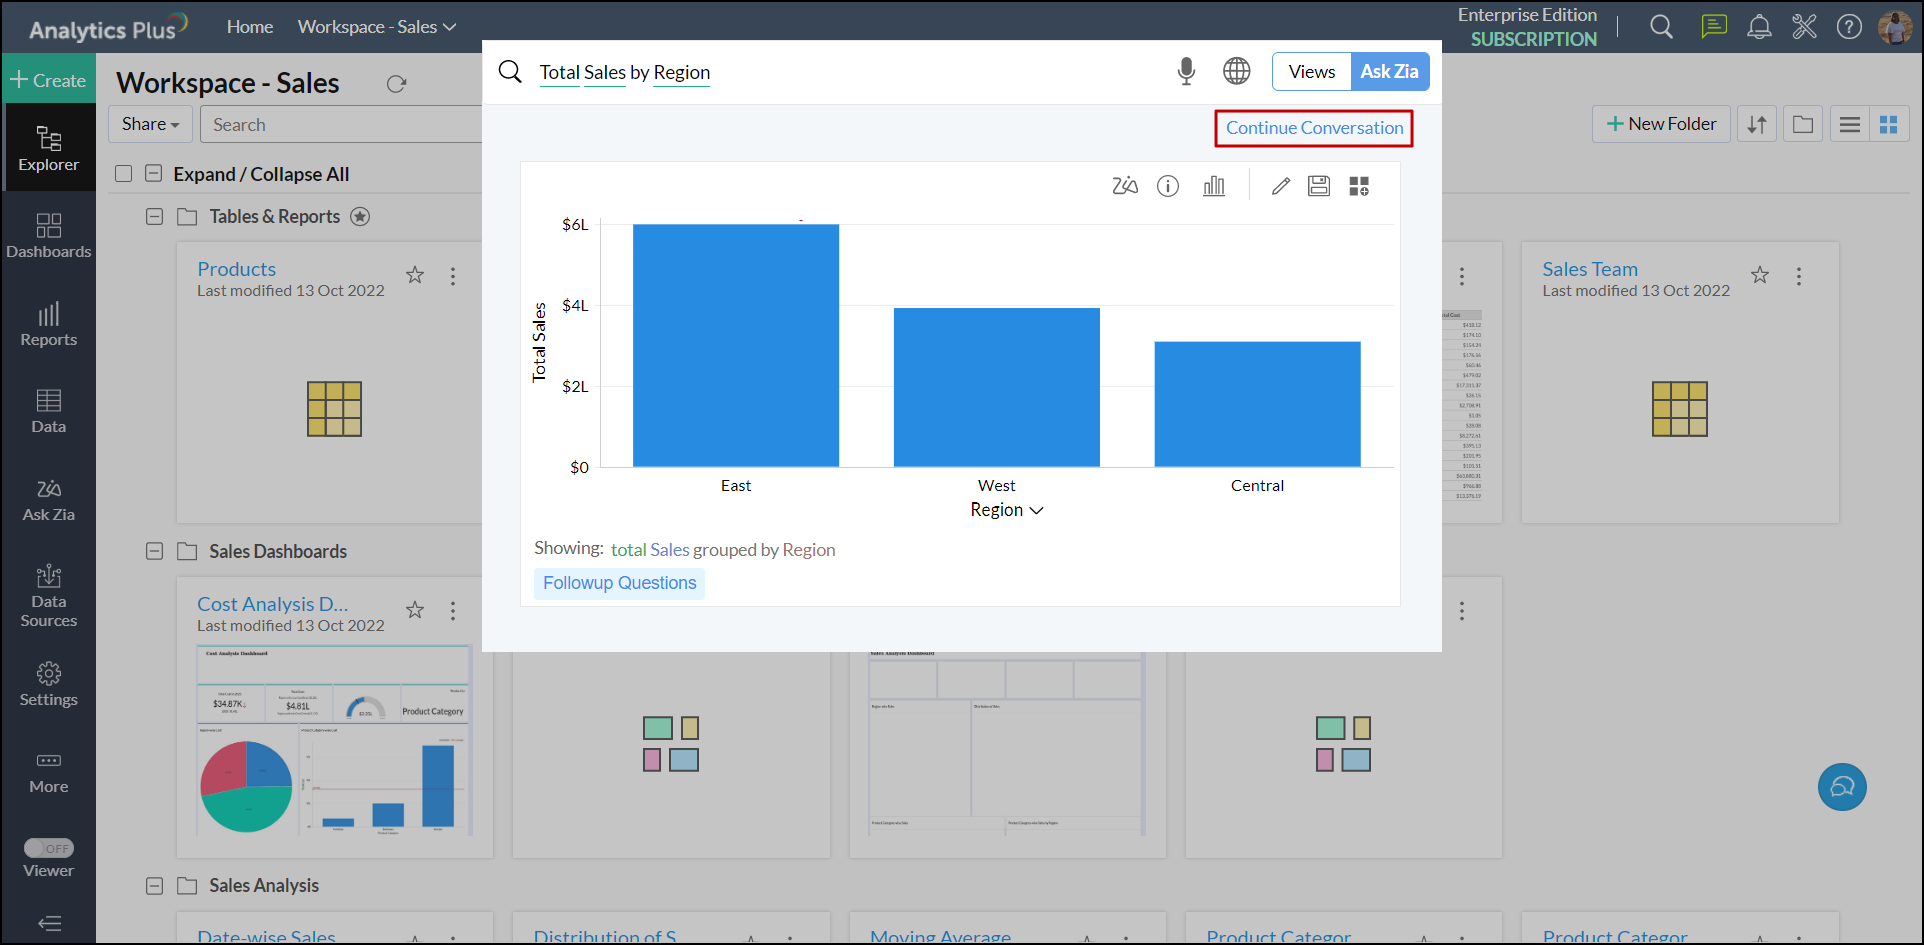
On generating the initial report, click the Continue Conversation link to open the Ask Zia window in Conversation mode. Click here to learn about conversing with Zia.
From Dashboards
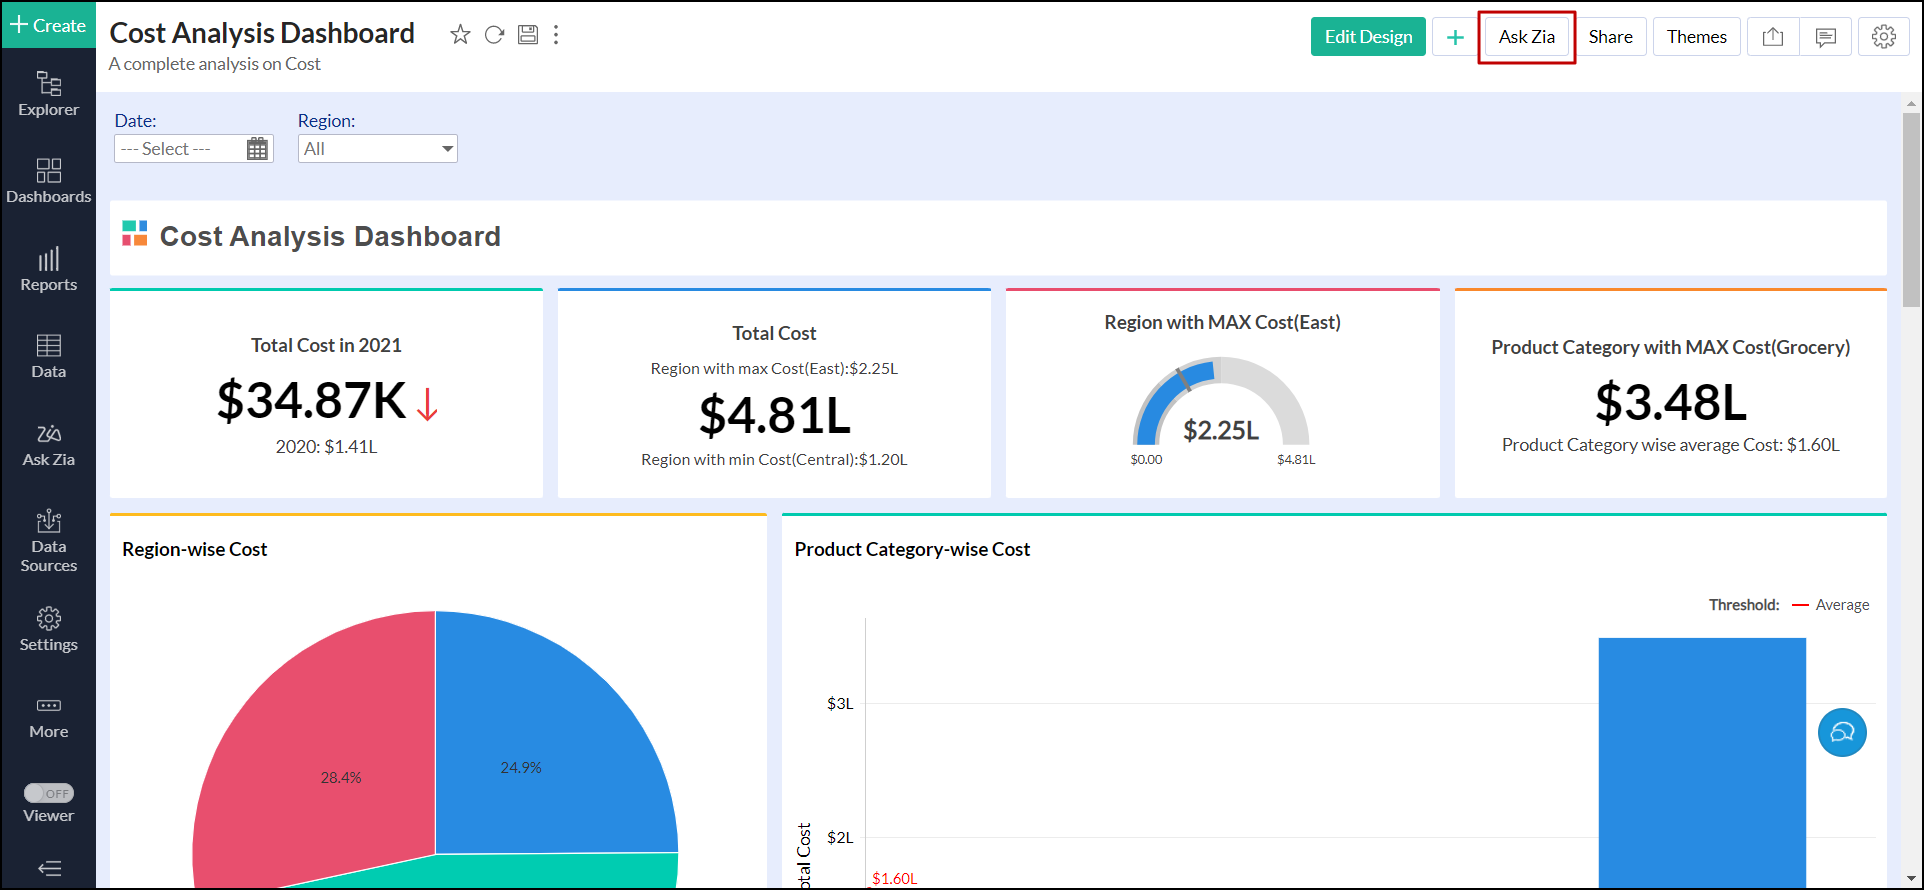
Analytics Plus lets you access Ask Zia from the dashboard page. Click the Ask Zia button at the top to open Ask Zia in conversation mode.
Using Ask Zia
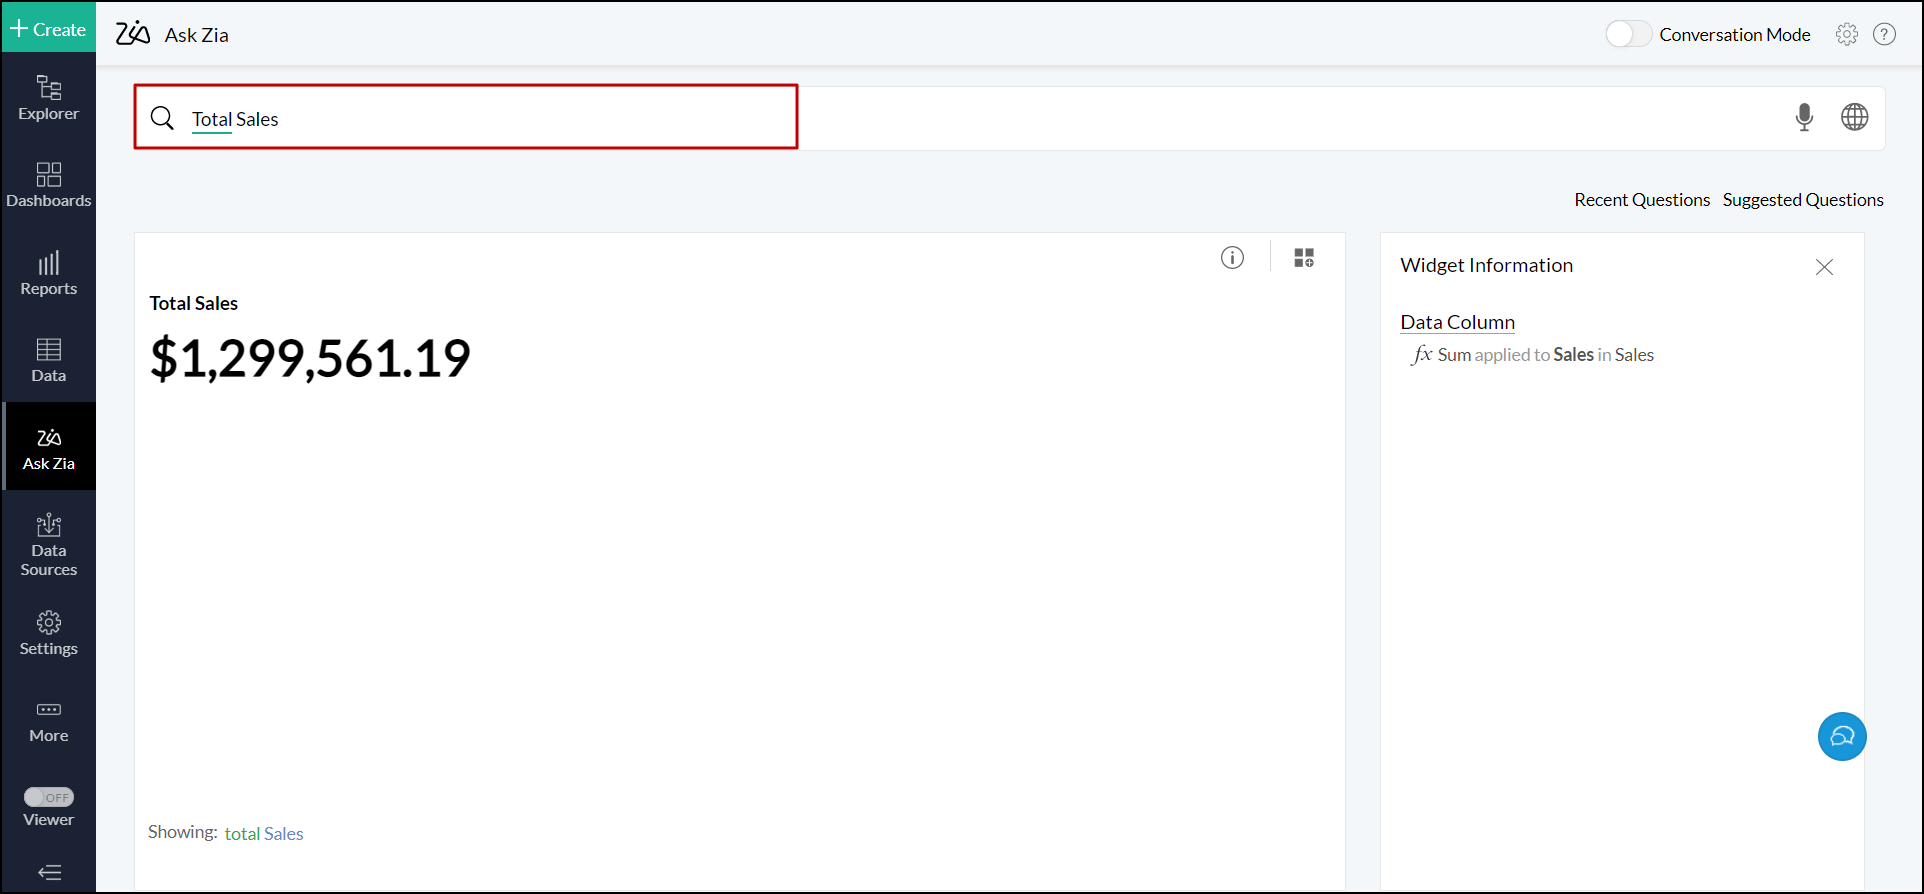
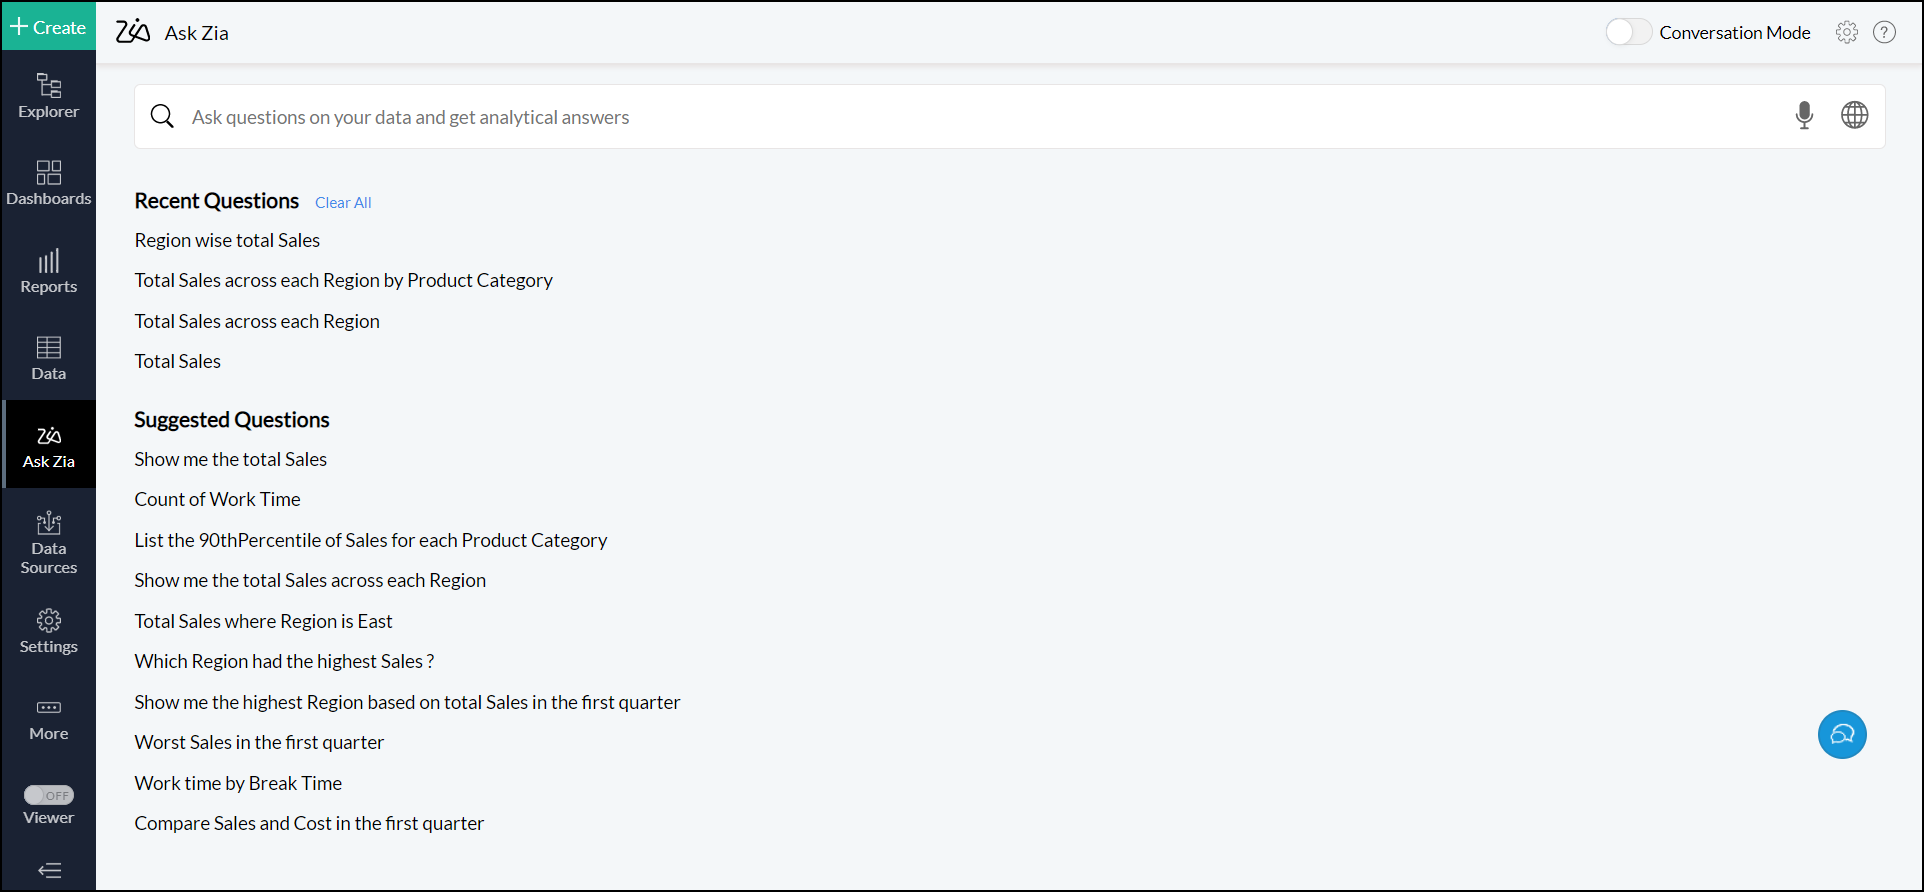
On the Ask Zia page, type your question into the text box provided. Ask Zia interprets the question and generates the best possible report as an answer.
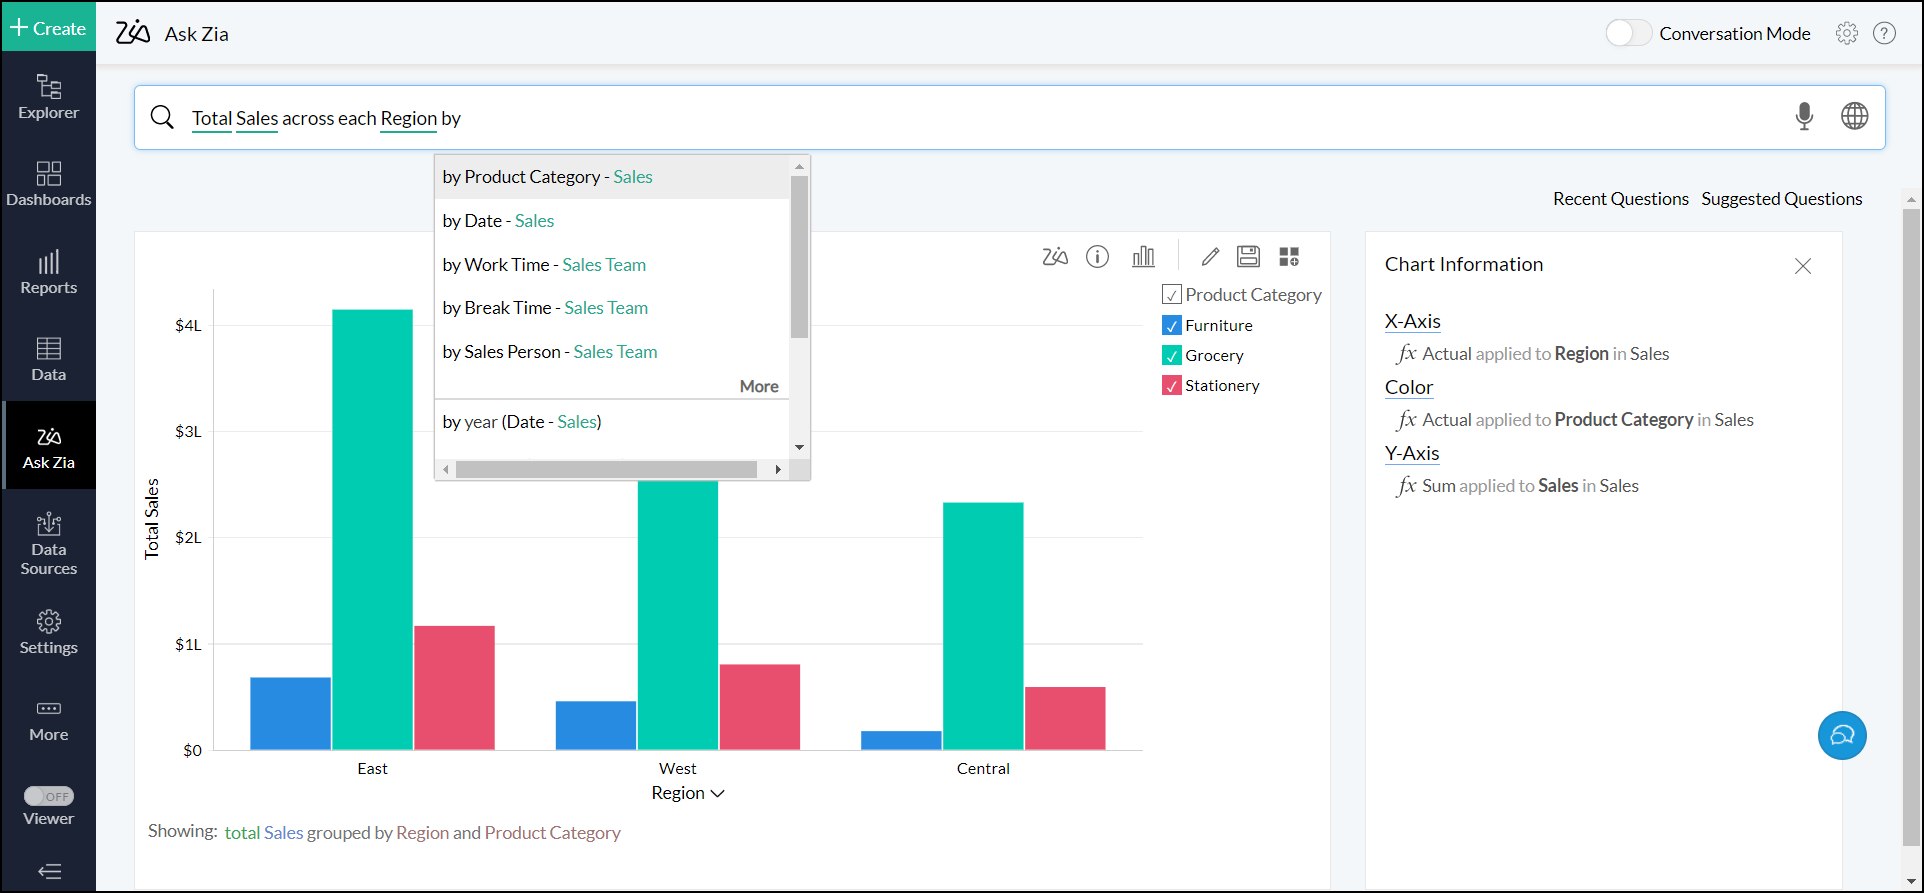
You can also add more qualifiers to your question to generate the relevant and detailed insights.
Auto suggestions
Ask Zia learns from the patterns in your questions and provide intelligent and personalized suggestions to assist you in drafting the question. These suggestions are based on the relationship among the tables, previous history, Ask Zia customizations, etc. The auto-suggestion also suggests supporting phrases (such as Top 10, Bottom 10), sort options, chart types, and more.
Ask Zia also suggests a set of follow-up questions, once it generates the initial report. For this, click the Followup Questions button that appears when hovering over the generated report.
Analytics Plus offers a list of Suggested Questions for your workspace while accessing the Ask Zia page. You can easily generate reports by clicking one of the suggested questions or anyone of the recently searched questions from the Recent Questions list.
Working with the generated report
Description
The reports generated by Ask Zia will be displayed as previews, with a detailed description and information on how the reports are plotted.
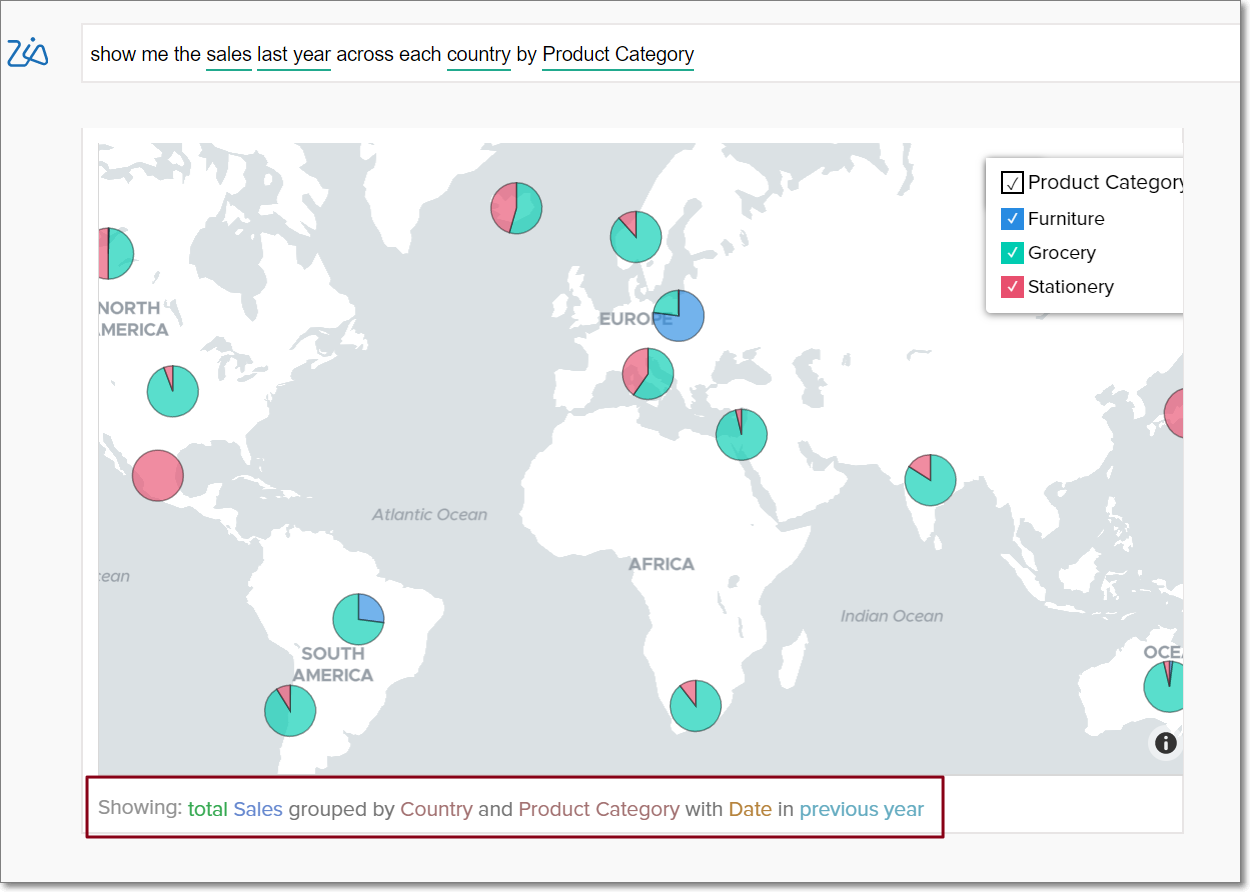
This description tells you how the data is grouped, the aggregate column used, the functions applied over them and the filters used. The following color classification is used in the description:
Blue - The metric columns used in the report.
Green - The functions applied to the metric columns.
Brown - The columns used to group the data in the report.
Light green - The date functions used in the report.
Light brown - The columns used to filter the data in the report.
Sky blue - The values used to filter the data.
Pink - Specific values in columns that are removed from the report.
Purple - The values used to sort the report.
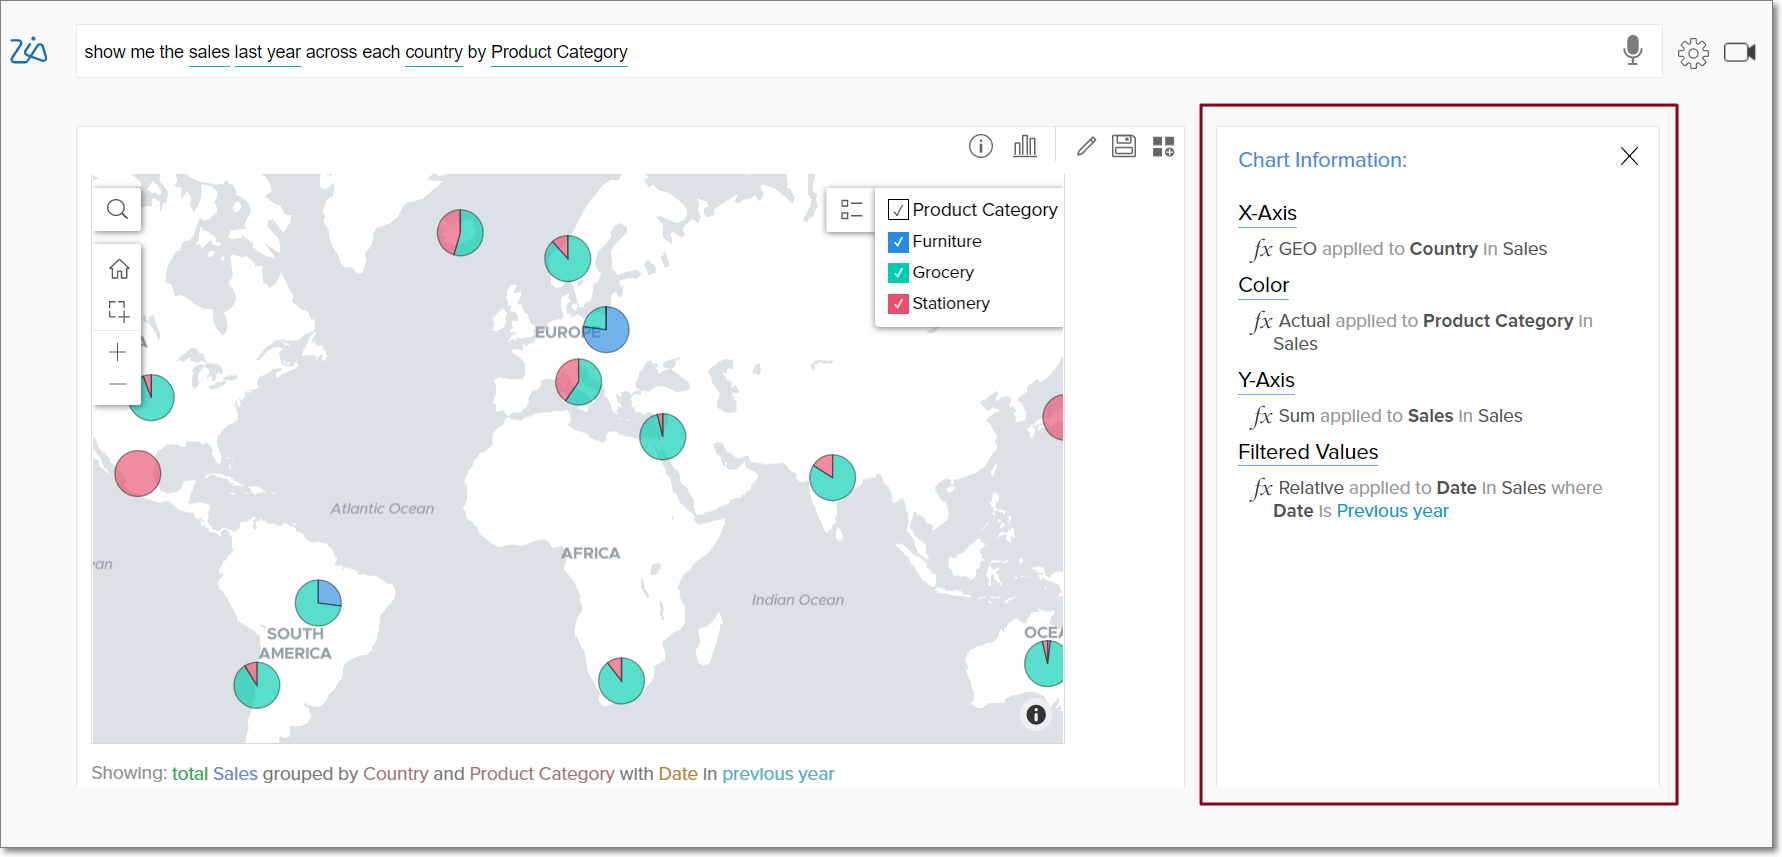
Report information
The report information section lists the report details in depth, and will be displayed next to each generated report. For charts, it displays the columns in the X and Y axes, the column used in the color shelf, the functions applied over each column and the filters used in the report. In case of pivot views, the columns used in the row, column, and data shelves are listed.
Modifying the generated report
The following are the diferent ways to modify the report generated by Ask Zia to fit your exact requirements.
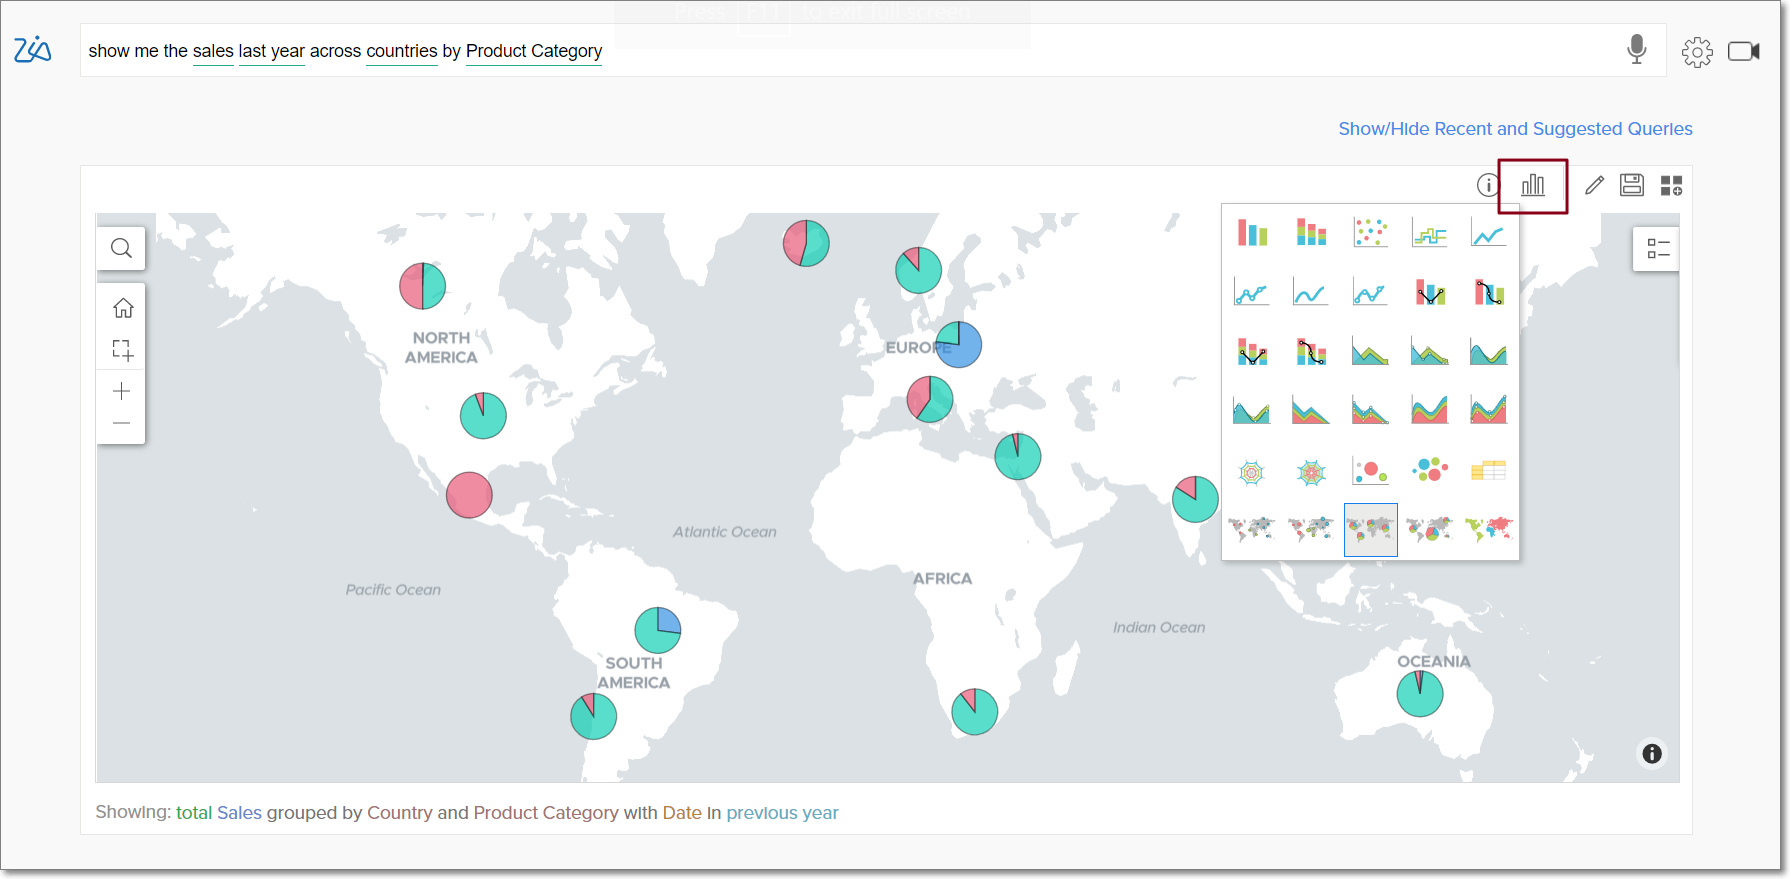
Changing the chart type
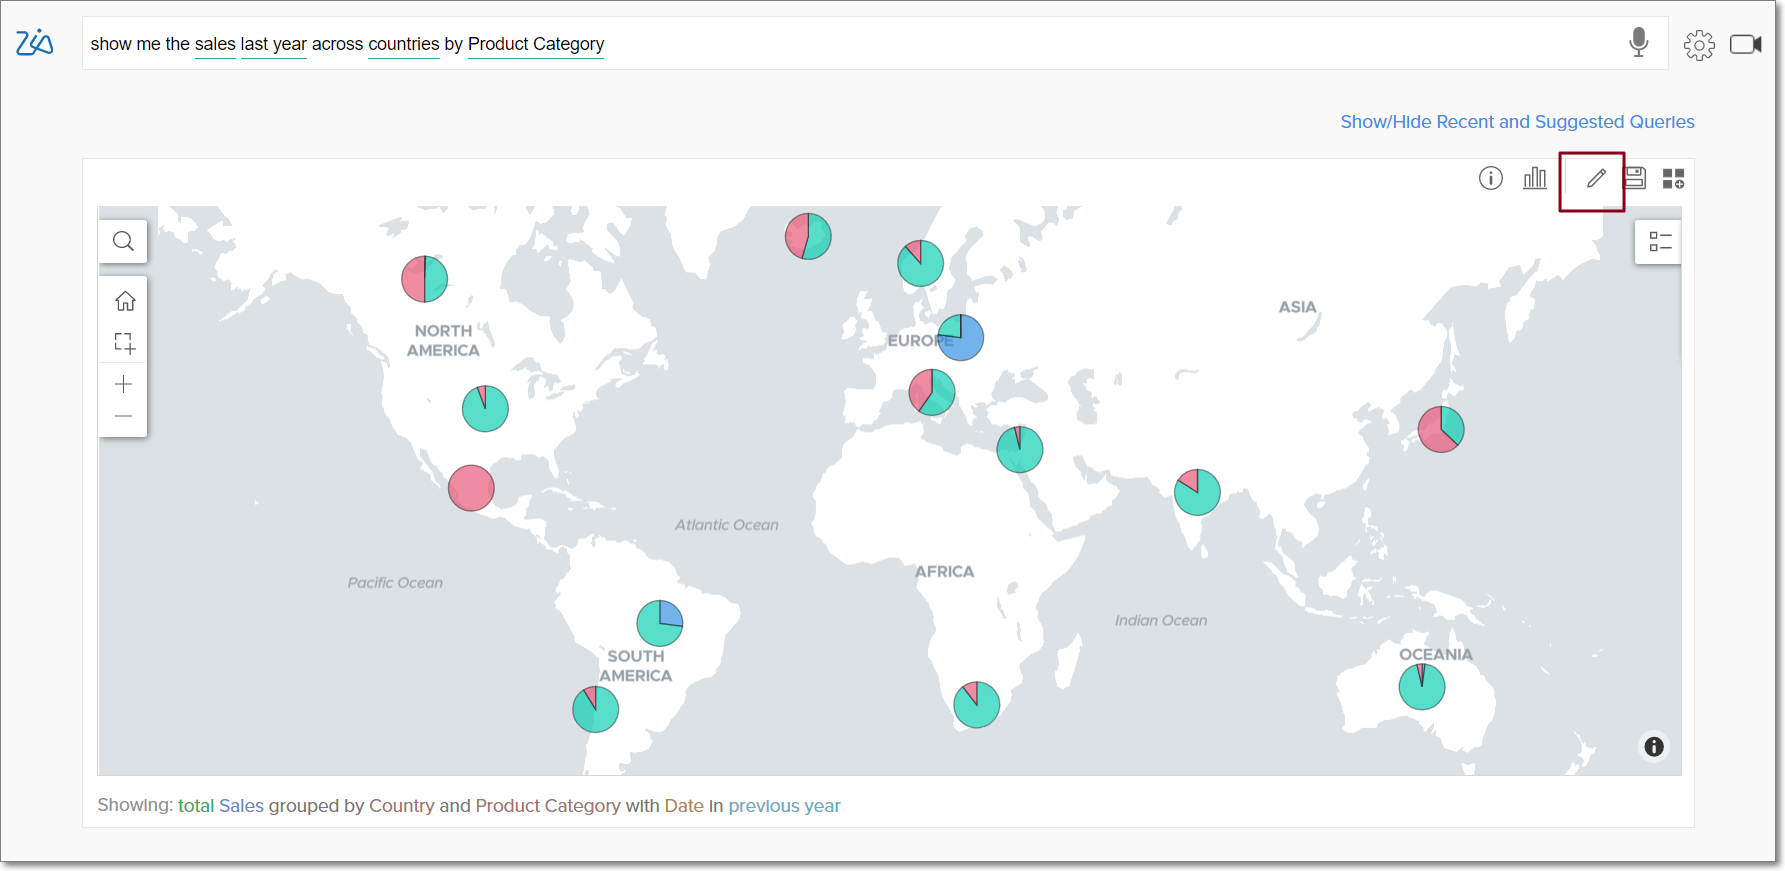
You can change the chart type of the generated report by clicking the Chart iconfound in the top right corner of the preview section.
Editing the report
To edit the data used in the generated report, click the Edit icon. This opens the Report Editor, where you can modify the report as needed.
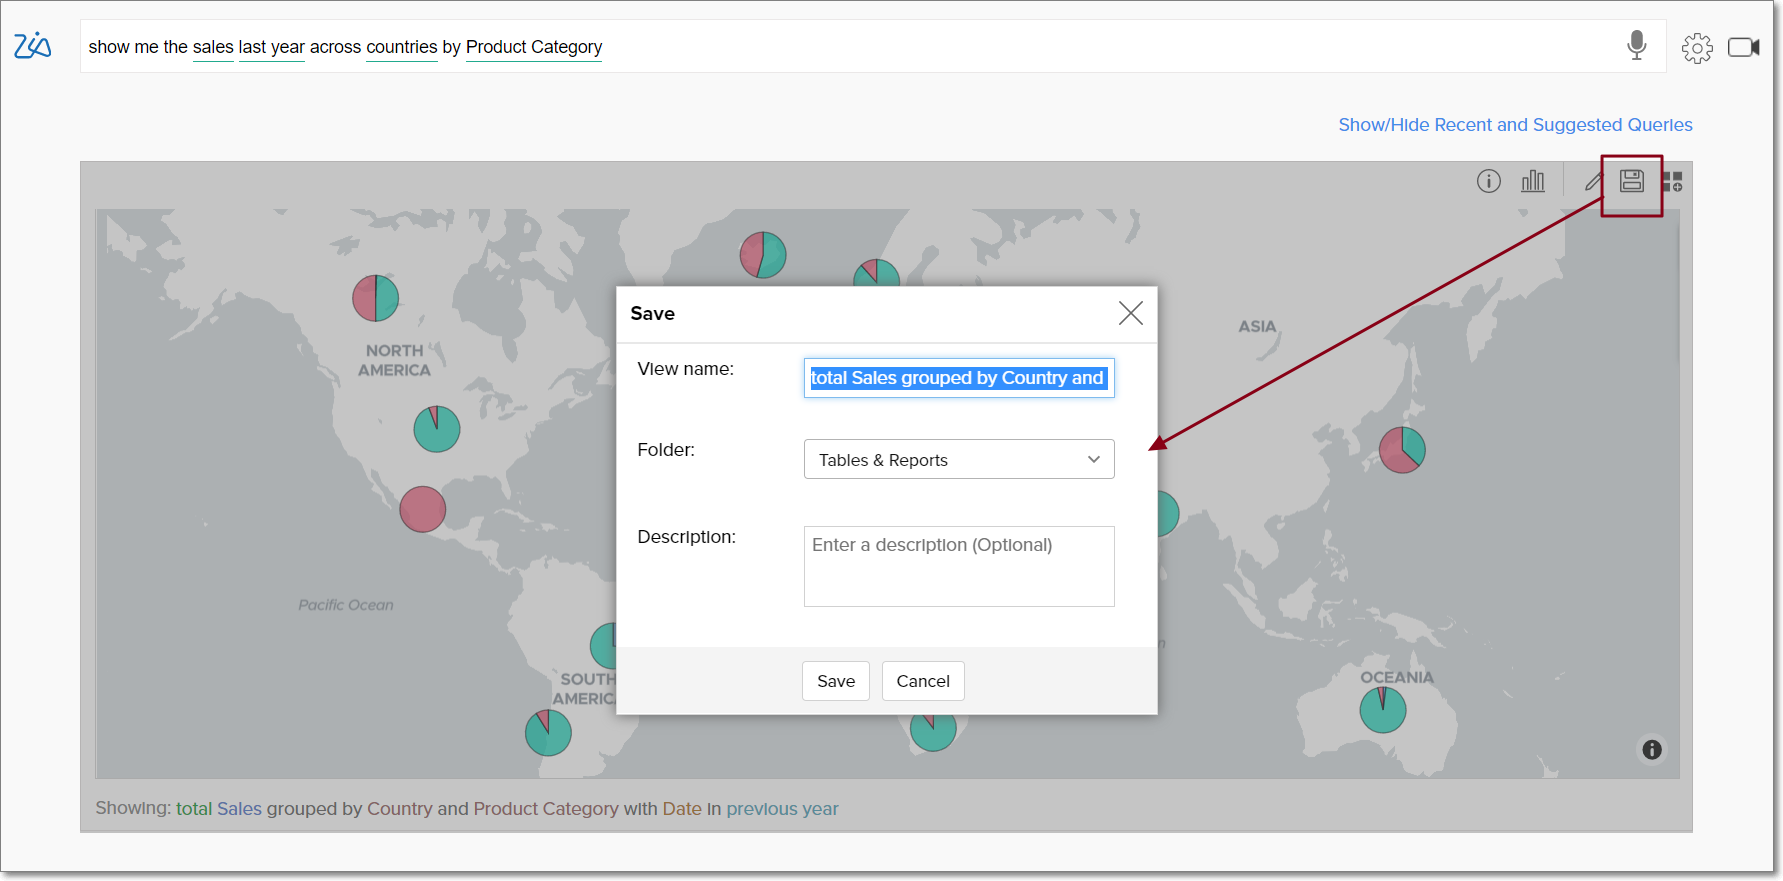
Saving the report
To save the report generated by Ask Zia, click the Save button in the top right corner. In the dialog that opens, specify the view name, folder and description, and click Save.
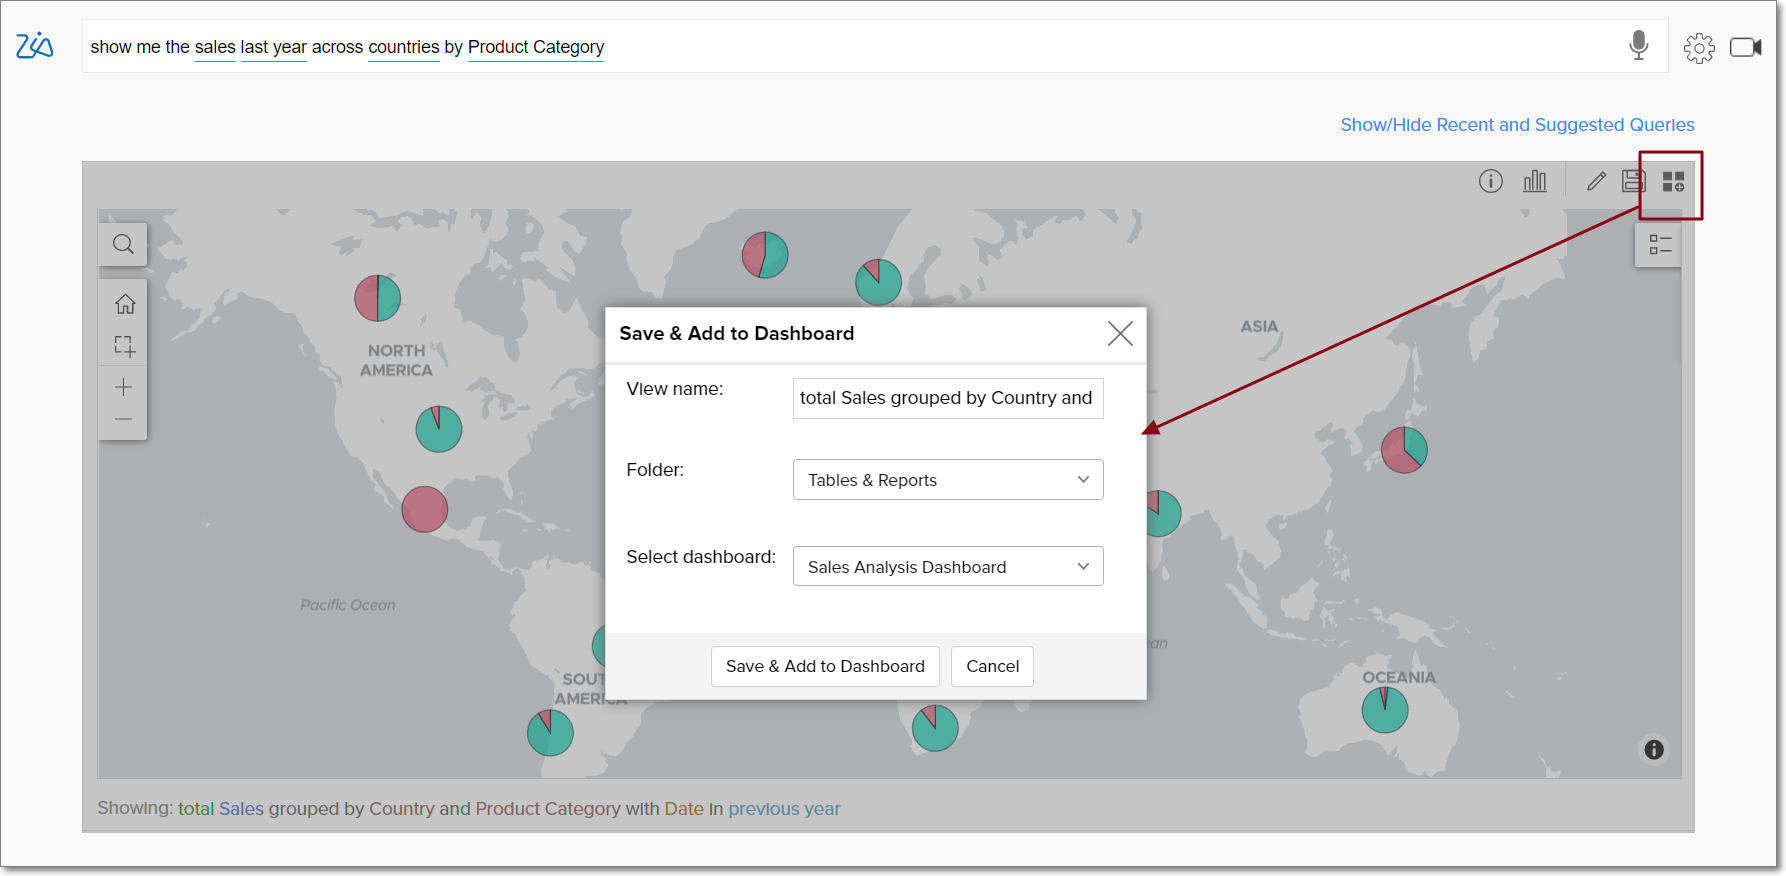
Adding the report to a dashboard
To add the generated report to the relevant dashboards, click the Add to Dashboard icon. Specify the view name, select the required folder and dashboard, and click Save & Add to dashboard.
Note: Ask Zia and Zia Insights capabilities are developed in-house and is proprietary to Zoho Corporation. Analytics Plus does not rely on or use external LLMs or AI tools such as Open AI to facilitate these features.

