3 ways ManageEngine leverages the power of predictive analytics in IT
June 30 · 07 min read

Picture this: you have a board meeting at 9:30 in the morning followed by a conference call with international clients. You know board meetings tend to run late because you've attended millions of them before. Accordingly, you schedule the call at noon, giving yourself time in between. You just predicted an outcome based on past data. That's what predictive analysis does on a larger scale.
Traditional IT operations follow a reactive, fix-problems-as-they-occur approach. Predictive analytics is a game changer for IT admins. It is a branch of AI that uses historical data, statistics, and algorithms to predict future outcomes and turns these predictions into actionable insights to handle operations proactively.
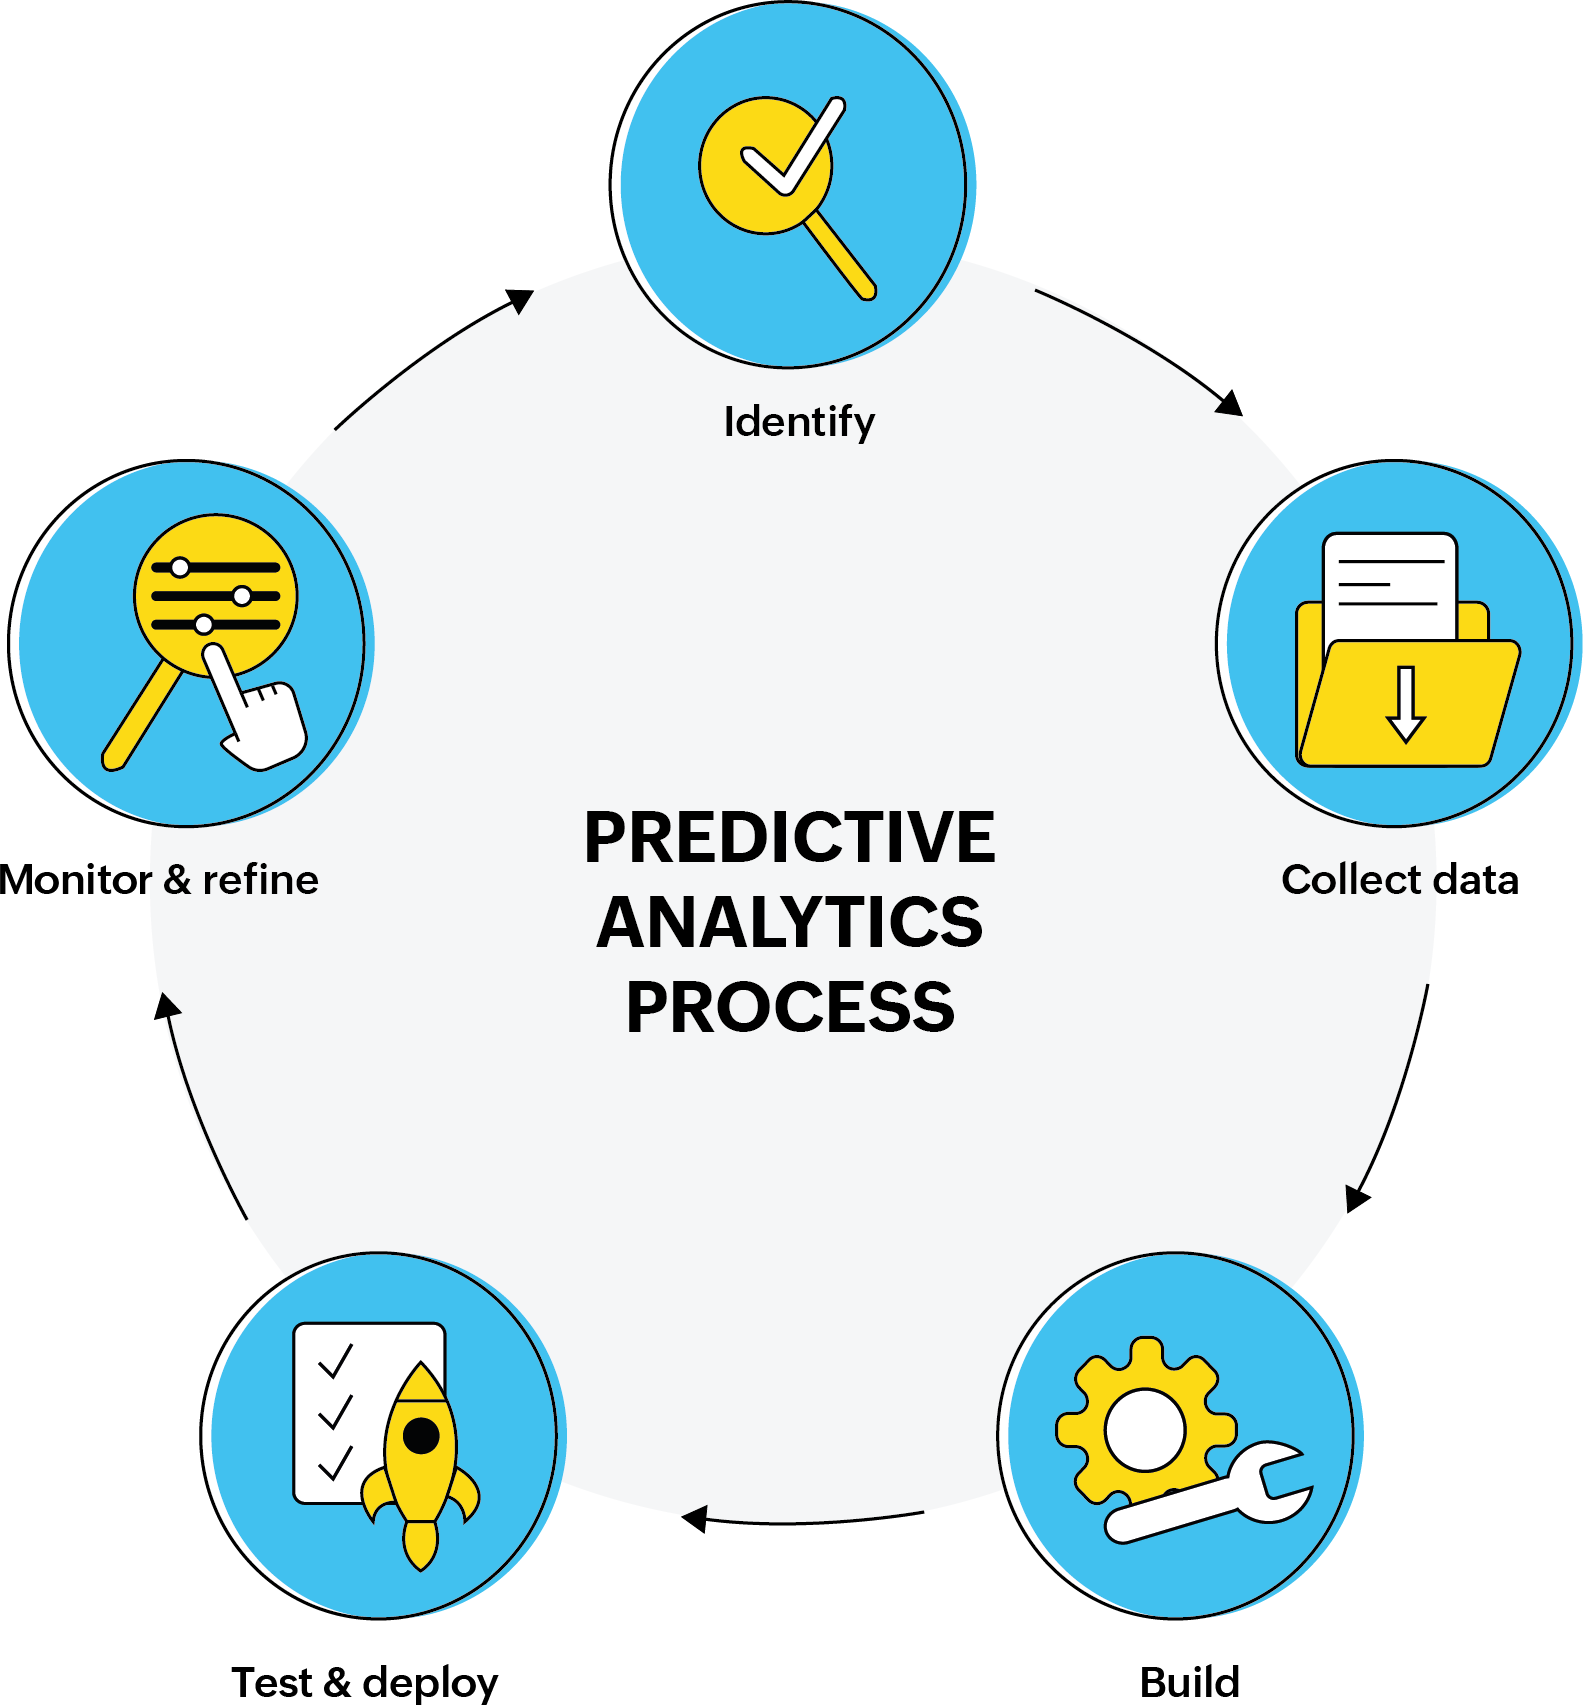
Predictive analytics framework

A simplified predictive analytics framework
Identify
Define the scope of your model. What problem are you trying to solve? Who is your audience?
For example, a few of our technicians couldn't meet their SLAs for this quarter, and we wanted to understand why. We identify the scope of this issue by answering these questions:
What happened?
Technicians couldn't resolve all the tickets assigned to them.
Why did it happen?
Some technicians were allotted more tickets than others. Every week they faced more complicated issues, unlike the rest of the technicians.
What will happen next?
23% of the tickets will be allotted to the next quarter. End users will be unsatisfied with the delay.
What do we do?
We must figure out the reason for the disproportionate allocation and the complications in tickets.
Collect data
We collect data from various sources for analysis comprised of historical and real-time data. In this scenario, we retrieve technicians' past data, including:
- The pattern of allocation of tickets in the past.
- The technicians' SLAs in previous quarters.
- The nature and complexity of tickets they handled before.
- Their current approach to complex tickets.
Data in the first three categories is structured: historical data is available in our database. Data in the last category, on the other hand, is unstructured. We collect both structured and unstructured data to improve our analysis.
Build
There are dozens of predictive models that you can tailor to meet the specific needs of each IT problem. Regression is the most commonly used model for statistical analysis and forecasting. It estimates the relationship between two factors. For example, is there a relationship between SLAs and the number of software installation requests over the last two years? If there is, we act on it suitably.
Simple methods, like the straight-line method, can be used for forecasting. For instance, how many tickets can the night shift face in the third quarter of 2022? A simple formula with past data applied will tell you that.
Test and deploy
Validate your model. In our advanced analytics tool, we verify the accuracy of predictions using hindcasting. It is a type of backtesting that uses prediction results to estimate past data points and verify them with actual historical data. Once the verification is complete, the forecasting engine displays the data points.
In the previous example using linear regression, we derived a formula that establishes the relationship between SLAs and the number of software installation requests. We validate this formula by taking historical data from 2017 to see if that formula is accurate enough.
Monitor and refine
A common misconception about these models is that you can use them without making changes. There are multiple variables in real life that affect outcomes. You can switch models if you find one that better suits your needs. In the previous example, we might find that a linear regression model with just one variable (number of software installation requests) isn't suitable to predict SLAs. So, we could refine it by using multiple regression: Say, add a few more variables like hardware requests, the shifts that technicians were working on, their experience, etc.
Let's look at three scenarios where we use predictive analytics to transform our ITops.
Scenario 1: Forecasting the number of service requests
This scenario is an extension of our previous example. Suppose the number of service requests we receive has increased due to increased hiring; the number of requests for our IT team will only increase as we add more devices to our network and expand our data centers. We must proportionately expand the size of our IT team while providing them with more solutions. In addition, we also want our technicians to have a better understanding of our service request system and improve their performance.
If we could forecast the number of tickets we'll receive over the next few quarters, we'd be able to expand our IT team accordingly.
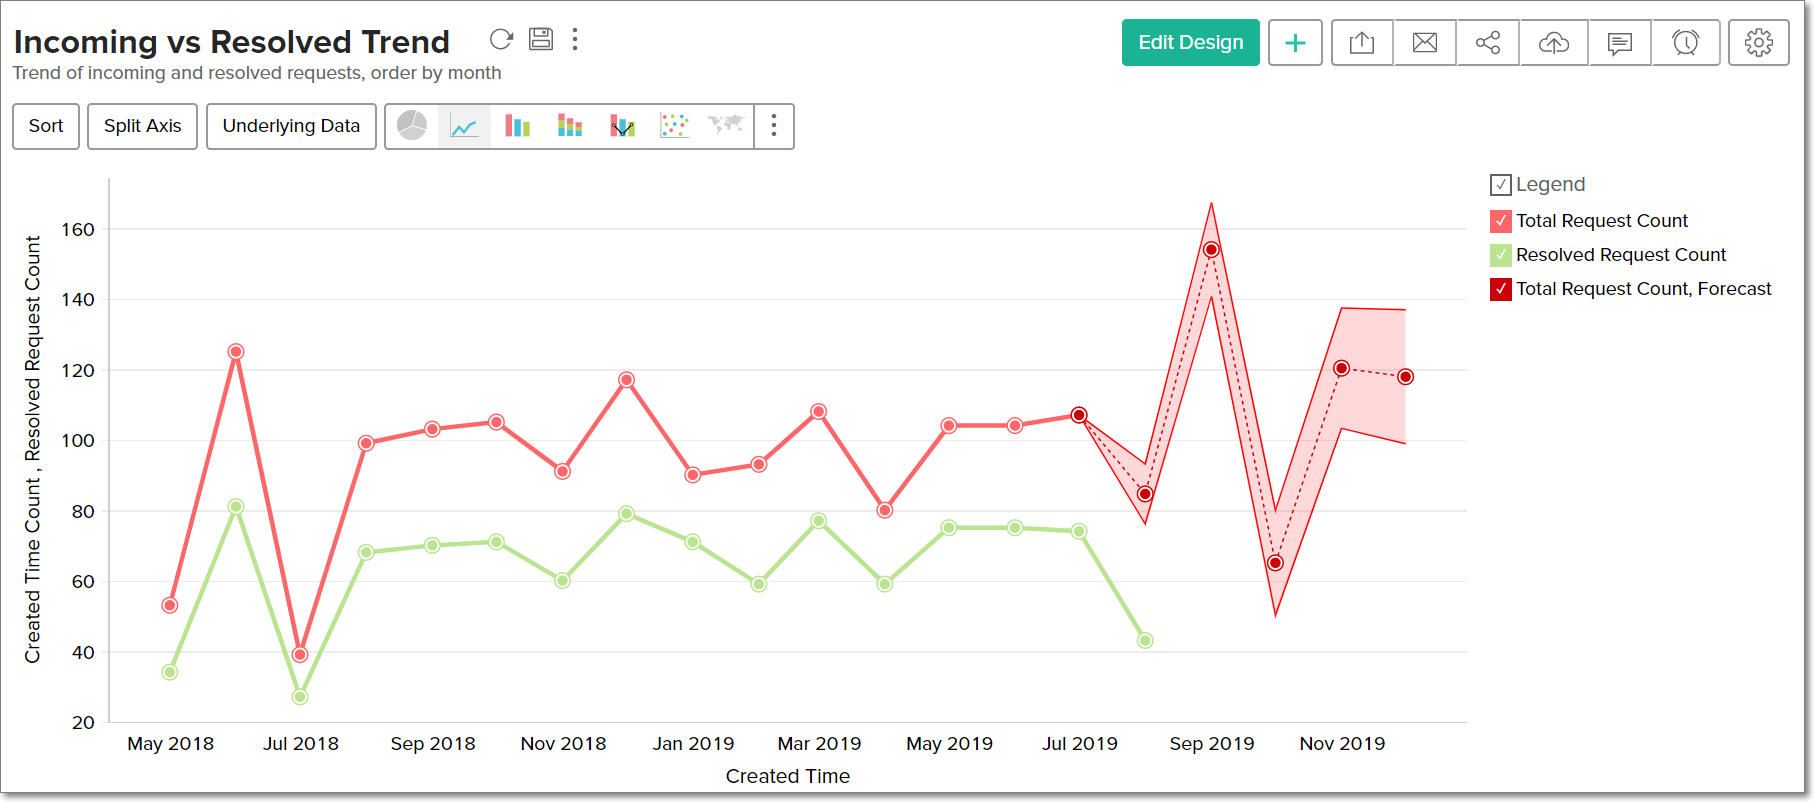
Below is a line graph plotted between the number of tickets created and resolved against the time of creation.

When combined with other methods of analysis, it allows us to answer questions like:
- When do we usually see an increase in tickets?
- Why do we see this increase?
- What trend can we expect over the next few months?
- How do we bring the numbers down?
- How can we prepare for the next peak?
Answering these questions helps us forecast and prepare for the next spike. In this case, the data collected could be the list of technicians, the number of requests, and the number of tickets resolved each month. There are also other parameters we use and correlate those with this trend.
Scenario 2: Detecting anomalies
An anomaly is when a particular aspect of business deviates from the expected trends. Anomaly detection is a method to spot an unusual point from a given data set. We use this technique in many instances:
- Point anomalies: This is when a unique instance is far off from the rest. For example, if the traffic from a particular IP address is unusually high during an afternoon, the analytics tools will alert our network operations team. The team will examine this data point (high traffic at 3pm) and determine whether they need to employ a new firewall rule or notify the user about the anomaly and let them take action.
- Contextual anomalies: This is when the abnormality is peculiar in a specific context. We need accurate time-series data (collection of data points over time) to detect these anomalies.
- Consider a load balancer dashboard that detects an unusual load from a particular server in a region during a national holiday. Increased load on other days is acceptable, but it could suggest something else, like an attack, on a public holiday. Detecting this anomaly helps us prepare for a possible attack.
- Collective anomalies: A set of occurrences collectively help us determine an anomaly. For example, if employees working on a suite of products are repeatedly requesting access to production data, it could indicate a potential incident. Our IT team spots this anomaly and analyzes further to prevent the possibility of an incident.
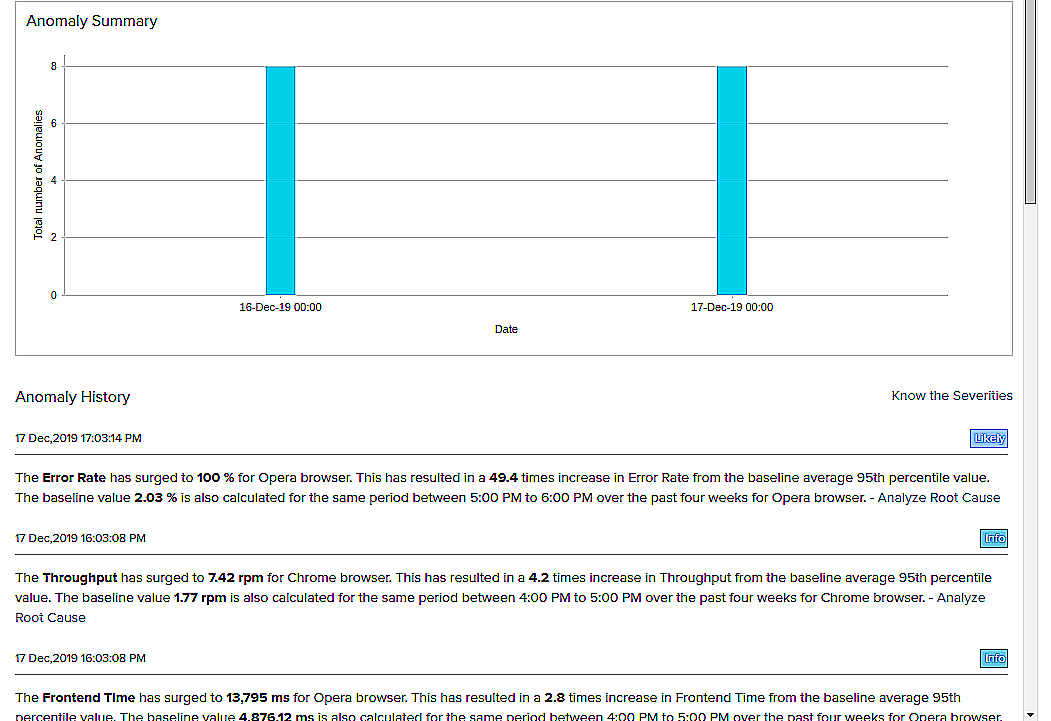
We also need to be aware of the total number of anomalies. For example, below is a summary of the total number of anomalies detected in browsers. If we notice an increase in anomalies over time, it could indicate a bigger problem. This analysis helps us spot it early and take necessary action.

Scenario 3: Monitoring asset utilization
As we add more customers, we must increase our capacity to process their data proportionately. We are constantly required to procure more servers so that our product teams can function optimally. For example, our IT team plans to add more servers to a particular data center. The IT team must prepare for a data center cage, arrange power supply solutions, create adequate physical space, etc. These processes take time, and if the IT team doesn't forecast early, the product teams may run into trouble.

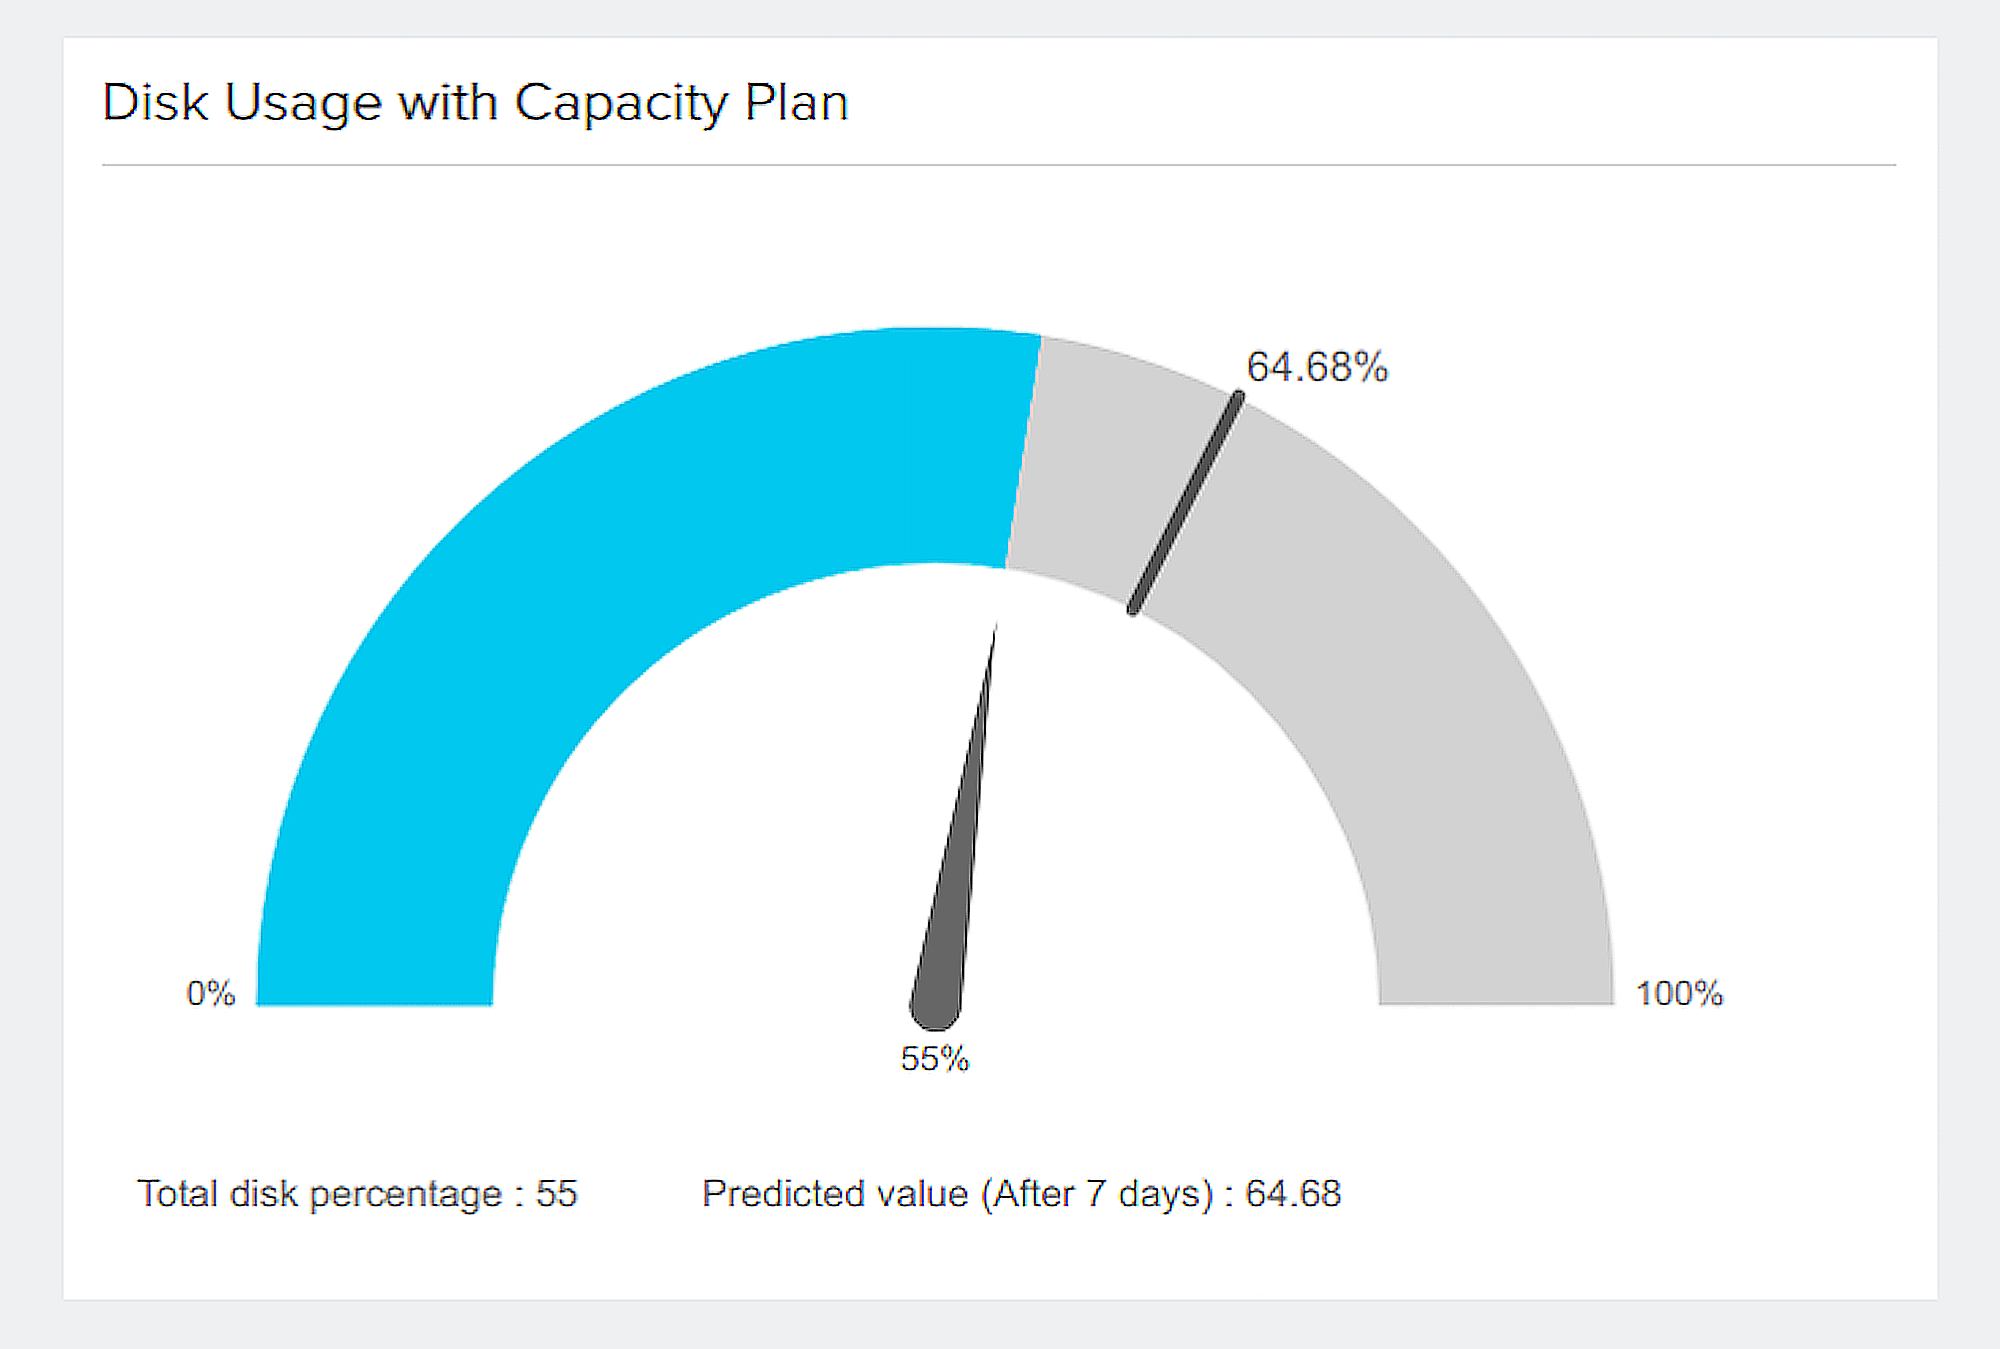
The IT team performs predictive analysis periodically to monitor asset utilization. When the disk usage reaches a specified threshold value, they plan to purchase new servers. They also maintain a percentage of free space on the servers to support product teams during emergencies.
Predictive analytics is a vast area to explore. ManageEngine leverages the power of predictive analytics when there is an opportunity; we use it in many scenarios that we are exploring every day. ZLabs, the AI research team at Zoho Corp., is currently working on incorporating predictive analysis into our help desk and website monitoring solutions.
