Nutanix Reports
OpManager’s Nutanix monitoring feature provides valuable insights into the performance and health of Nutanix clusters, nodes, and storage devices in your network. By leveraging the native Nutanix APIs, OpManager enables proactive monitoring of key metrics such as CPU usage, memory utilization, disk capacity, and more, ensuring optimal performance and uptime of your Nutanix environment.
To access this report, go to Reports → Nutanix.
The Nutanix Reports in OpManager offer detailed information on a wide range of performance and health metrics, including:
- CPU usage: Measures the processor utilization of Nutanix nodes, helping to ensure sufficient computational resources are available.
- Memory usage: Indicates the memory utilization on Nutanix nodes, essential for maintaining smooth operation and avoiding performance degradation.
- Disk capacity: Represents the storage capacity used and available on Nutanix devices, helping to prevent storage shortages.
- Cluster health: Monitors the overall health of Nutanix clusters, providing early warnings for potential failures or issues.
- Node health: Displays the status of each node in the Nutanix environment, ensuring all nodes are functioning properly.
By analyzing these metrics, network administrators can proactively monitor Nutanix performance, identify potential issues, and ensure the smooth operation of the entire Nutanix infrastructure.
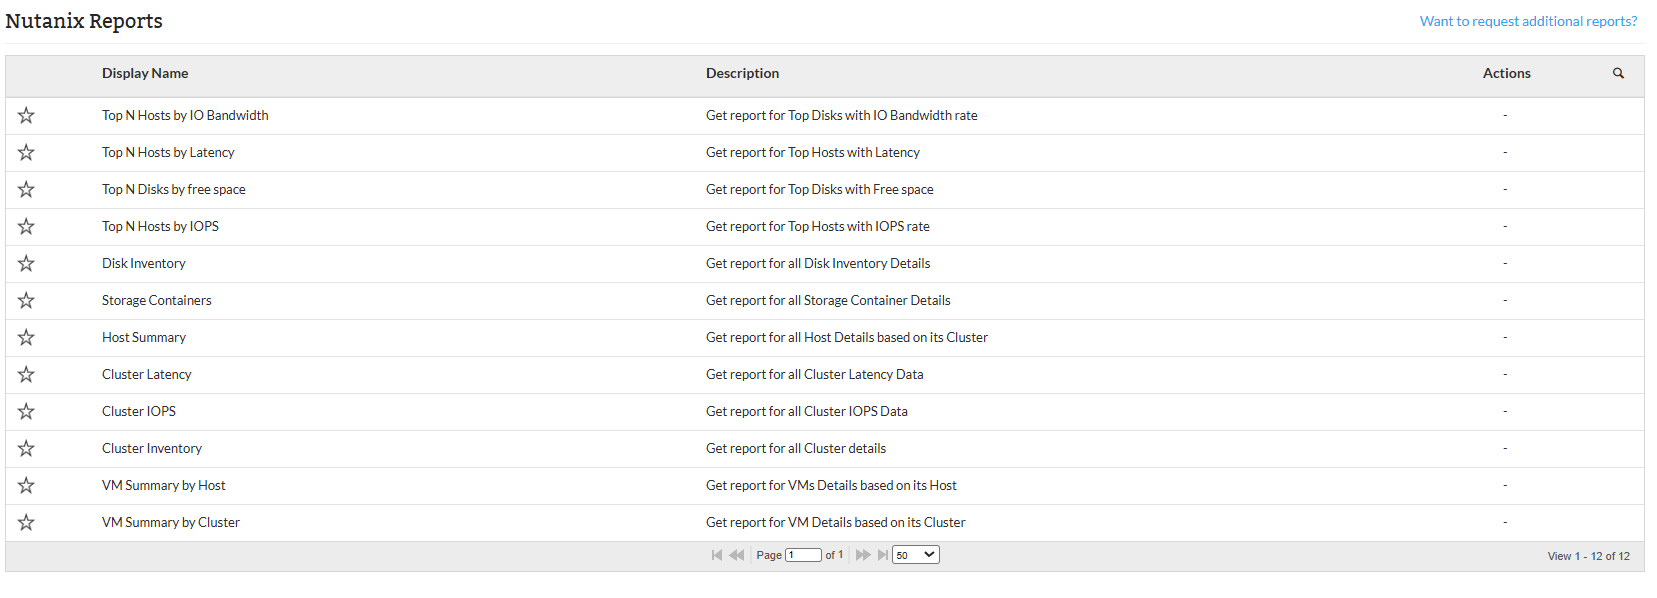
Available Nutanix Reports
Below are the default Nutanix Reports available in OpManager:
| Report Name | Description | Available Columns | Available Filters |
|---|---|---|---|
| Top N Hosts by IO Bandwidth | Lists hosts consuming the most I/O bandwidth, providing insights into the minimum, maximum, and average data transfer rates (in KBps). Helps identify high-bandwidth hosts for better network resource management. | HostName, IP Address, Min (KBps), Max (KBps), Avg (KBps) | Category, Filter by, Period, Time Window/Business Hour, View Records |
| Top N Hosts by Latency | Identifies hosts with the highest latency, showing minimum, maximum, and average latency (in microseconds). Helps pinpoint performance bottlenecks affecting network responsiveness. | HostName, IP Address, Min (microsec), Max (microsec), Avg (microsec) | Category, Filter by, Period, Time Window/Business Hour, View Records |
| Top N Disks by Free Space | Lists disks with the most free space, showing available capacity in GB and percentage. Helps identify least utilized disks for potential storage use. | Serial Number, MOUNTPATH, Free Memory (GB), Free (%) | View Records |
| Top N Hosts by IOPS | Identifies hosts with the highest Input/Output Operations Per Second, showing minimum, maximum, and average IOPS. Aids in understanding storage system performance and load balancing. | HostName, IP Address, Min (IOPS), Max (IOPS), Avg (IOPS) | Category, Filter by, Period, Time Window/Business Hour, View Records |
| Disk Inventory | Provides disk inventory details including status, host, IP address, tier, and usage in GB. Facilitates monitoring and management of disk space and performance. | Serial Number, Disk Status, Host Name, Host IP Address, Tier, Disk Usage (GB) | - |
| Storage Containers | Details storage containers in a cluster, including container name, cluster info, capacity, and configuration settings. Helps monitor storage container utilization and setup. | Container Name, Cluster Name, Cluster IP Address, Storage Capacity (GB), Erasure Coding, Replication Factor, Cache Deduplication | - |
| Host Summary | Summarizes key host metrics such as controller VM, hypervisor, VM count, storage and memory capacity, usage, and boot time. Useful for monitoring host health and resource utilization. | Host Name, IP Address, Controller VM, Hypervisor, VM Count, Storage Capacity (GB), Storage Used (%), Memory Capacity (GB), Boot Time | - |
| Cluster Latency | Provides latency details for a cluster with minimum, maximum, and average latency in microseconds. Helps monitor cluster communication performance and identify bottlenecks. | Cluster Name, IP Address, Min (microsec), Max (microsec), Avg (microsec) | Category, Filter by, Period, Time Window/Business Hour, View Records |
| Cluster IOPS | Shows IOPS details for a cluster, including minimum, maximum, and average values. Helps assess storage system performance and detect bottlenecks. | Cluster Name, IP Address, Min (IOPS), Max (IOPS), Avg (IOPS) | Category, Filter by, Period, Time Window/Business Hour, View Records |
| VM Summary by Host | Summarizes VMs on a specific host, detailing power state, memory and storage capacity, network adapters, and controller status. Assists in resource allocation and host load management. | VM Name, IP Address, Power State, Memory Capacity (GB), Memory Reserved (GB), Storage Capacity (GB), Network Adapter (Count), Is Controller | - |
| VM Summary by Cluster | Summarizes VMs in a cluster, including host details, power state, memory and storage capacity, network adapters, and controller status. Helps monitor resource distribution across the cluster. | VM Name, IP Address, Host Name, Power State, Memory Capacity (GB), Memory Reserved (GB), Storage Capacity (GB), Network Adapter (Count), Is Controller | - |
Users can export reports to PDF or Excel formats for easy sharing and documentation. Reports can also be scheduled for automated generation within defined business hours or time windows to facilitate routine monitoring.
For more information on discovering Nutanix monitors, refer here.
Click here to know more about other report types in OpManager.
To know more about the Available Filters in various reports of OpManager, Click here.