Home » Features » » Case studies » <a href="https://www.manageengine.com/products/desktop-central/customers-home.html">customers</a> <a href="https://www.manageengine.com/products/desktop-central/customers-stories.html">Case studies</a> <span class="title">WD-40 Case study</span>
Digital Employee Experience Management
Our unique value in enabling digital workplaces is simple. Endpoint Central already covers all endpoint needs, and the DEX Manager add-on extends its power with experience intelligence. Layered over deep asset visibility and UEM automation, it helps EUC teams detect and resolve experience issues faster—with zero extra setup.
EUC and digital workplace leaders lack the tools to monitor systemic issues. Problems persist, or only a subset get reported.
Reduced productivity
Employees waste time dealing with issues ineffectively or waiting for resolution via slow, costly help desk channels.
Overwhelmed help desks
IT help desks are overwhelmed by a barrage of tickets asking them to resolve chronic issues.
Solve DEX use cases across your EUC
Proactive visibility
Capture industry issues
Enhance IT efficiency with RCAs
Automate issue prevention
Optimize software licensing
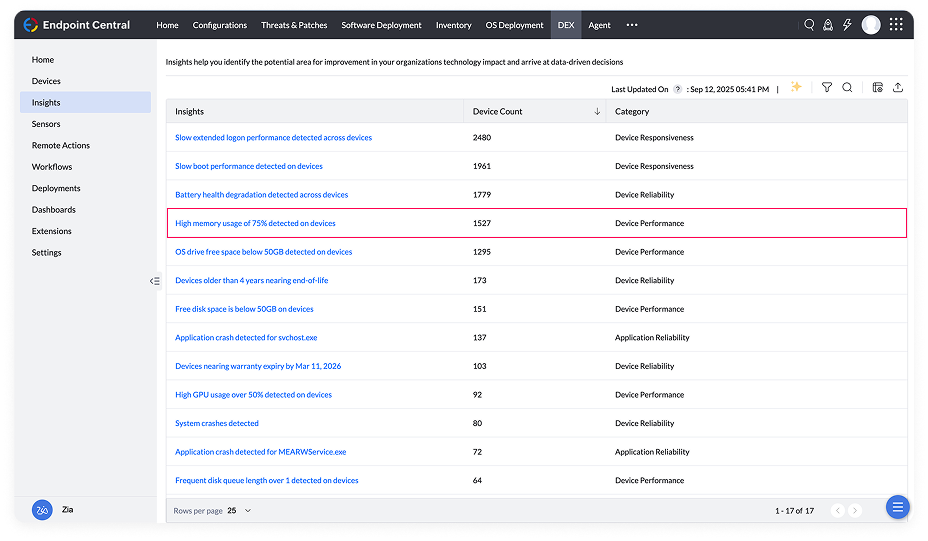
Continuous experience monitoring
Gather quantitative & qualitative data to surface actionable insights proactively about issues affecting device and app performance, before it reaches via slow helpdesk.
Deep Inventory Data
Device type & model
Hardware configurations (CPU, Memory)
OS & Apps
Device User Info
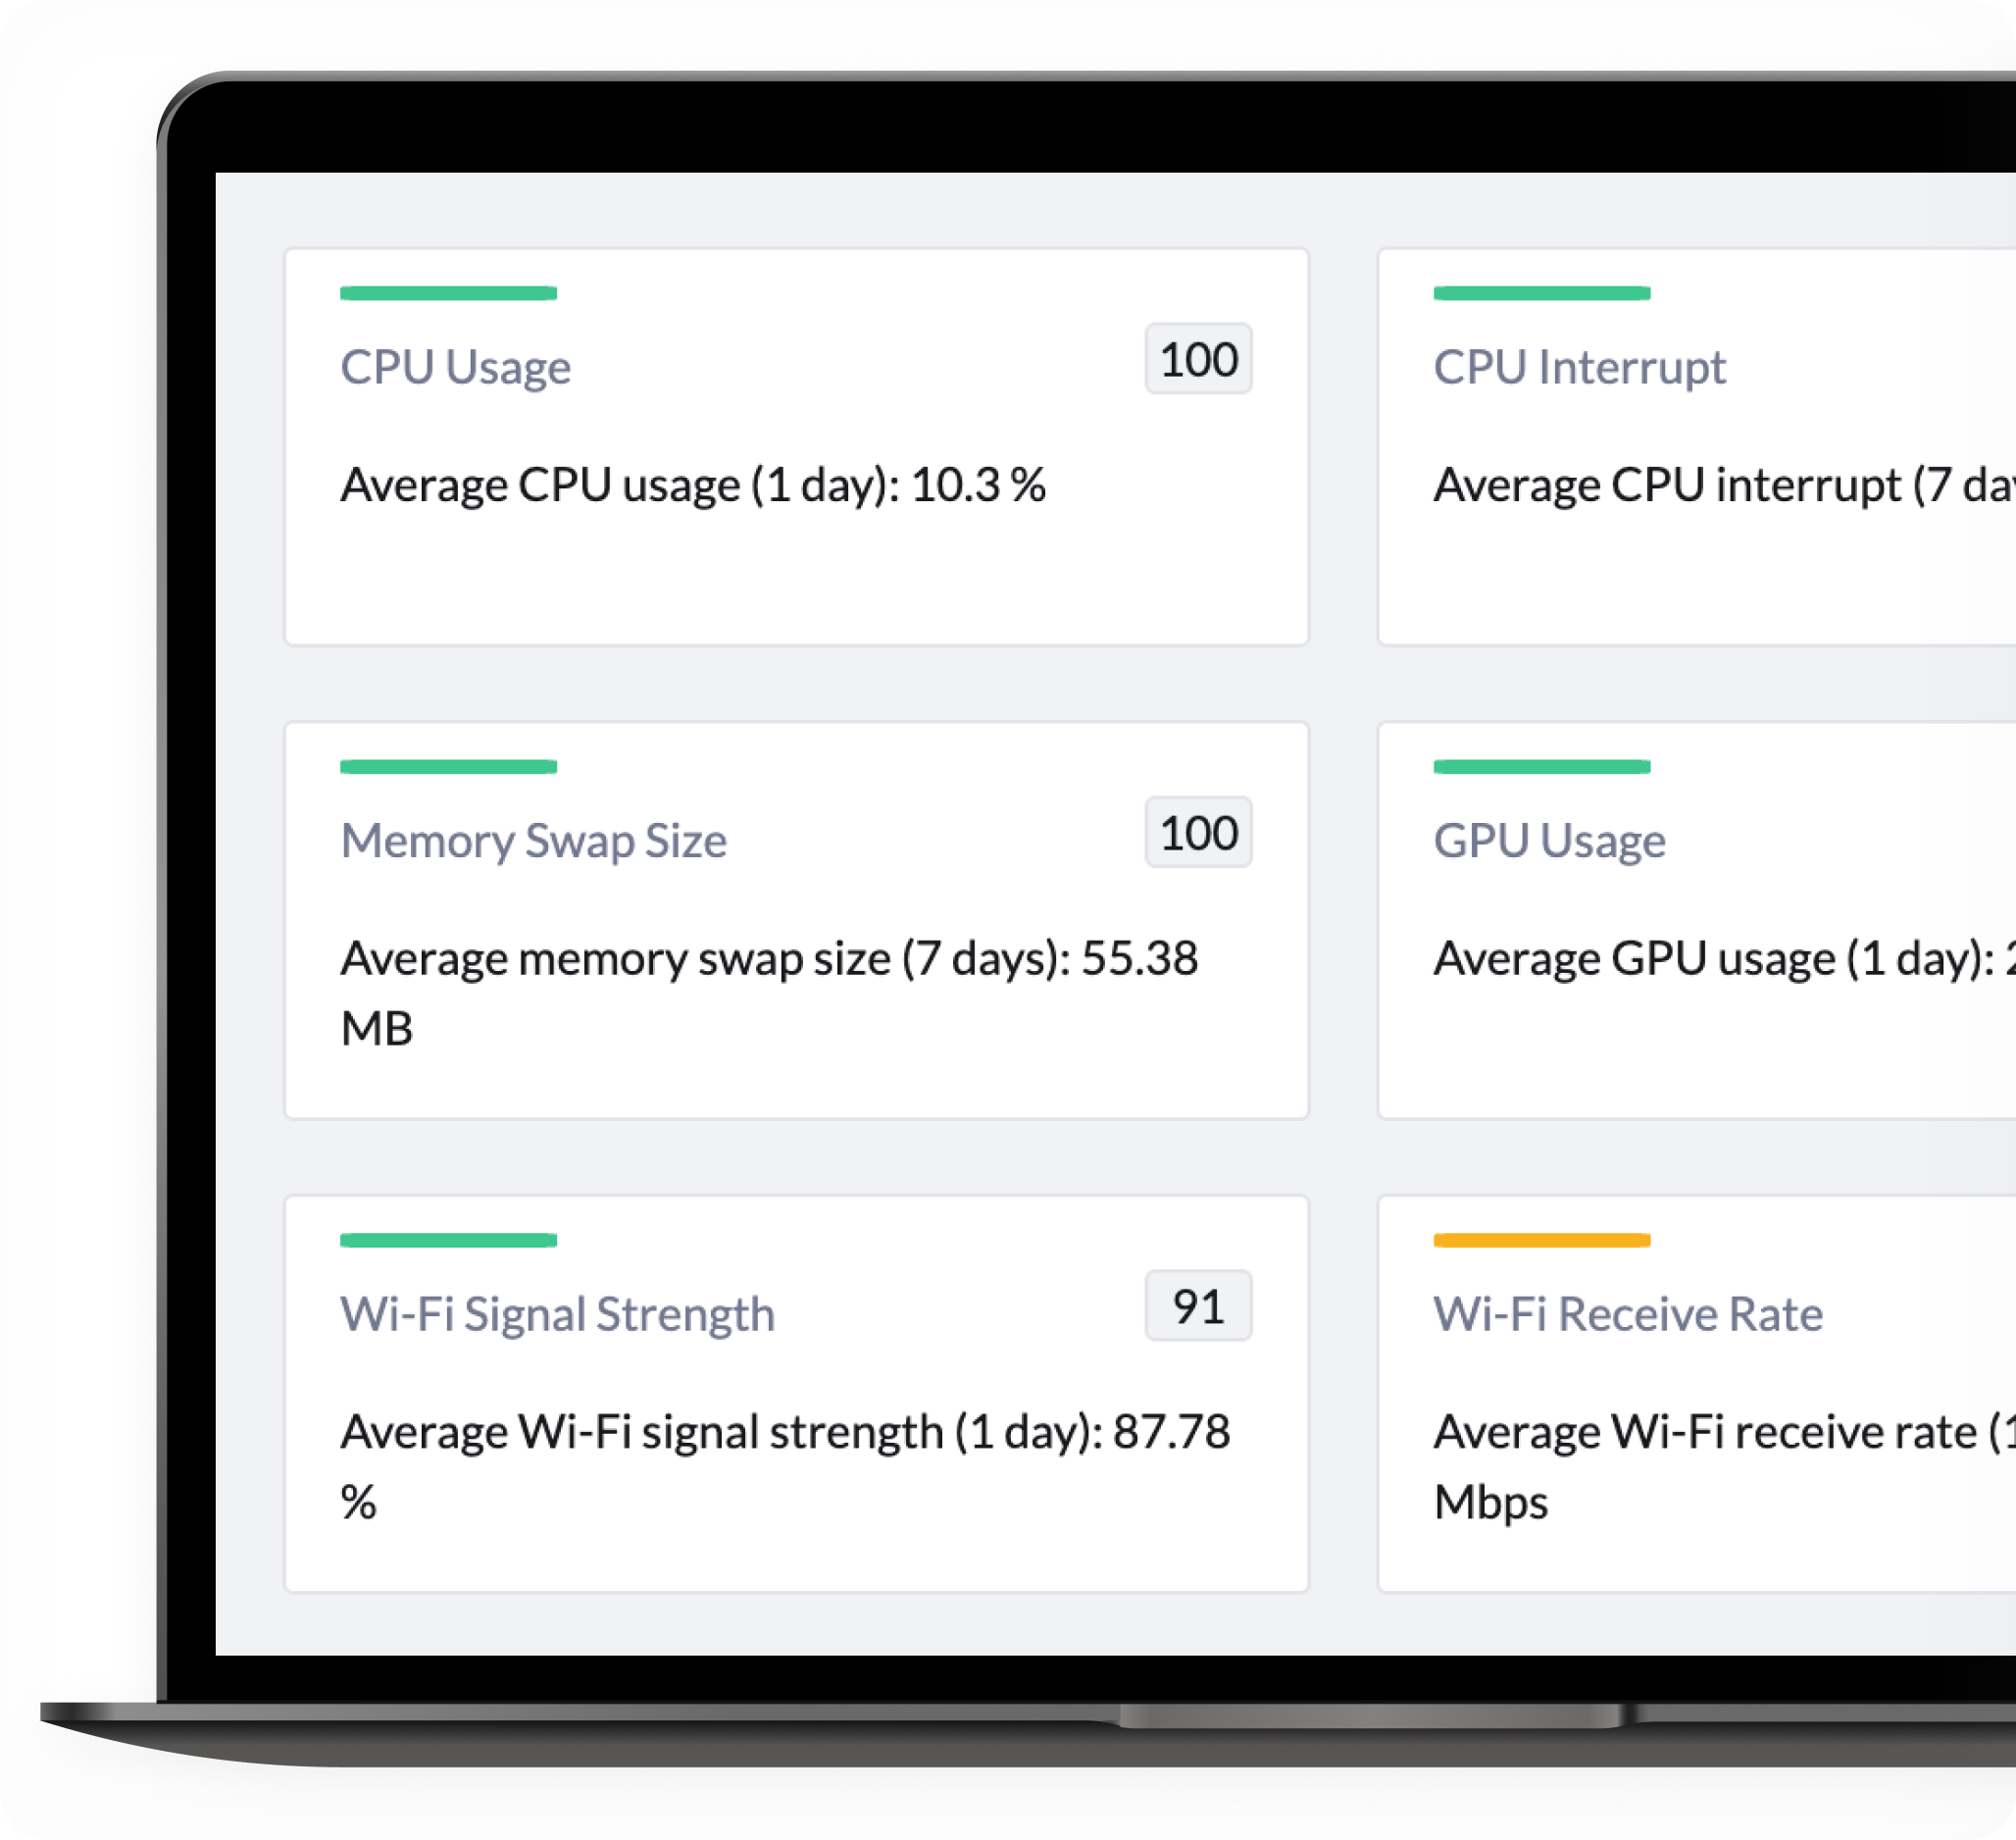
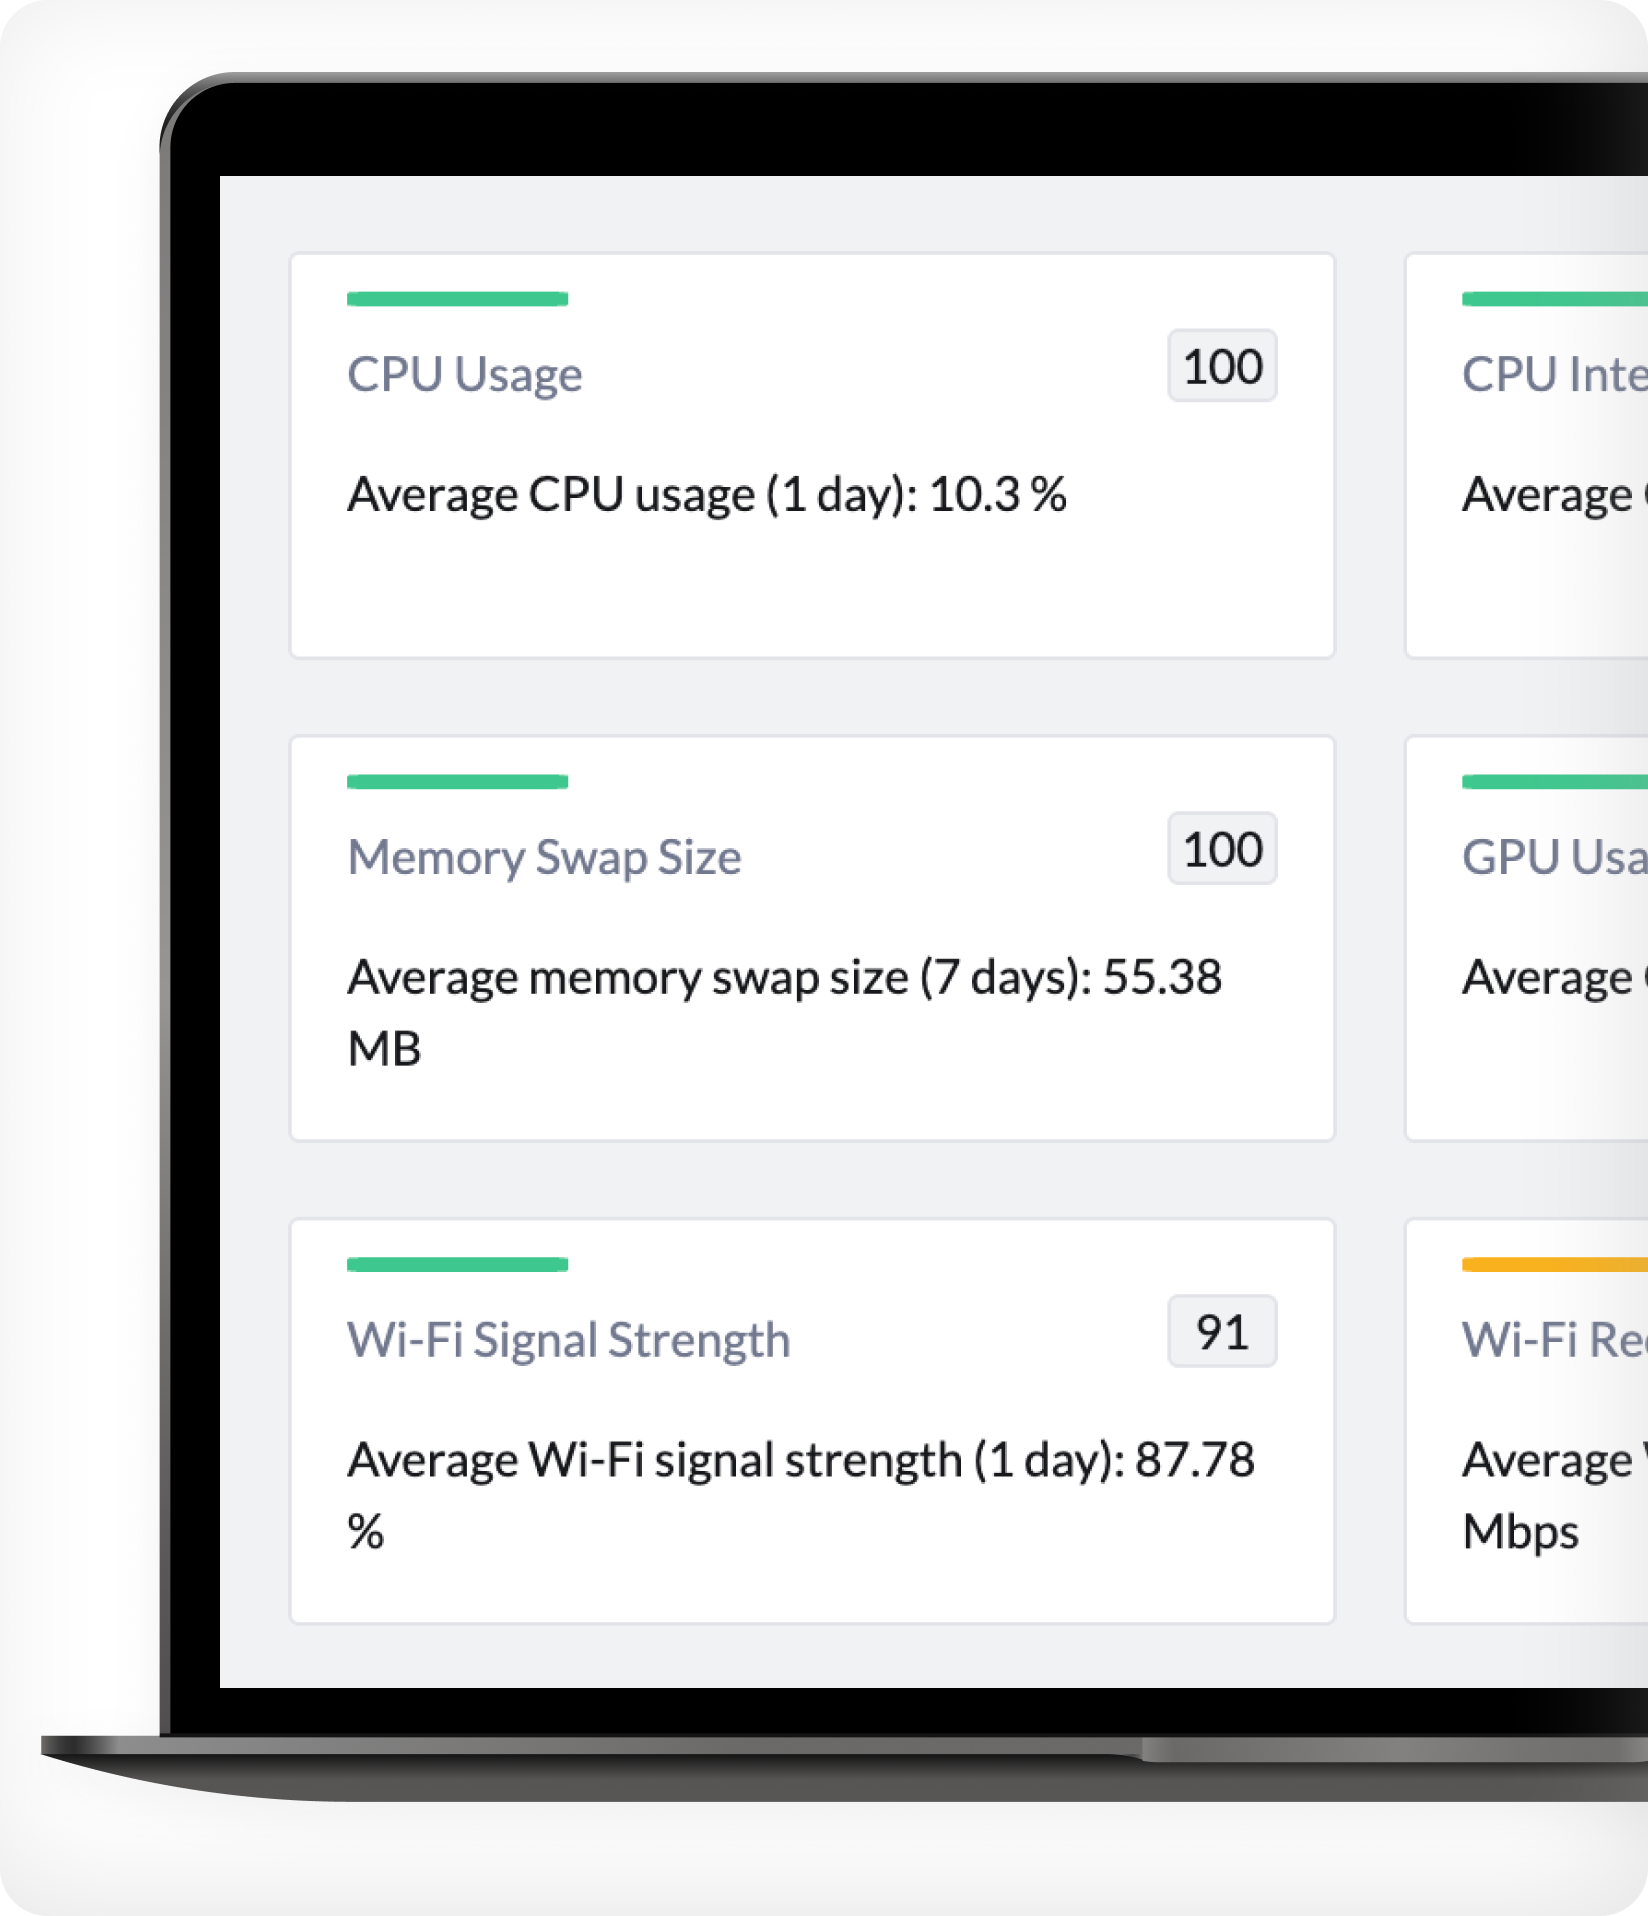
Endpoint Health Metrics
CPU Usage
Memory Usage
GPU Usage
Firewall status and more!
Driver Management
Scan for software drivers
Discover machines missing drivers
Deploy the relevant drivers to systems
Seamless connectivity with peripherals
Network Telemetry
Wi-Fi Signal Strength
Wi-Fi upload rates
Wi-Fi download rates
Network hardware bottlenecks
Employee sentiment
Beyond quantitative insights, gather subjective employee sentiment of the deployed apps and devices. This can be factored into experience scoring and insights.
Application Reliability
Application crash detected for specific applications
High Memory Usage detected on devices
CPU Interrupt above 2% detected on devices
Frequent disk queue length over 1 detected on devices
OS drive free space below 50GB detected on devices
Device Reliability
System crashes detected
Hard resets detected across devices
Devices nearing warranty expiry by specified date
Devices older than set expiry and nearing end-of-life
Battery health degradation detected across devices
Device Responsiveness
Slow extended logon performance detected across devices
Slow boot performance detected on devices
High user input delay is observed in more number of devices
High memory usage alert
Steve from IT Team receives an alert "High Memory usage of 75% detected on devices
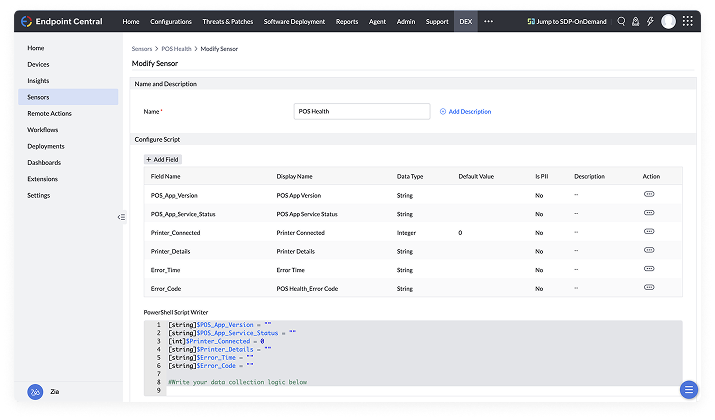
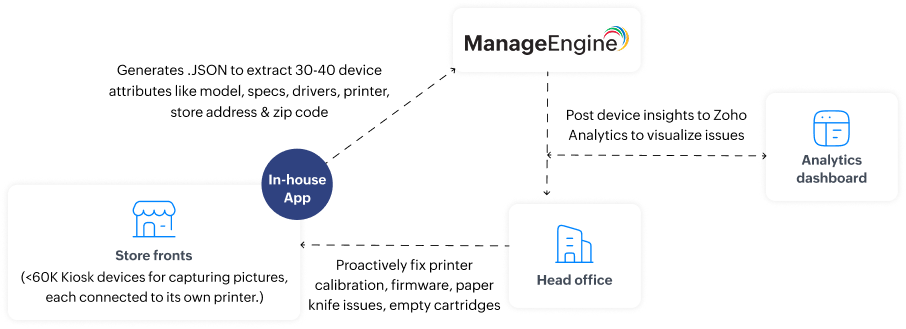
Build custom sensors to capture telemetry unique to your industry-specific processes from endpoints and peripherals connected to them (ex: barcode scanner, printer status/failures)
A leading global manufacturer focused on commercial print, uses ManageEngine to proactively monitor peripherals such as thermal and laser printers connected to self-service kiosks, using custom parameters to create alerts on issues across firmware, cartridge, callibration and printer jams!
End user raises a help desk ticket
e.g. Collaboration issue with Microsoft Teams being unstable
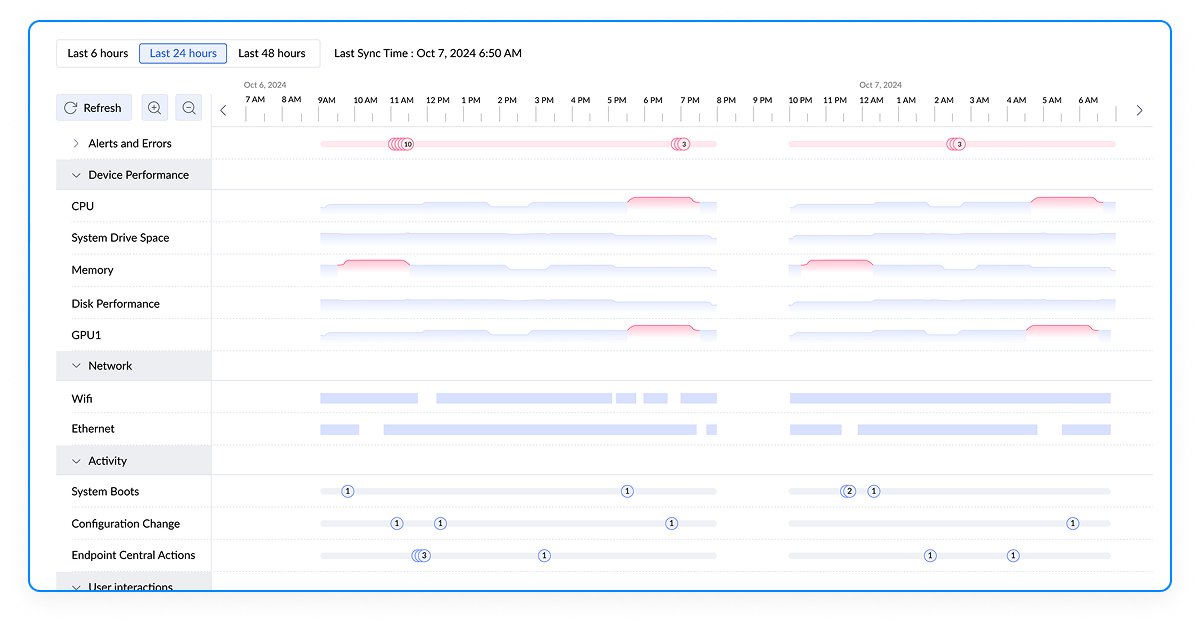
Device timeline view
View the timeline of events on the affected devices, investigate frequency of crash and drill down further to narrow down the root cause.
Experience dashboard
See the broader impact of the issue across other device cohorts or remote offices to address widespread issues before they occur.
Self healing automation
Use workflow orchestrator to self-heal identified issues to resolve repeatable issues at scale across your organization
Extensions
Publish created automations as extensions for other members in your team to resolve similar issues under their scope.
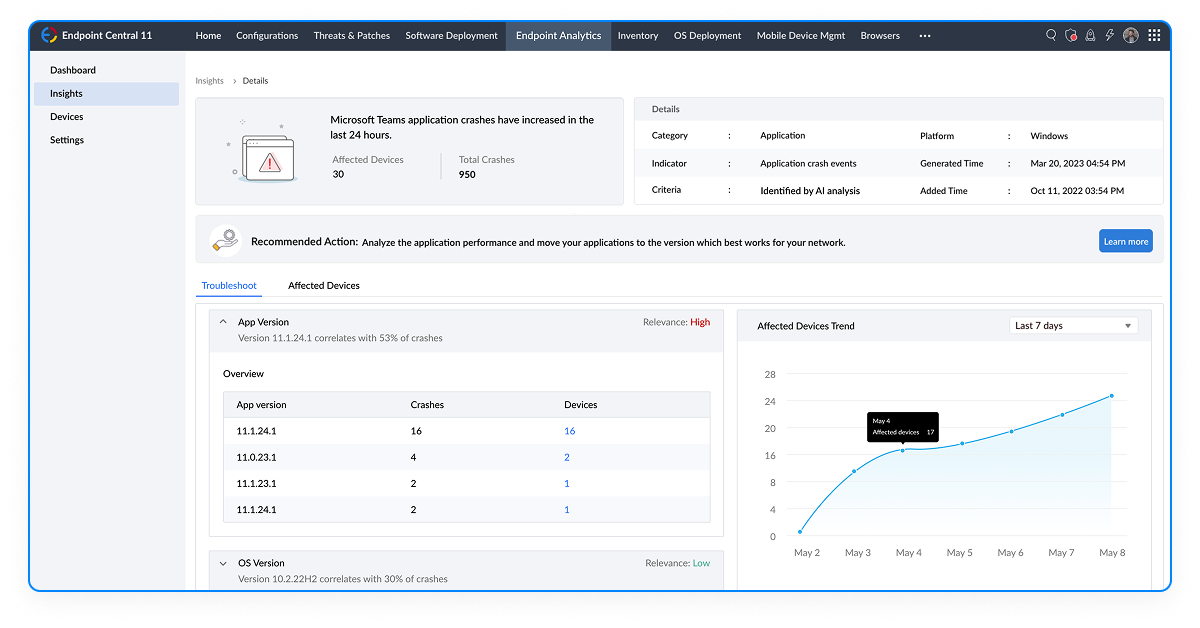
Device Timeline View
Narrow down the root cause of the issue raised in a ticket
The device timeline presents a historic view of issues that occurred in the device relative to a specific timeframe, For E.g. Microsoft Teams repeatedly crashed in the last 24 Hours.
Drill-down to understand device changes in the last 24 Hours- A flawed update for Microsoft Teams that led to instability in the application.
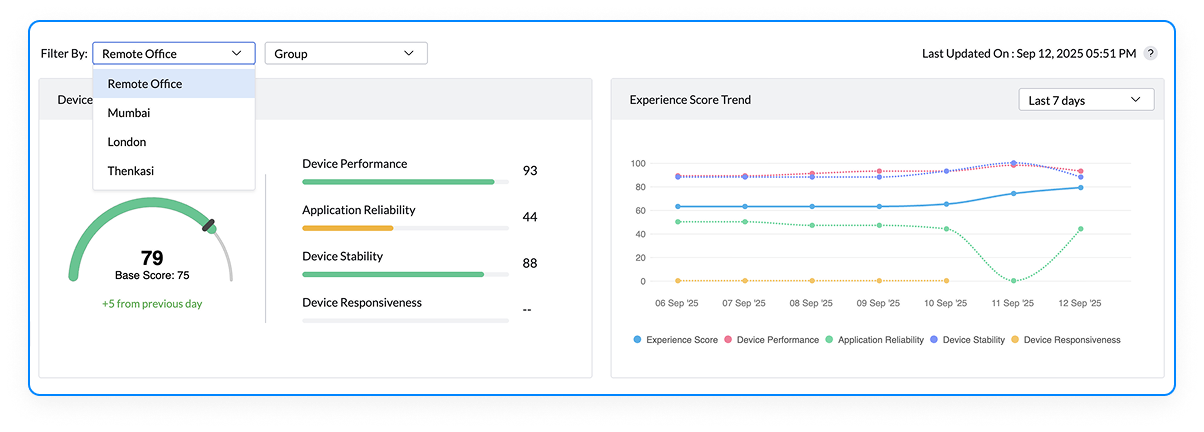
Experience Scores
See experience trends to understand if the impact is caused across app category on a broader scale, slice and dice based on based on custom cohorts and branch offices to check localised impact
Drill down to custom cohorts and remote offices to see localized impact
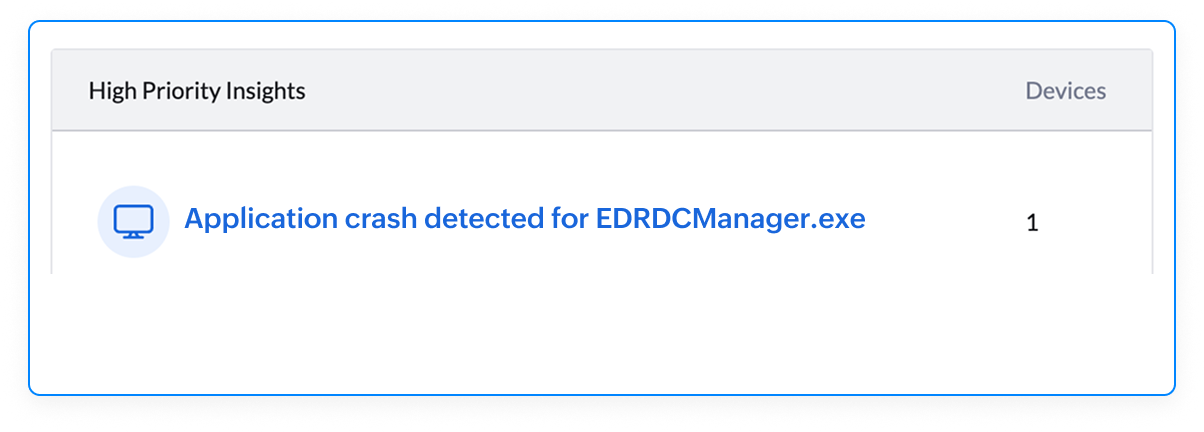
Receive high priority insights when significant devices are affected.
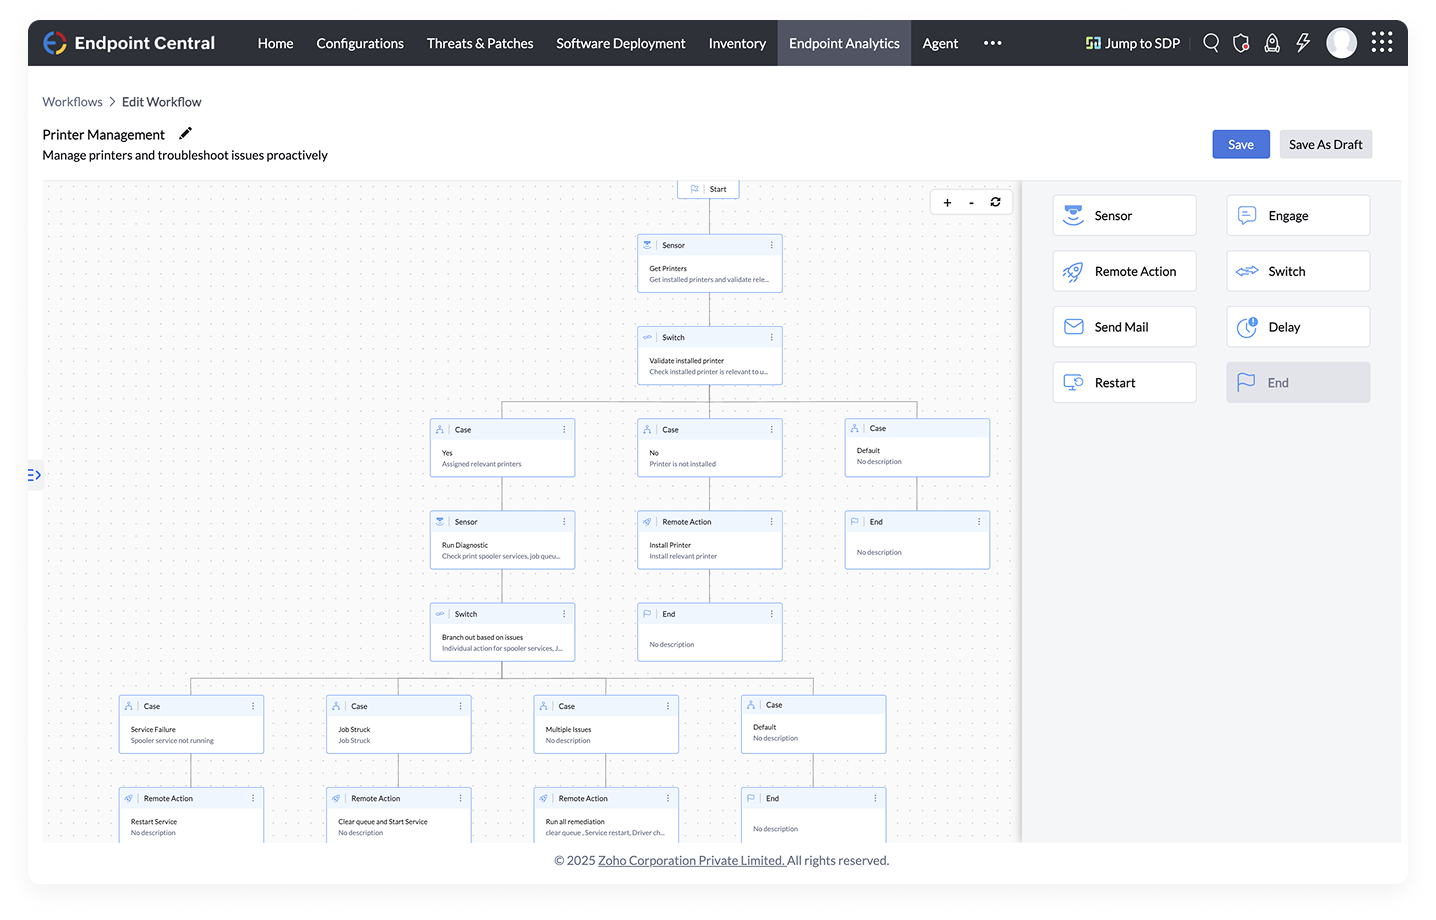
Self healing automation
Use the built-in workflow orchestrator to build automations to self-heal other devices where users have not reported similar issues, for Ex. printer malfunctions
Publish workflows to your team members to fix issues proactively for their scope of computers
Utilize extensions to accelerate the creation of workflows from our library of pre-built workflows
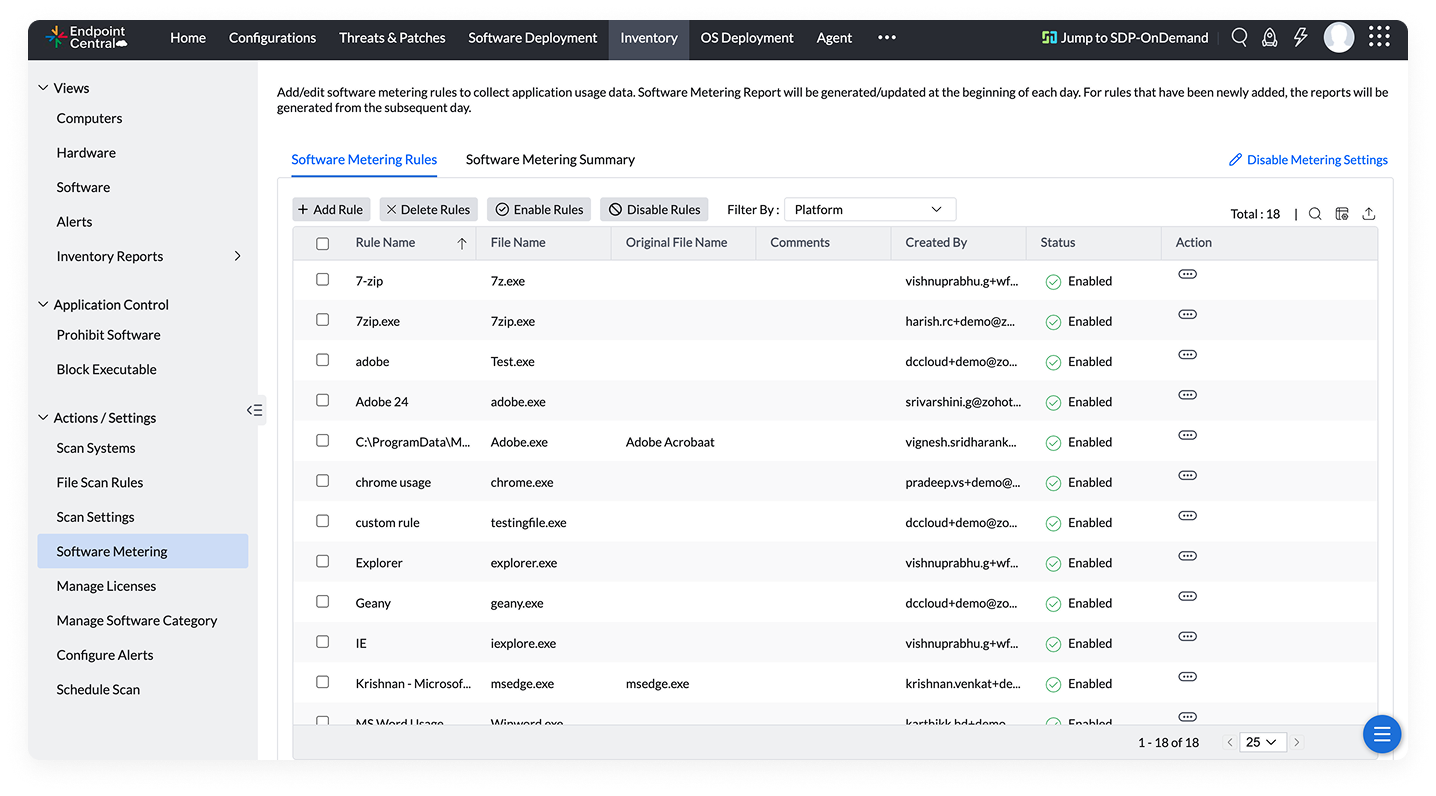
Track software Usage
Monitor usage with software metering to identify patterns in employee usage of commercial and non-commercial software.
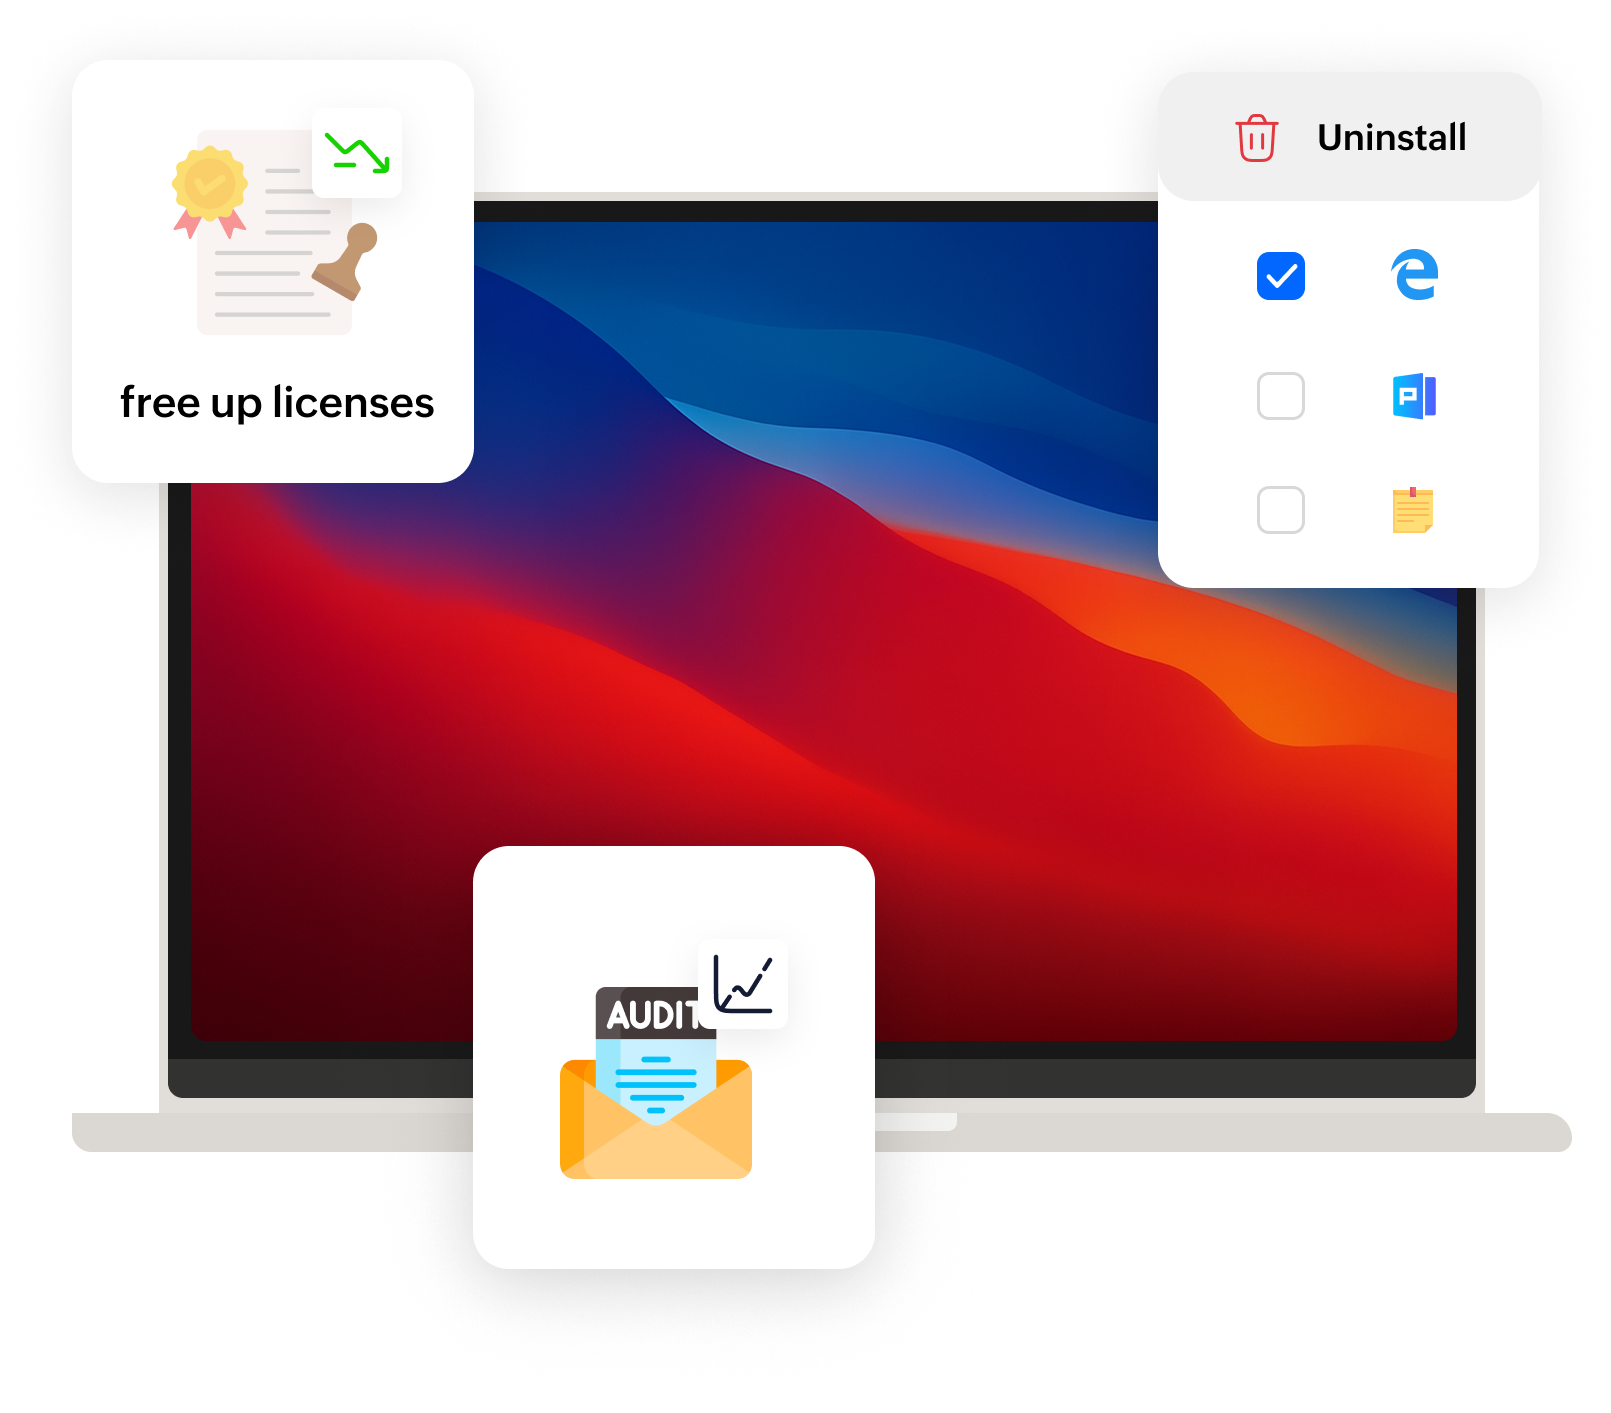
Software Reclaim
Slash software costs- free up licenses from unused installations, improve audit readiness, and boost security by lowering attack surface by uninstalling underused/outdated apps.
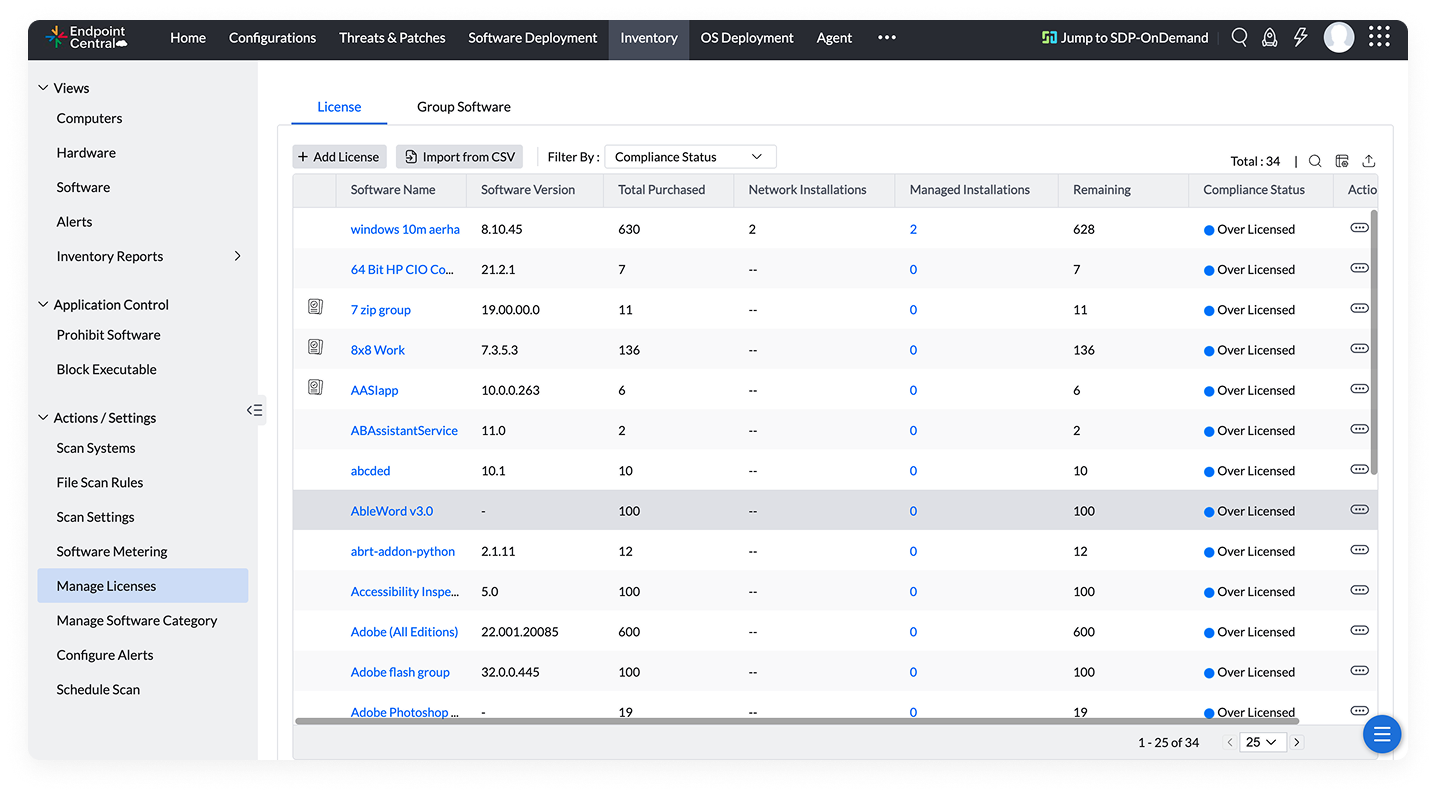
Smart software optimization
Monitor usage with software metering to identify patterns in employee usage of commercial and non-commercial software.
Key Capabilities
Improve your DEX with our intelligence-driven automation capabilities
Telemetry
Intelligence
Automation
Extensibility
Quantitative data
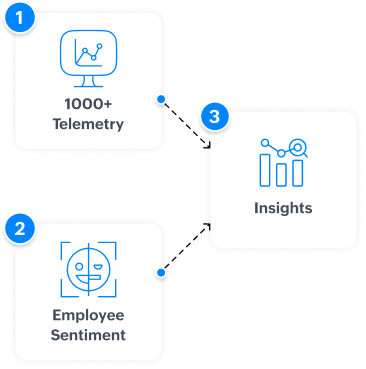
Our UEM platform gathers quantitative data to measure the impact of device and app deployments on the employee experience. Aggregate telemetry from over 1,000 data points that converge on endpoints, including device and app performance, software and hardware inventory, usage, network connectivity, power management, and device readiness.
Custom telemetry
You can extend our agent's telemetry scope using custom scripts to build monitors for events unique to your business operations.These events are recorded at a defined frequency.
Employee sentiment
Analysis of employee sentiment about technology changes and usage helps you plan for improvements and employee enablement. Our UEM platform integrates with our in-house, low-code app builder to build surveys, and these surveys can be shared via our UEM platform's self-service portal to gather feedback from employees.
Analytics
Our comprehensive telemetry forms the basis for intelligent scoring of the DEX, dedicated experience insights and dashboards, over 200 reports, and over 50 dashboard widgets. These deliver actionable insights about the inventory, ITOps, security, and the workplace experience via all touchpoints that converge on endpoints.
Insights, baselines, and scores
You can define performance thresholds across a multitude of hardware and software attributes to detect early signs of experience issues before they impact endusers. Each parameter has a weighted average, according to how it impacts the experience score, which can be baselined and compared acrossLOBs, functions, or departments.
Root cause analysis
Drilling down on issues to their downstream data helps you understand event causation and root cause analysis. Having the asset inventory built into the same platform enriches your understanding and correlation of experience issues further. Use built-in remote control to analyze event logs, registries, services, and CLIsin order to identify the rootcause of any issue.
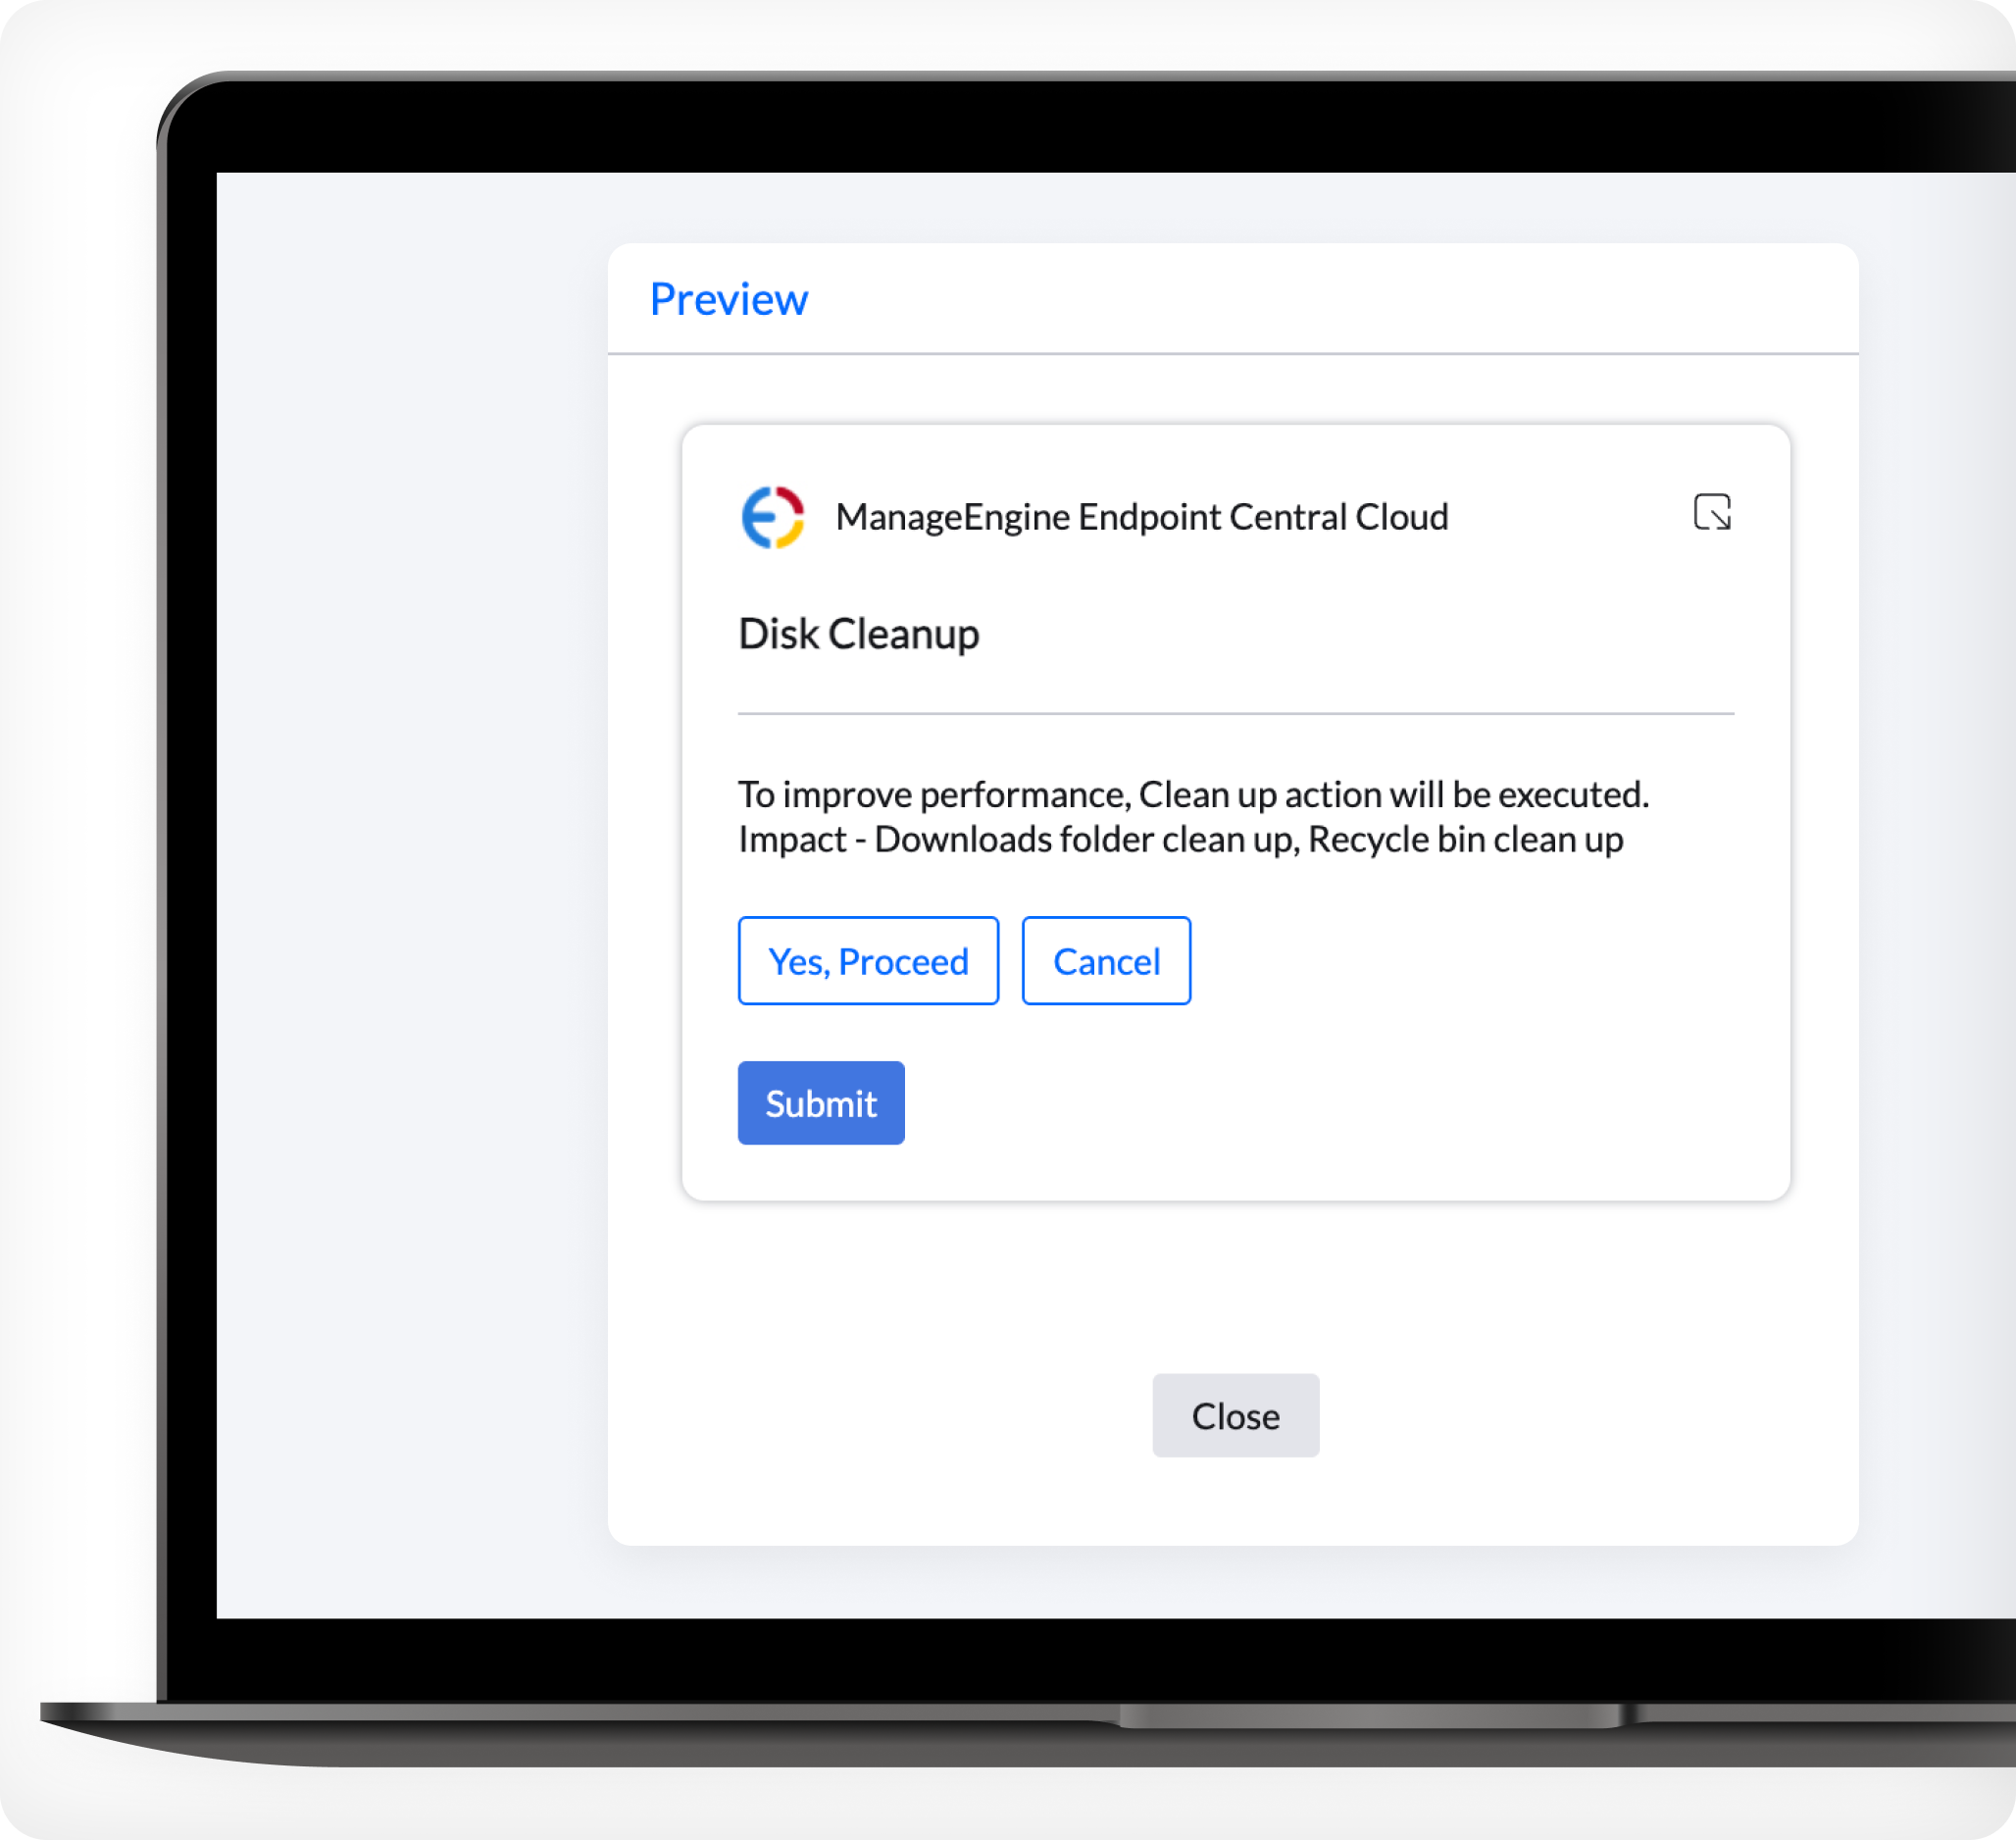
Single-click and workflow-driven healing
For every experience issue, we provide a contextual fix. IT teams can apply stand-alone remediation scripts or design full workflows with the no-code workflow builder. Drag-and-drop sensors, triggers, and actions to create automations that can be mapped to device groups. Proactive workflows, triggered by thresholds like high CPU, can be tested, validated, and deployed consistently at scale.
Self-healing
Our platform features over 200 guided automation workflows, over 10,000 prepackaged apps, over 100 ready-to-use configuration templates, over 400 ready-made scripts, and custom scripts. You can layer scripts sequentially and store them as playbooks for repetitive workflows. Based on preset triggers, our platform dynamically defines device groups and maps automation workflows to self-heal devices back to the desired state.
Self-service
Our UEM platform's built-in self-service portal hosts apps; updates; content; notifications; privacy policies; and a mechanism to raise requests for software, peripherals, and JIT admin privileges. The requests from the portal can be logged to service desks or viewed by admins in Endpoint Central.
Assisted healing
When the IT team must get involved, we offer built-in remote control for all major OSs and over 30 rugged handhelds. Access and monitor endpoints nonintrusively with the endusers' consent to analyze event logs, registries, services, and CLIs in order to identify the root cause of any issue. Record sessions and perform actions such as remotely commanding or managing power, including Wake-on-LAN and shutdowns. Remediate noncompliant devices.
Action Library
We have a curated Action Library of pre-built scripts, data collectors, and remediation workflows designed to address common endpoint issues instantly. These actions can be deployed directly from the Endpoint Central console or triggered automatically through experience-based workflows. To further accelerate IT response, the library can be extended with custom scripts and playbooks, allowing teams to standardize repeatable fixes and share best practices across environments.
Augmentedhelp desks
Our platform integrates with widely adopted helpdesk solutions so you can remotely troubleshoot issues directly from the ITSM console without switching contexts. To speed up responses to recurring issues, we've published a library of automations, which we've made available in the ticket and request windows of ITSM solutions through our integrations. For systemic issues, repeatable playbooks can be built using ManageEngine ServiceDesk Plus' workflow orchestration and our platform's extensive APIs.
Business intelligence
We integrate with our in-house business intelligence (BI) solution, ManageEngine Analytics Plus, to consolidate the quantitative and qualitative data gathered via our UEM agent, including custom telemetry pulled from endpoints. Beyond the endpoint analytics, Analytics Plus correlates telemetry from other first-party and third-party solutions to provide a holistic employee experience score.
Hear from the leaders
-%
reduction in cost
-%
reduction in downtime
"From getting ahead of system failures to enhancing the speed of resolution, we've seen downtime go down from as little as 25% to as high as 40%with Endpoint Central. Endpoint Central helps LTIMindtree achieve a 30% cost reduction while improving the user experience for its customers."
Siddarth Oruganti, Global practice head - digital workplace, LTIMindtree
ManageEngine is recognized as a Representative Vendor in the 2023 Gartner Market Guide for UEM tools.
Zoho Corp. (ManageEngine) has been positioned as a Leader in the IDC MarketScape: Worldwide Unified Endpoint Management Software 2024 Vendor Assessment
ManageEngine has been named a Strong Performer in The Forrester Wave ™ : Unified Endpoint Management, Q4 2023
9 of every 10 Fortune 100 companies trust ManageEngine
Enable DEX Manager add-on
Existing Endpoint Central Cloud users:
Navigate to Admin > Global Settings > DEX, enable the add-on, and try it free for 30 days.
Existing Endpoint Central on-prem users:
Upgrade to build number 11.4.2516 or above to enable the add-on.
New Endpoint Central users:
The add-on will be available on signup/download and can be used as part of the 30-day free trial.