Analyze data with Ask Zia
Ask Zia uses Agentic AI to simplify report and dashboard creation by delivering clear, contextual insights that explain your IT data’s current state and the reasons behind key patterns and anomalies.
On this page
1. Create insightful reports and dashboards
2. Understand anomalies, trends, and forecasts
3. Share your findings as slideshows
Create insightful reports and dashboards
Reports
Create insightful reports by simply describing your needs. Ask Zia interprets your intent, generate the right reports with appropriate filters, and suggests next steps—making report building faster and smarter for everyone.
Access the Ask Zia Portal from the side navigation panel. Ensure to enable the conversation mode.
In the prompt section, describe what report you want to create.
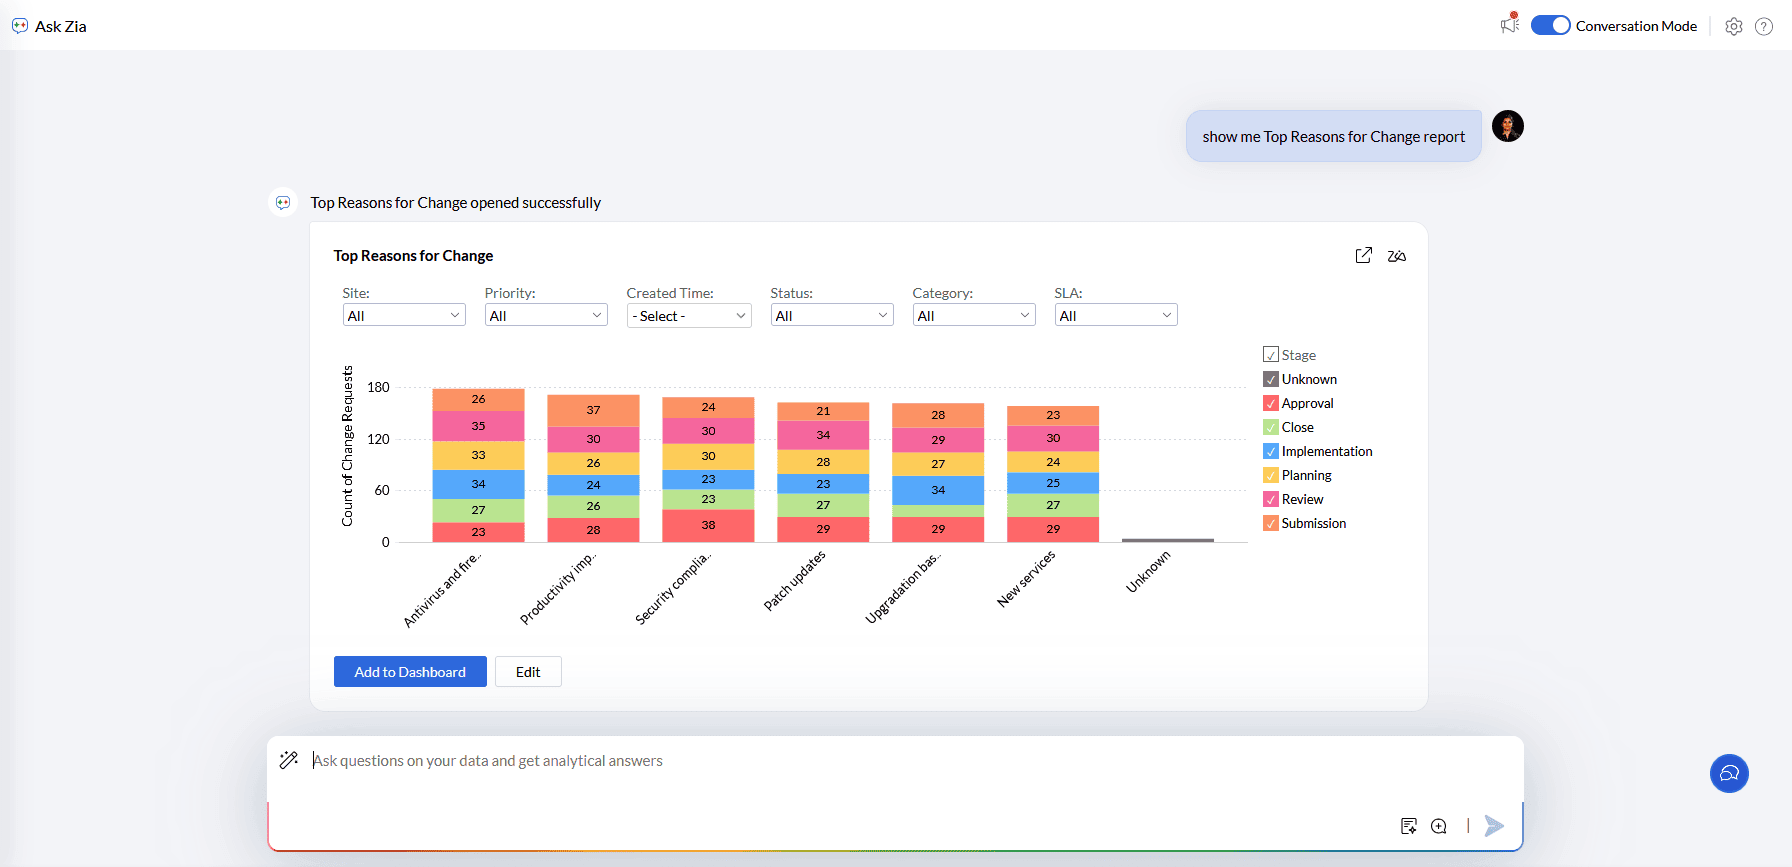
Click the Save icon to add the reports to the workspace.
Specify the View Name and choose the folder name where it should be saved.
Click Save.
The Change chart type option allows you to change and choose the suitable chart type.
Zia insights provides a detailed summary of key insights in the report.
The Edit option allows you to modify the report settings such as axes, legends, and more.
The Add to Dashboard option allows you to include the reports in an existing dashboard in the workspace.
Dashboards
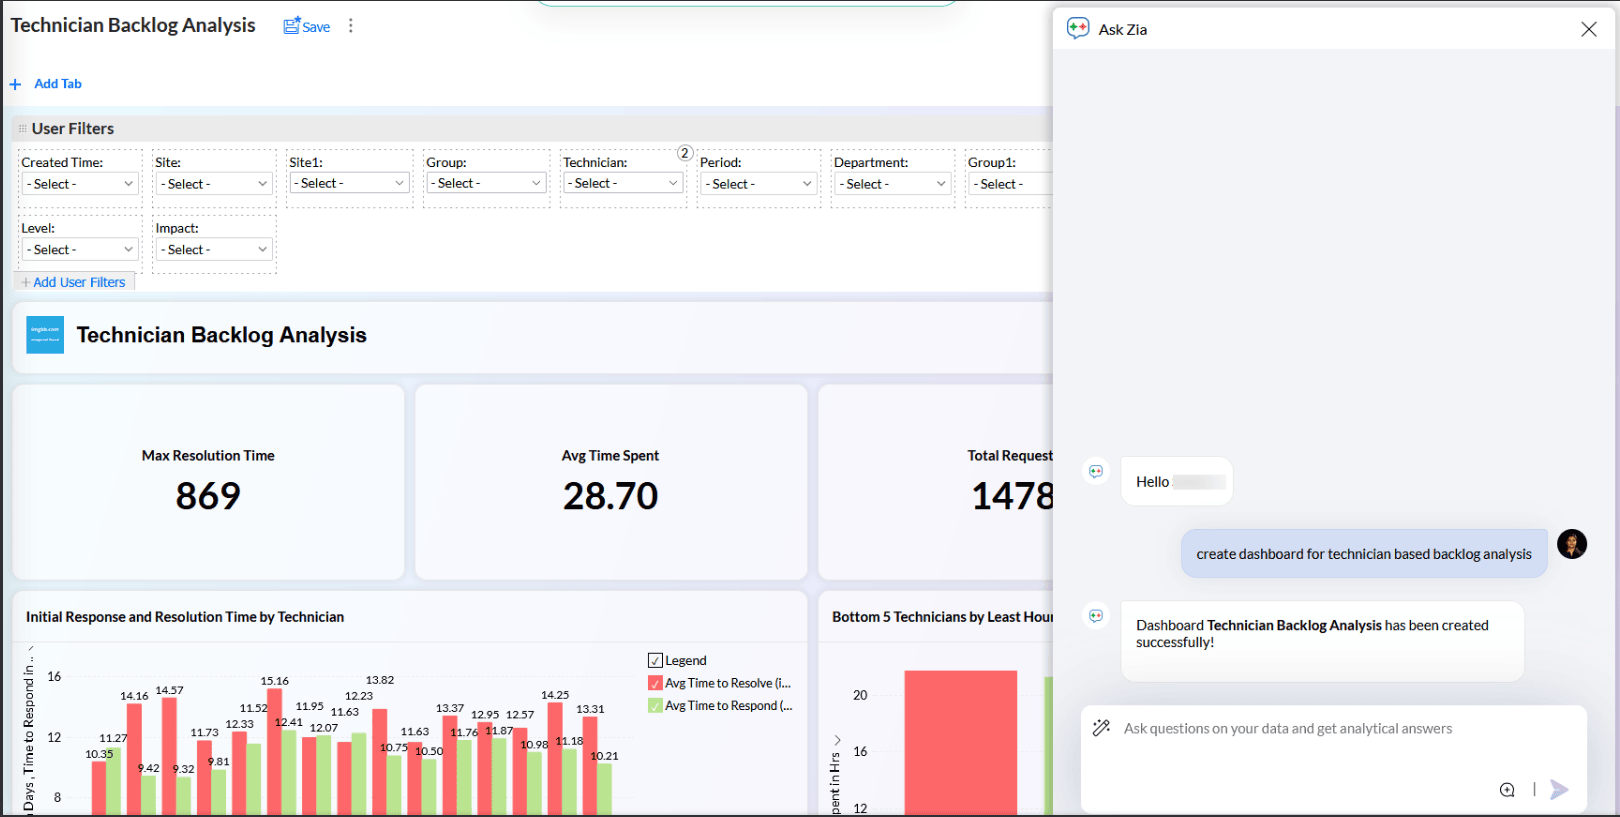
Whether creating new dashboards or refining existing ones, Ask Zia comprehends your layout, content, and visualization requirements to provide a tailored experience throughout. You can create dashboards in either of the below ways.
Access the Ask Zia Portal from the side navigation panel.
In the prompt section, provide the details about the metrics to be used for the dashboard creation.
Click Save to add the reports to the workspace.
Click Open in a new tab to modify the dashboard settings.

Specify the details on customizing the dashboards in the prompt section.
Layout: Specify how the charts and widgets are to be arranged on the dashboard, whether single, double, or custom column layout.
Switch themes: Customize the dashboard appearance by specifying the preferred theme. Example: Switch to Dark Theme.
Add or Remove Views: Include or exclude specific charts, KPIs, or visualizations as needed to refine your dashboard. Example: Add sales by region report.
Click Create > Dashboard on the side navigation panel.
In the prompt section, provide the details about the metrics to be used for the dashboard creation.
Customize the dashboard design as per your preferences.
Understand anomalies, trends, and forecasts
The conversational interface in Ask Zia allows users to explore data using simple language. It offers a closer lens into what has happened, why it happened, and what’s likely to happen along with recommendations to guide your next steps.
Share your findings as slideshows
Convert reports and dashboards into compelling, narrative-driven slideshows with Ask Zia.
Access the Ask Zia Portal from the side navigation panel. Ensure to enable the conversation mode.
In the prompt section, describe the slideshow details you want to create.
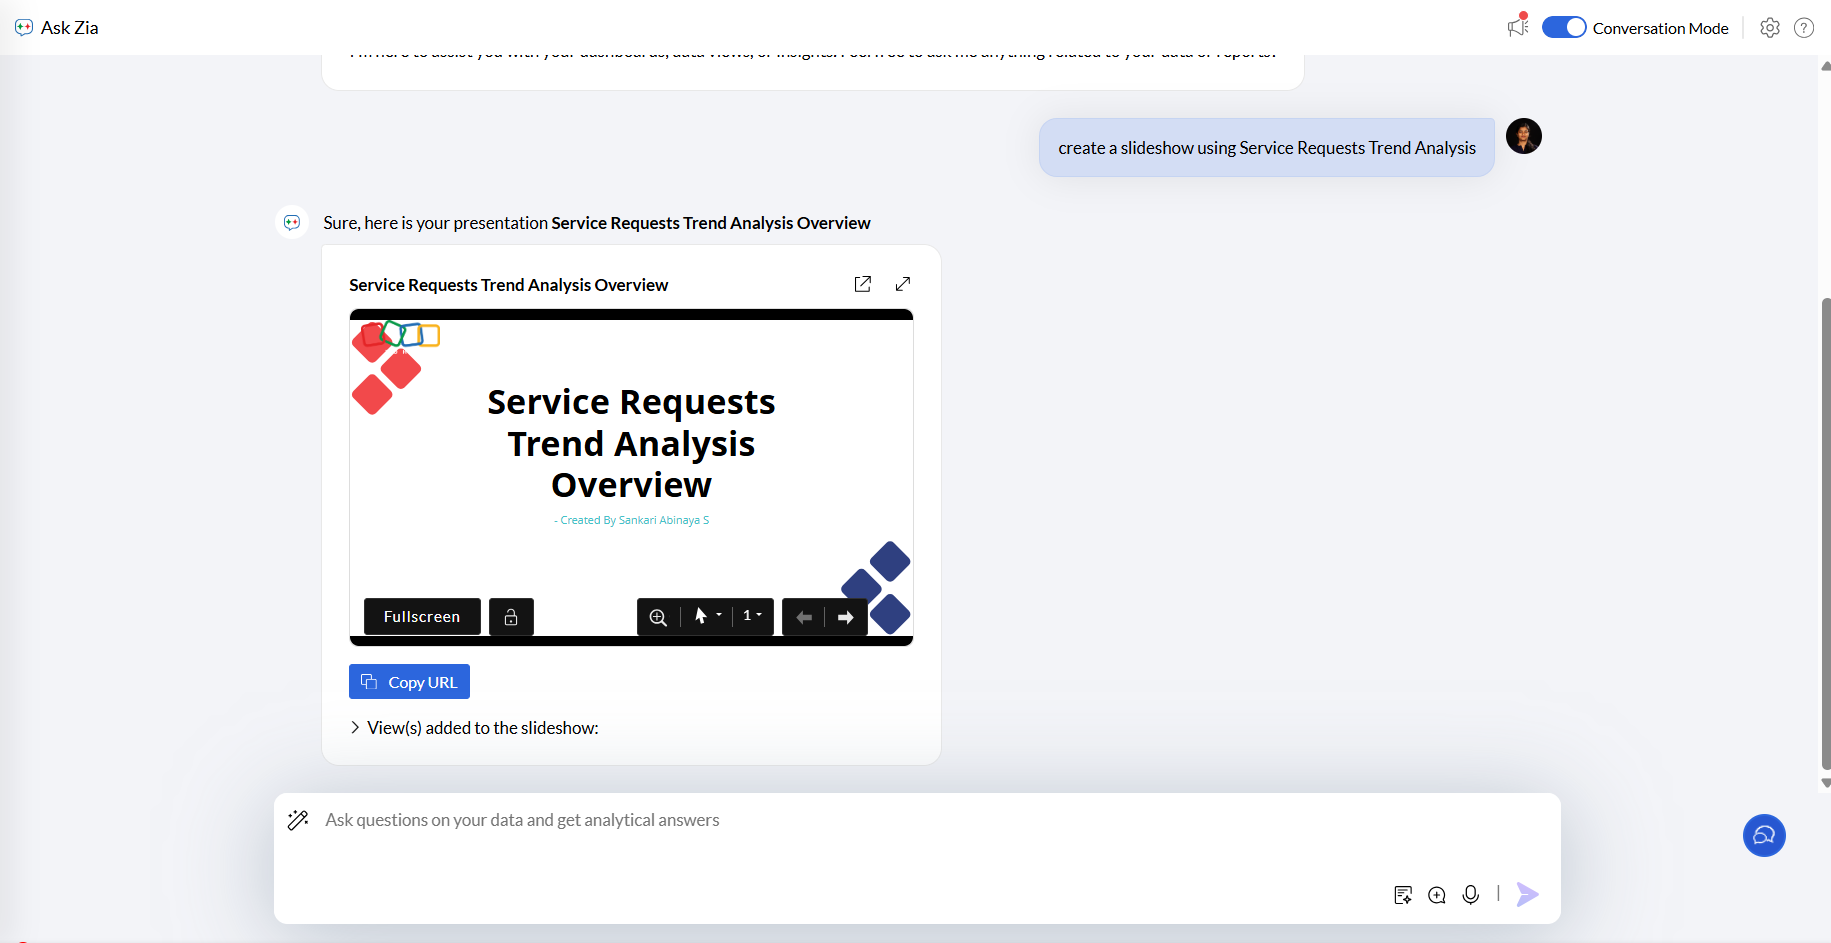
Click the drop - down icon to view the reports used in the slideshow. You can easily add or remove views from the slideshow.
Click Open in new tab to view the slideshow.
Rename the slideshow by specifying the preferred slideshow name in the prompt.