Playbooks overview
Last updated on:
In this page
- Overview
- Prerequisites
- What is a playbook?
- Playbook configuration
- Workflow architecture
- How is a remediation executed?
- Remediation Execution History
- Playbook types
- Association and execution
- Use cases
Overview
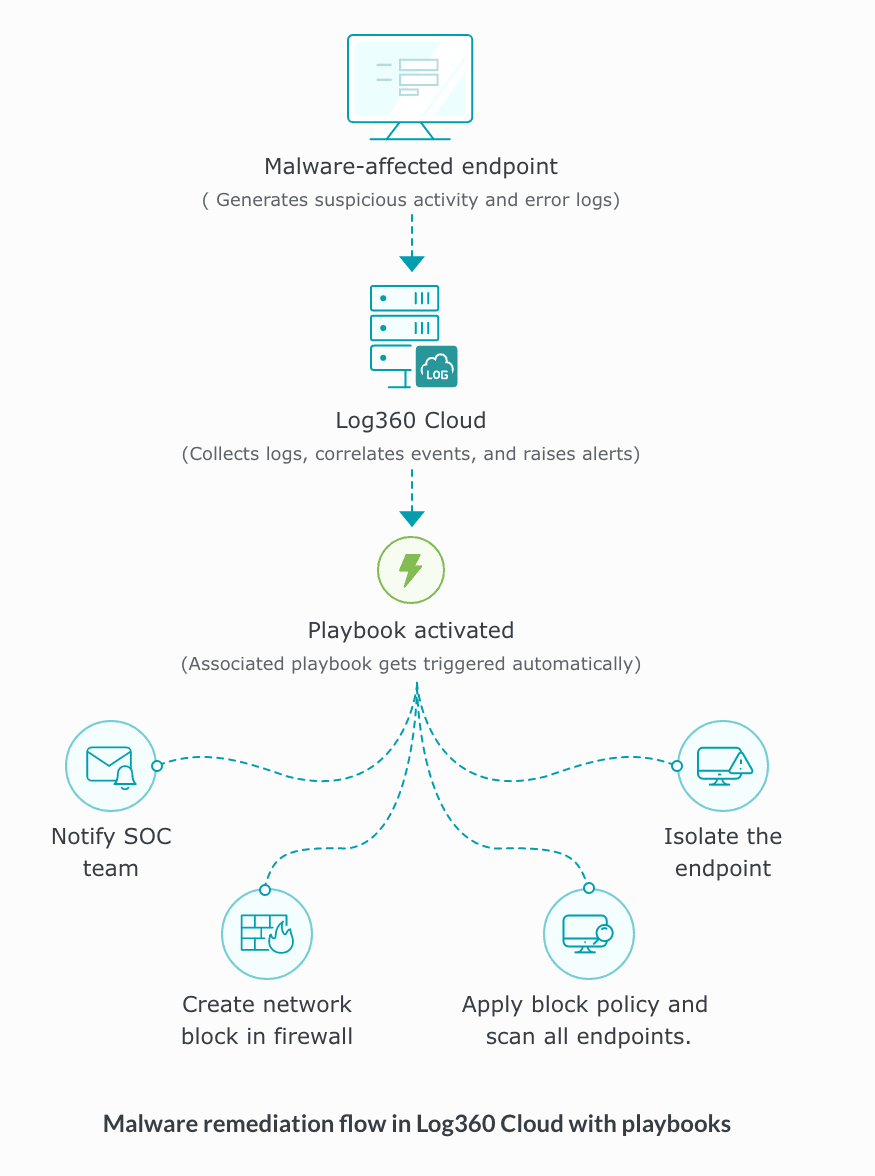
Playbooks in Log360 Cloud help automate and streamline the incident response process. They define a structured sequence of actions that can be triggered automatically when a specific event or alert occurs. These actions can include alert enrichment, evidence validation, or automated remediation steps across connected applications.
Playbooks ensure consistency in response behavior and significantly reduce manual intervention. They can be created from scratch or imported from a pre-defined library of playbooks.
Once configured:
- For automatic execution, playbooks can be associated with alert profiles and will run when the corresponding alert is generated.
- For manual execution, playbooks can be triggered from alerts, incidents, and incident evidence.
From incident evidence and incidents, playbooks can only be executed manually by the user.
Prerequisites
Before configuring playbooks, ensure the following conditions are met:
Licensing limits
Please note that the playbook capability in Log360 Cloud is available only for Trial and Professional plans. If you are using a different plan, upgrade your subscription to access this feature.
Role-based access control
The user must have an admin role to create, edit, or delete playbooks. Operators can associate playbooks with alerts and can manually run them from alerts and incidents.
| Role | Access |
|---|---|
| Admin | Create, manage playbooks and execution access |
| Operator | Execute playbooks through the module access |
| Guest | No access |
What is a playbook?
- A playbook is an automated response sequence that executes a predefined set of security actions in response to an alert, detection, or incident.
- Each playbook is composed of logical blocks, called States, that perform specific operations sequentially or conditionally based on the defined flow.
- Playbooks operate on top of QNTRL Circuit , an internal orchestration engine that enables drag-and-drop mechanism, visual flow validation, and real-time execution monitoring.
- This integration provides a unified workspace for creating and managing playbooks without requiring scripting knowledge.
Playbook configuration
A playbook typically goes through the following stages:
1. Creation: A new playbook can be created from scratch or imported from the playbook library. The creation phase involves defining its name, context, and purpose using the builder interface. Each state represents an individual action, and multiple states can be linked to create the overall response logic.
2. Validation and Readiness: After creation, playbooks can be tested to verify that all configured actions perform as expected. It is recommended to validate the playbook to ensure it is functioning correctly before using it in alerts or incidents.
3. Execution: Playbooks can be triggered automatically when alert conditions are met or manually invoked by analysts from investigation views. Execution progress can be tracked live with detailed logs for each block.
4. Review: All execution instances are recorded under Execution history. Administrators can analyze performance, detect failed states, and rerun or retry incomplete actions.
Workflow architecture
How is a remediation executed?
There are two ways in which a remediation can be executed:
- When a remediation is associated to an alert profile
- On-demand remediation execution
A. When a remediation is associated to an alert profile
When an event triggers an alert, and the alert profile has a remediation linked to it, the remediation runs automatically. In short, the event causes an alert, and the alert triggers the assigned remediation.
B. On-demand remediation execution
When an event occurrence is identified, you can manually execute a remediation from different locations in the product console:
- Alerts tab
- Incident tab
- Incident Evidences section
Below is the step-by-step guide on how to execute a remediation manually.
Executing remediation from the Alerts tab
- In the product console, navigate to the Alerts tab.
- Locate the alert for which remediation needs to be executed.
- In the Last Remediation Status column, click Run Remediation.
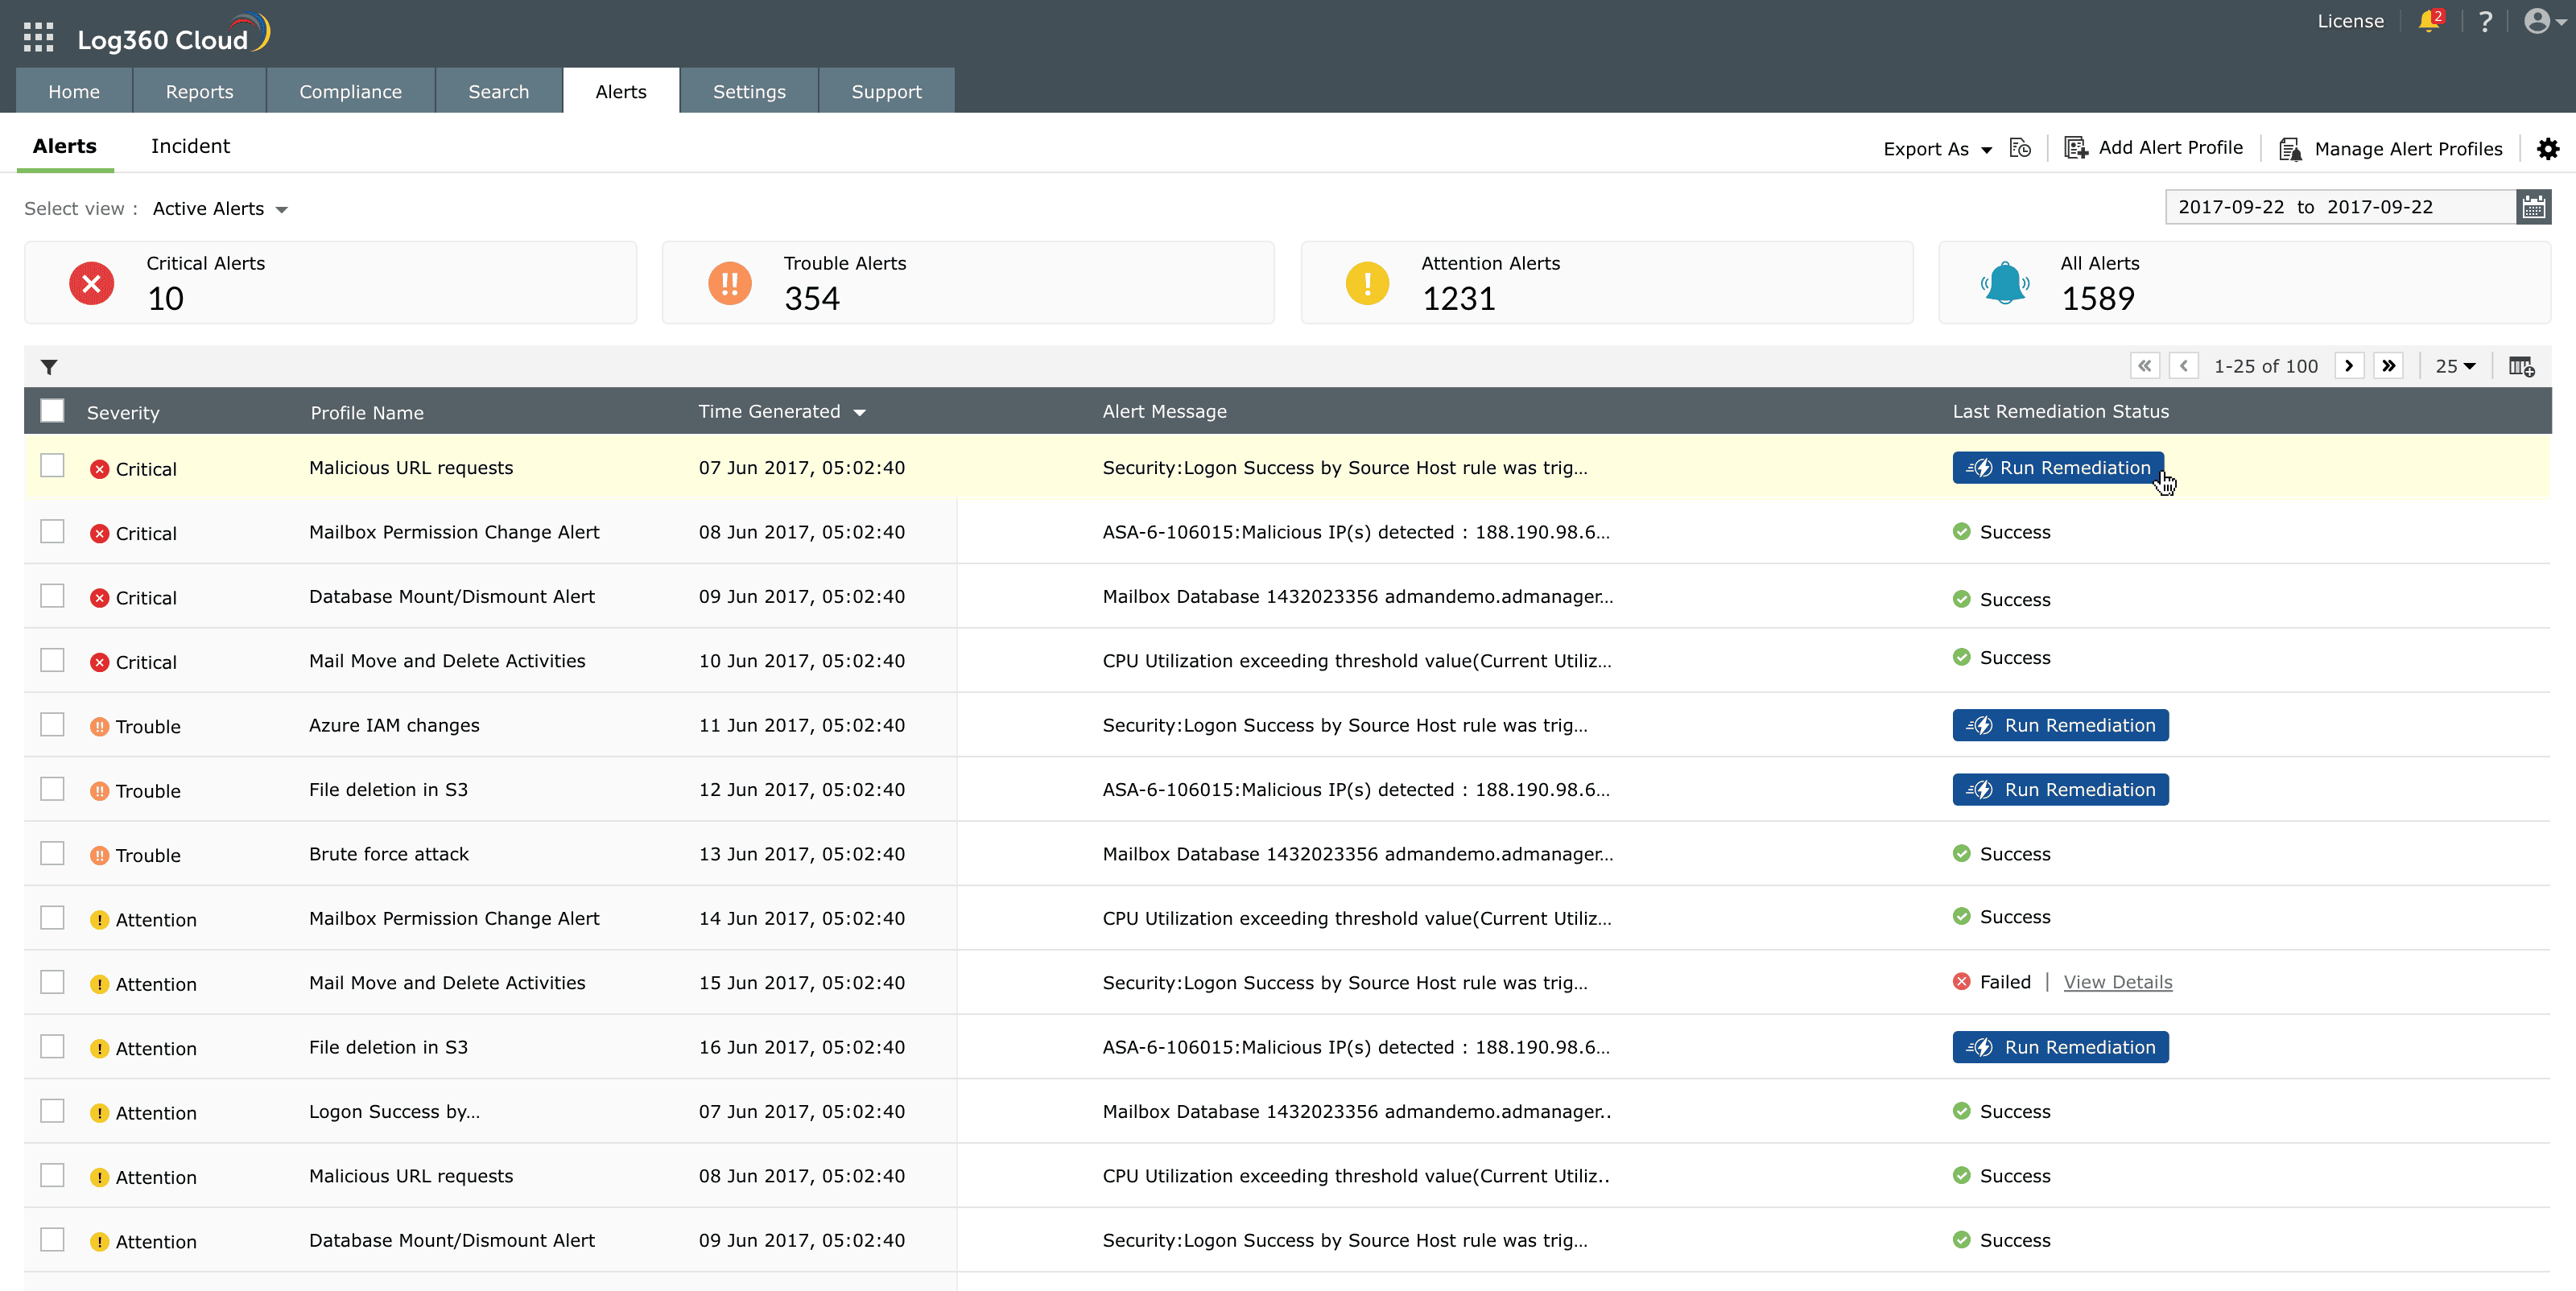
Image: Manually triggering a remediation for a specific alert from the Alerts tab - The remediation is executed immediately.
- The execution result is reflected in the Last Remediation Status column as Success or Failed. Note that this column displays only the most recent playbook execution result. To view details of all executions associated with the alert, hover over the column and click View Details.
- The status is updated in the Last Remediation Status column.
Executing remediation from the Incident tab
- Navigate to Alerts → Incident tab.
- The list of incidents is displayed.
- Identify the incident for which remediation needs to be executed.
- In the Last Remediation Status column, click Run Remediation.
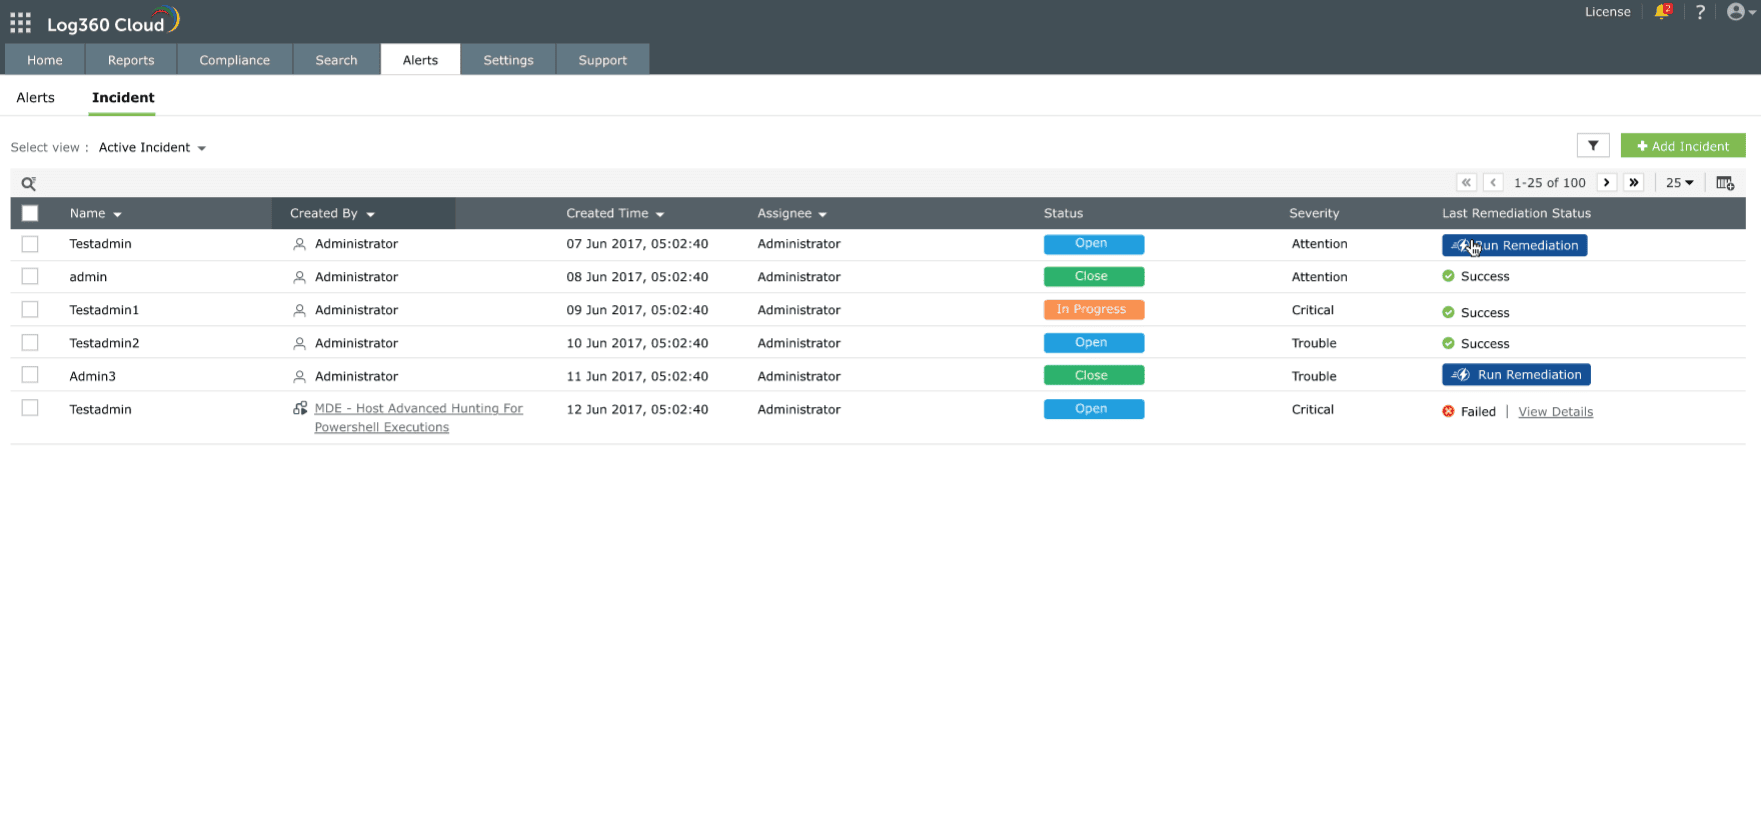
Image: Incident tab to initiate a manual remediation - The remediation is executed for the selected incident.
- The status is updated in the Last Remediation Status column.
Executing remediation from Incident Evidences
- Navigate to Alerts → Incident tab.
- Click on the required incident name to open incident details.
- In the incident details page, select the Evidences tab.
- The list of evidences for an incident is displayed.
- Locate the required evidence entry.
- Click Run Remediation corresponding to that evidence.
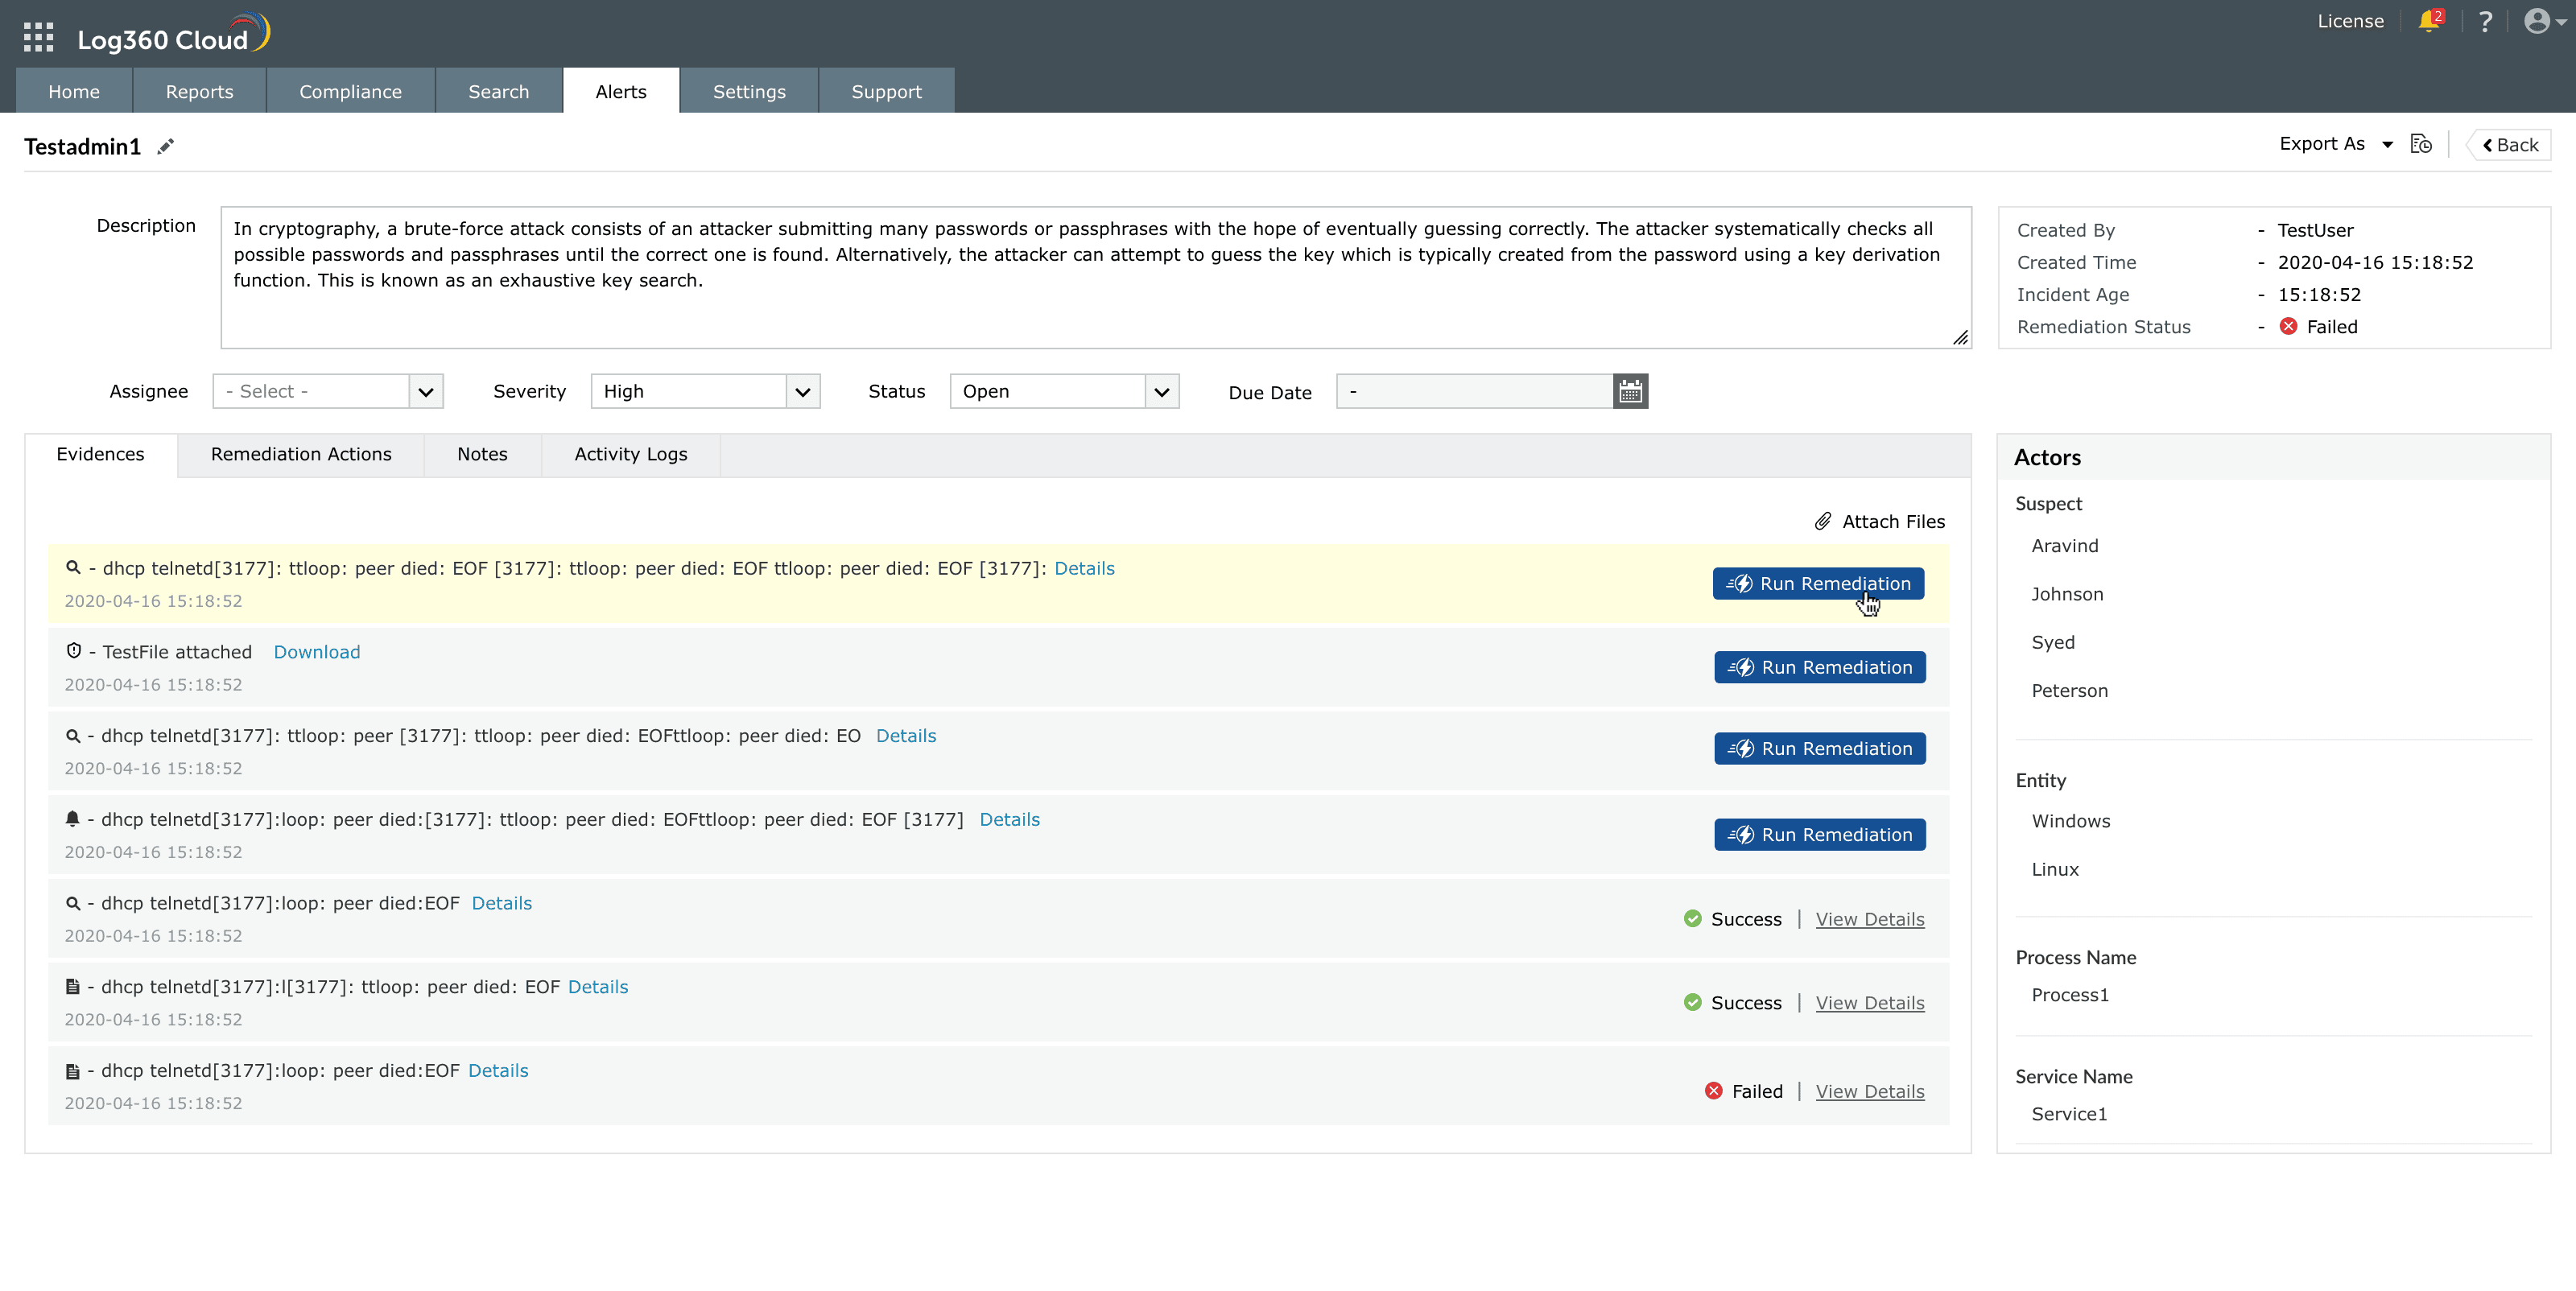
Image: Run Remediation option within the Incident Evidences - You can perform this action from the Remediation Actions tab also.
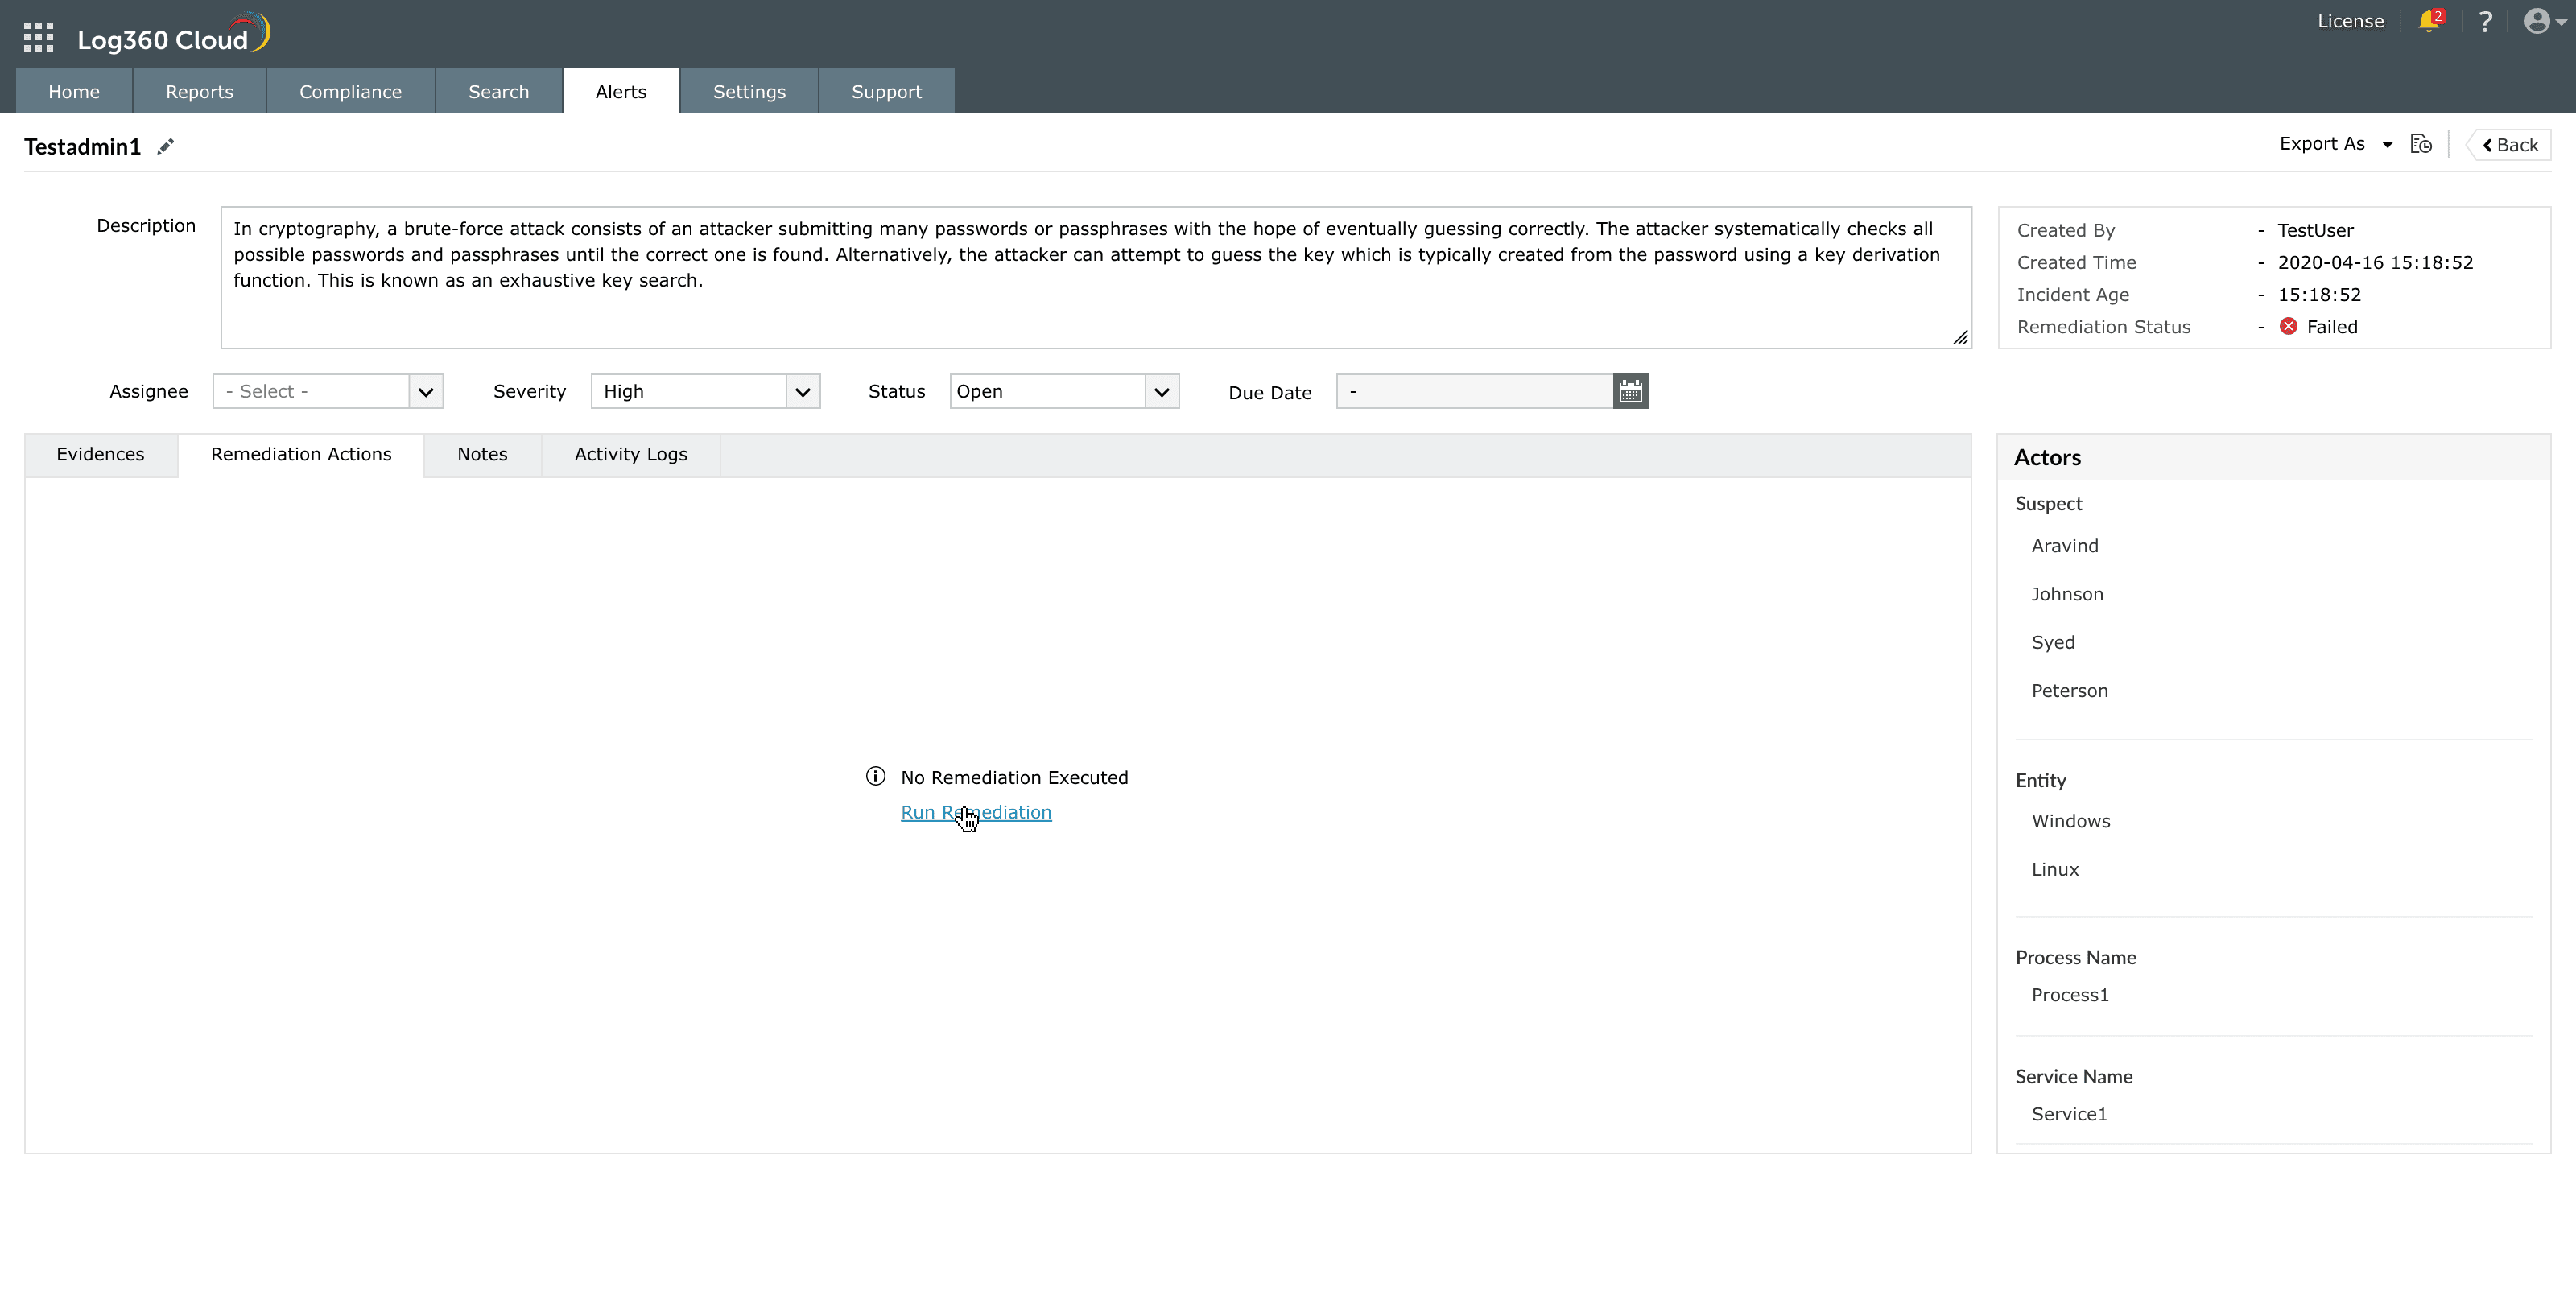
Image: Tracking the status of playbooks under the Remediation Actions tab - The remediation is executed for the selected evidence.
- The execution result appears next to the evidence entry. Click View More to view detailed execution information for the selected evidence.
- The status is updated in the Last Remediation Status column.
Remediation Execution History
You can access and view the list of playbooks executed for a profile from the Remediation Execution History panel as explained below:
- Navigate to the associated module and click anywhere on the row of the required profile.
- When you click on View Details, a details panel opens. This panel displays contextual insights including the time of occurrence, affected systems, involved users, related processes, and mapped MITRE ATT&CK techniques.
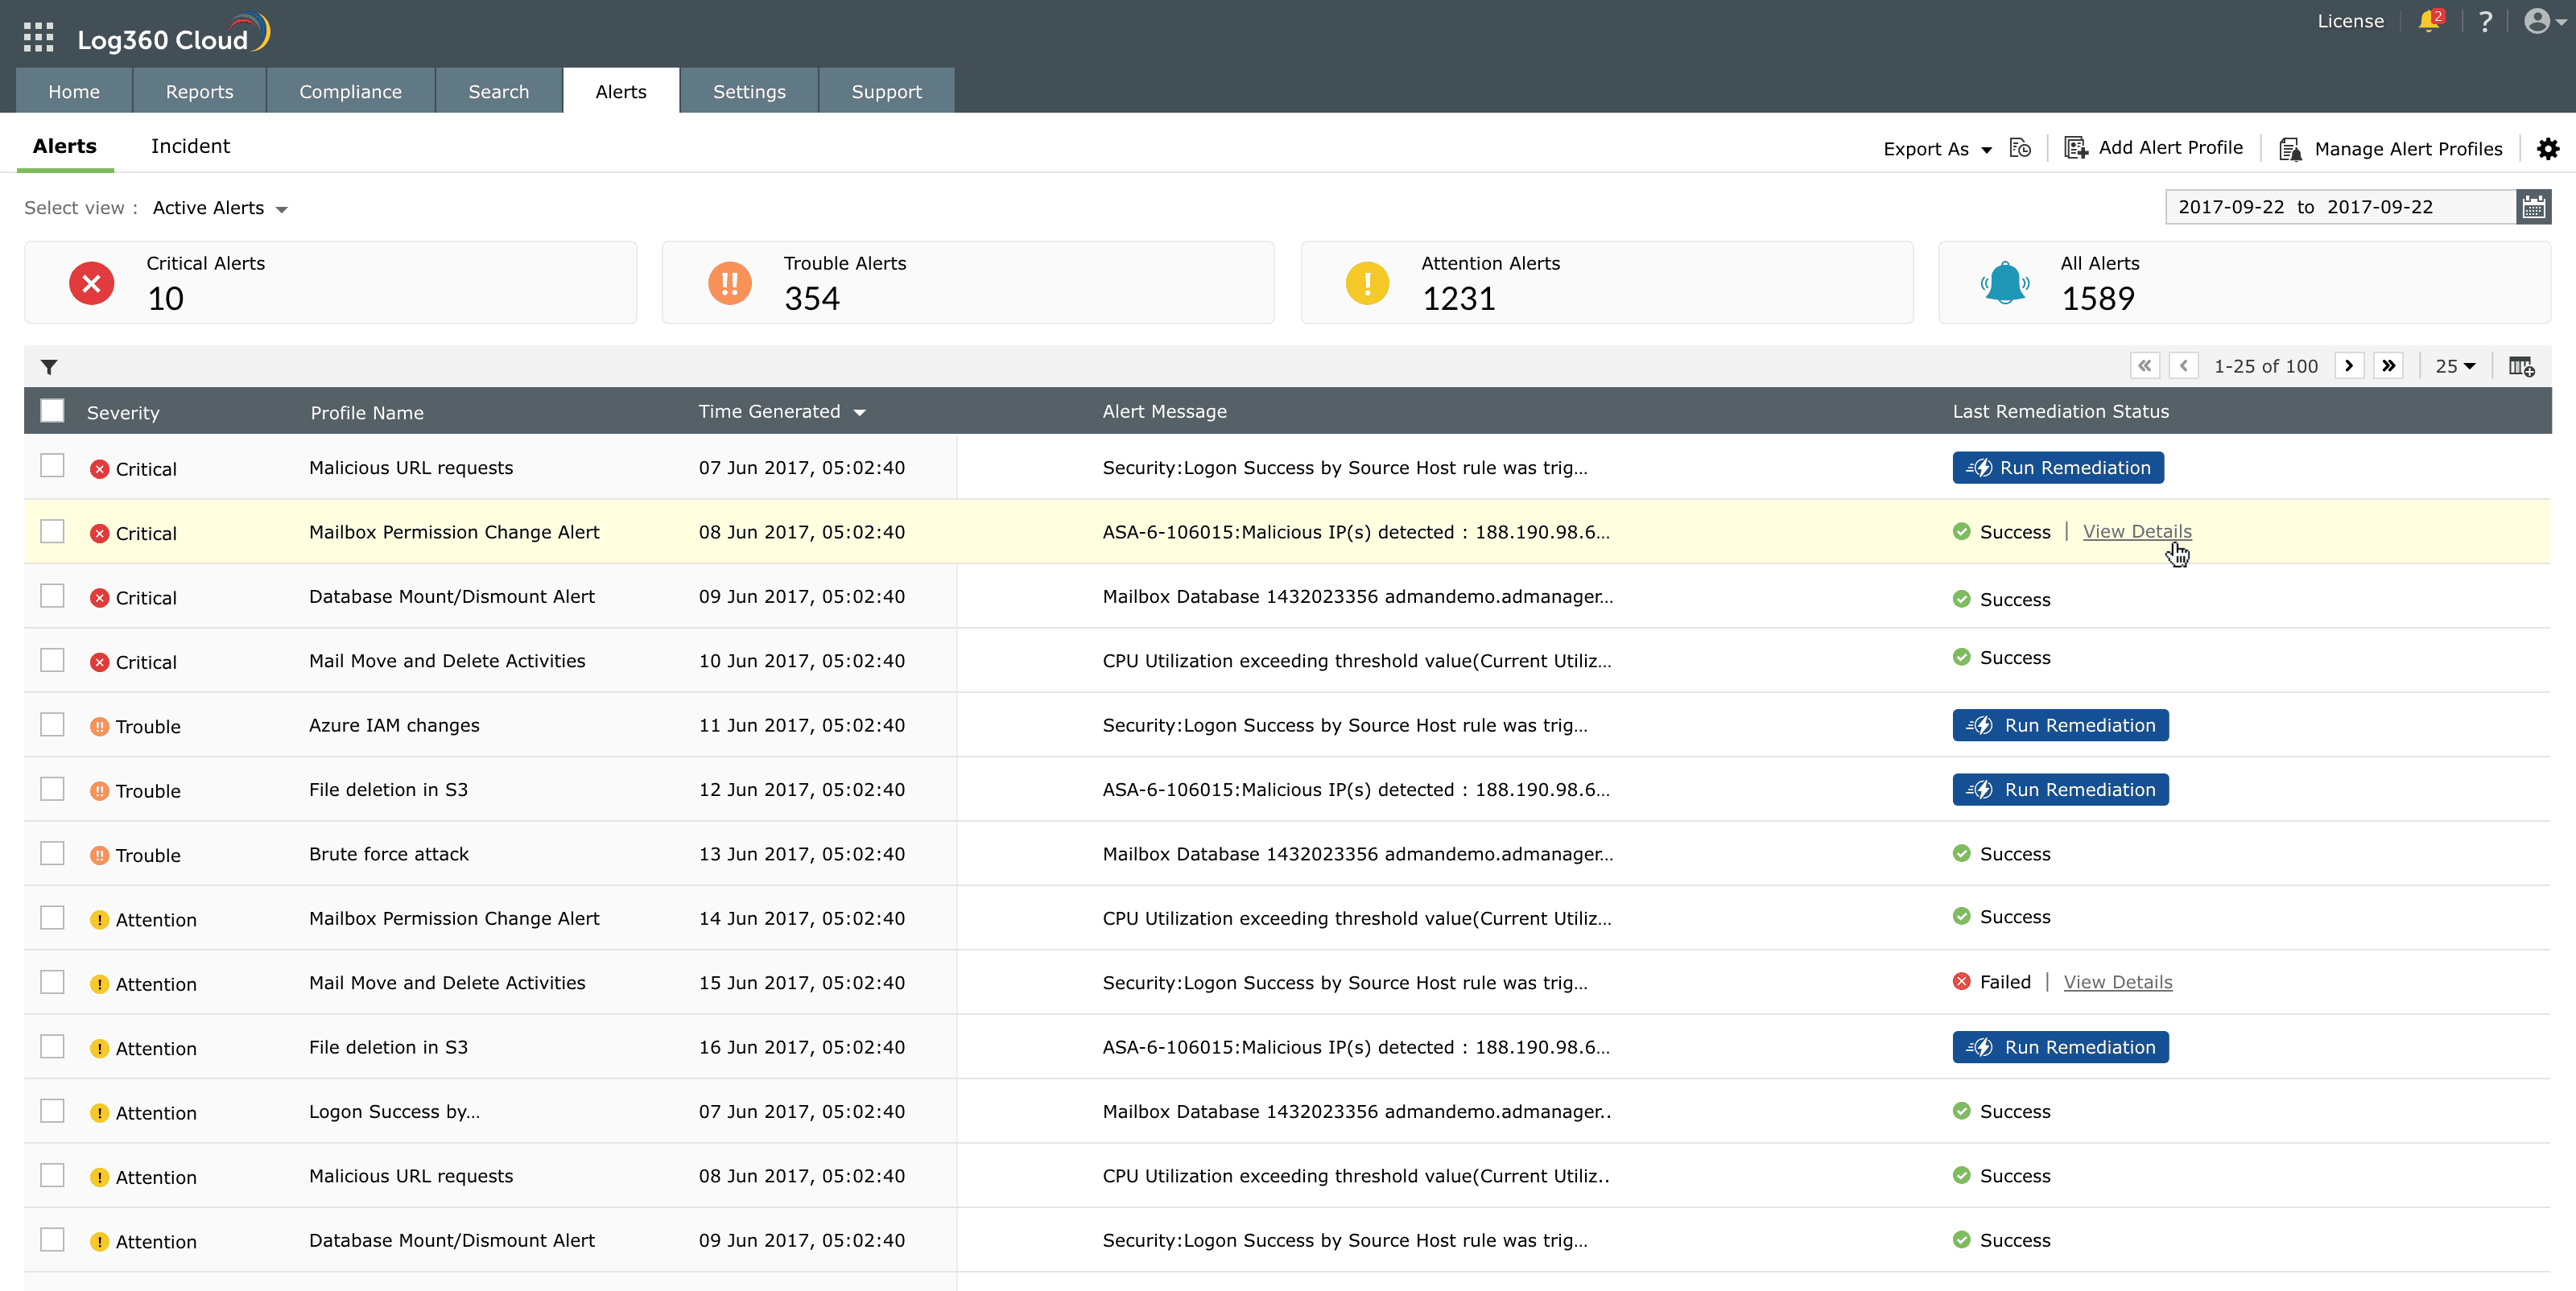
Image: Clicking View Details to see remediation results - Click View Details next to any remediation entry to open the Remediation Execution History window.
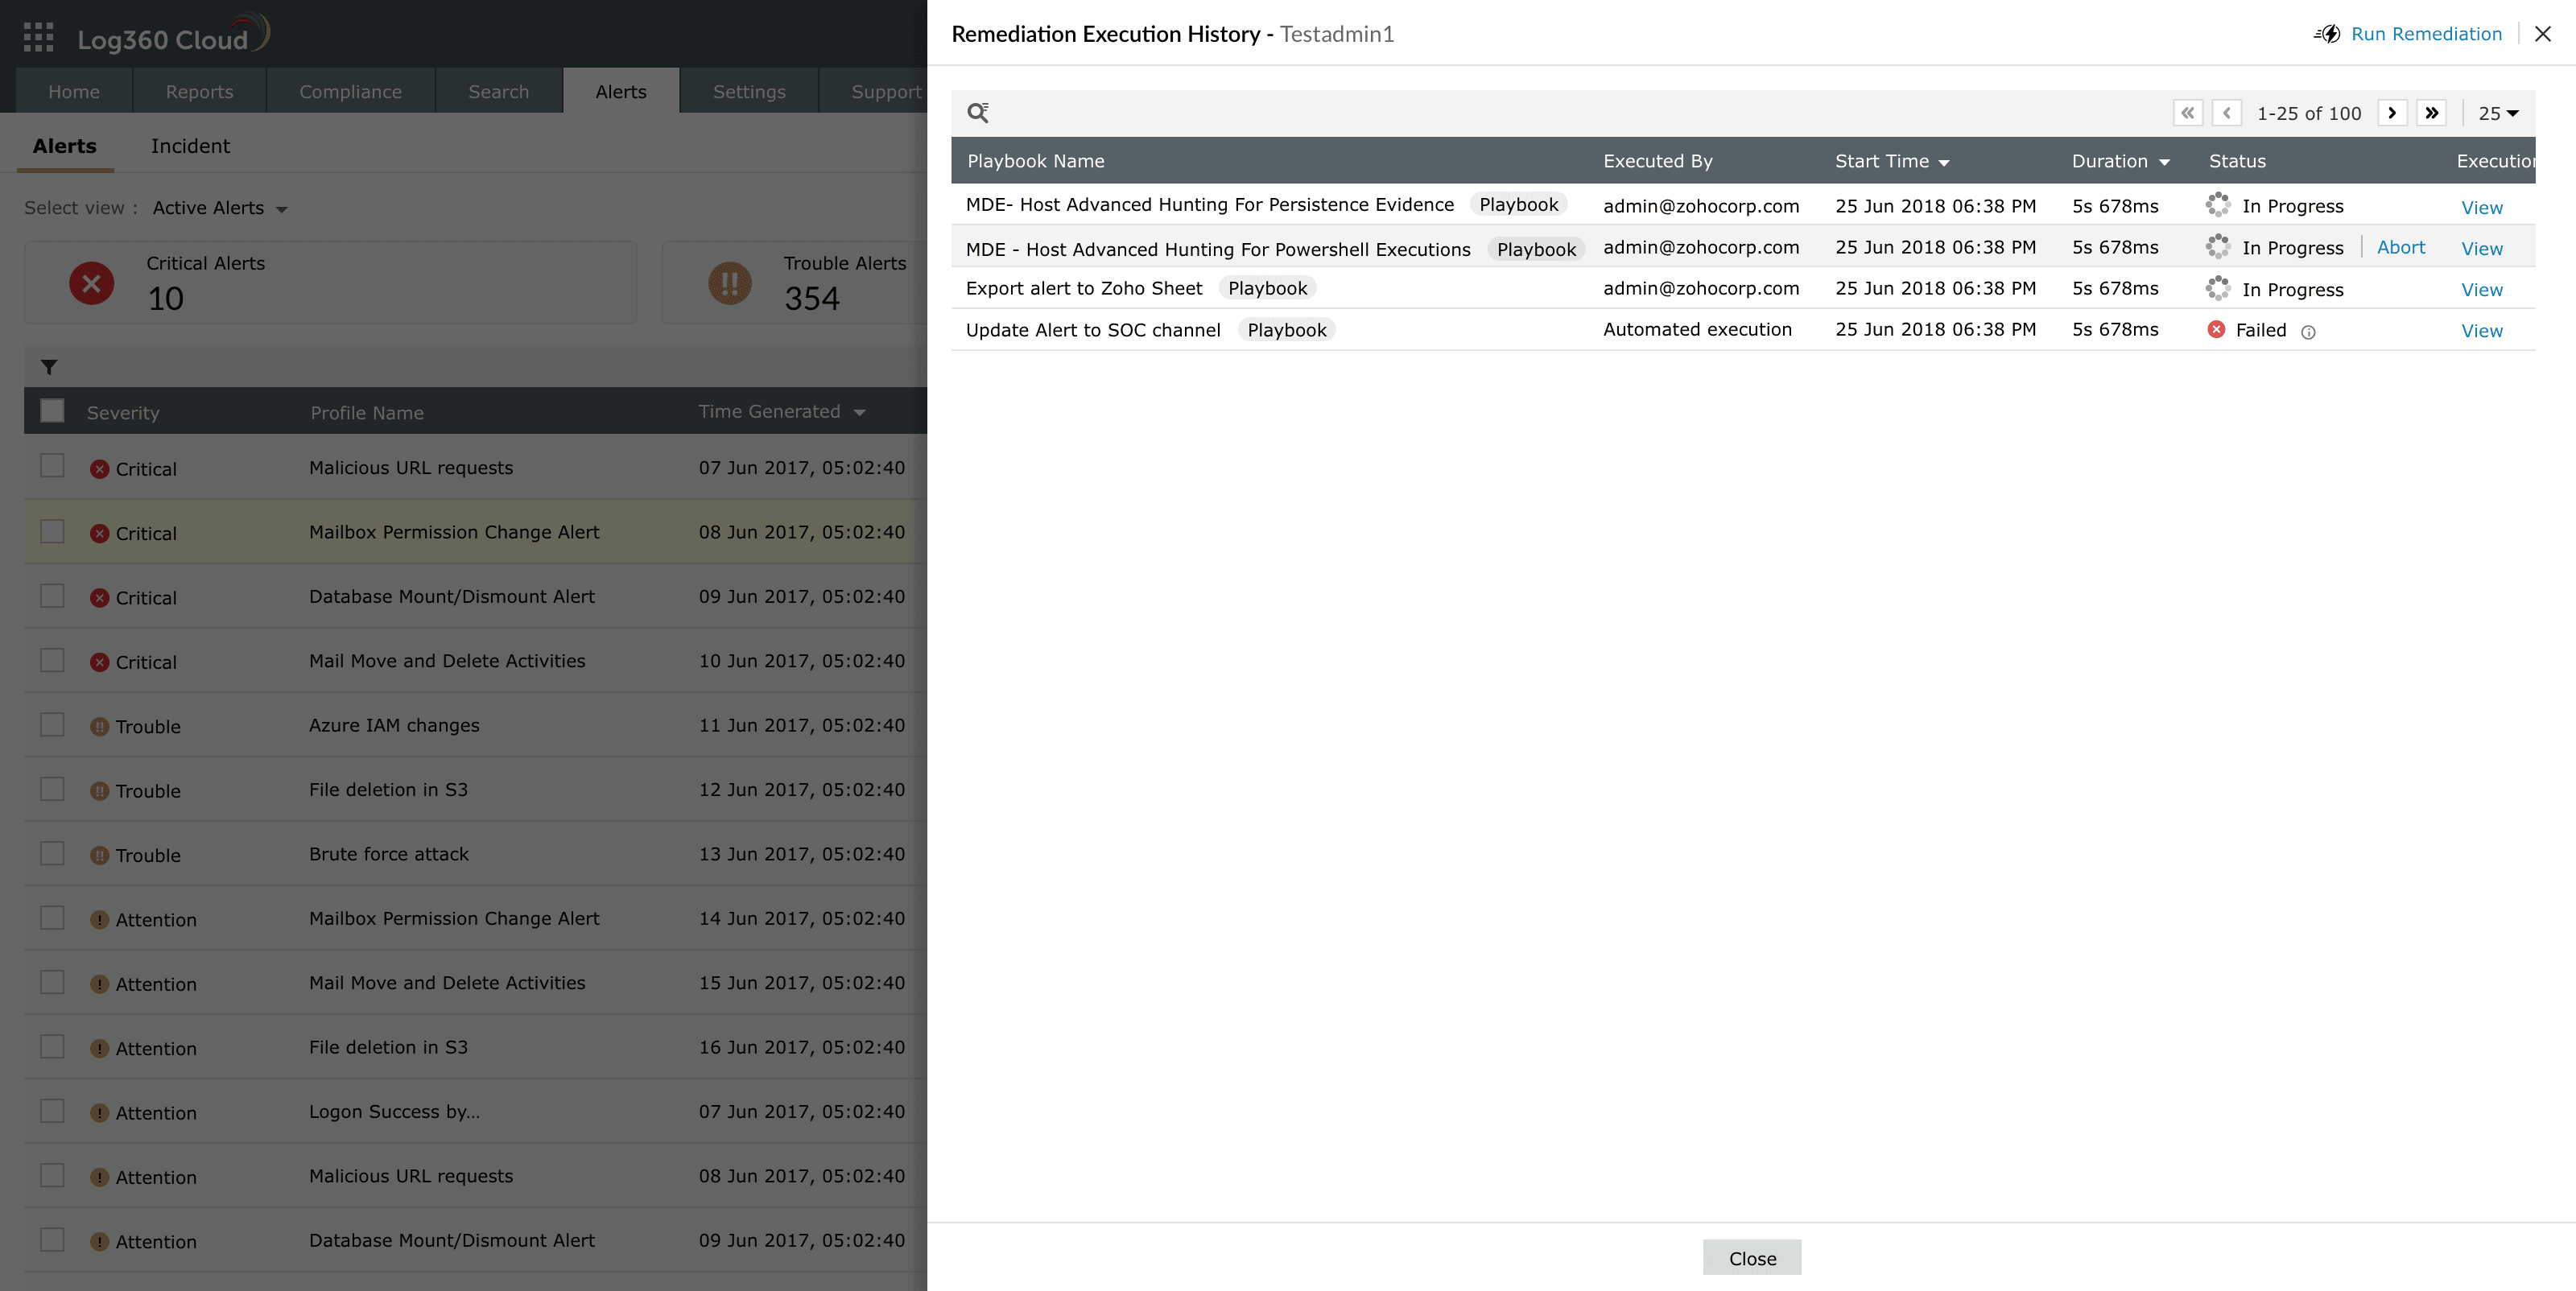
Image: Reviewing playbook status in Remediation Execution History - This lists each playbook by name, the user or automated process that executed it, the start time, duration, and status — In Progress, Success, or Failed. From here, you can also perform actions such as Rerun, Retry, or Abort the execution.
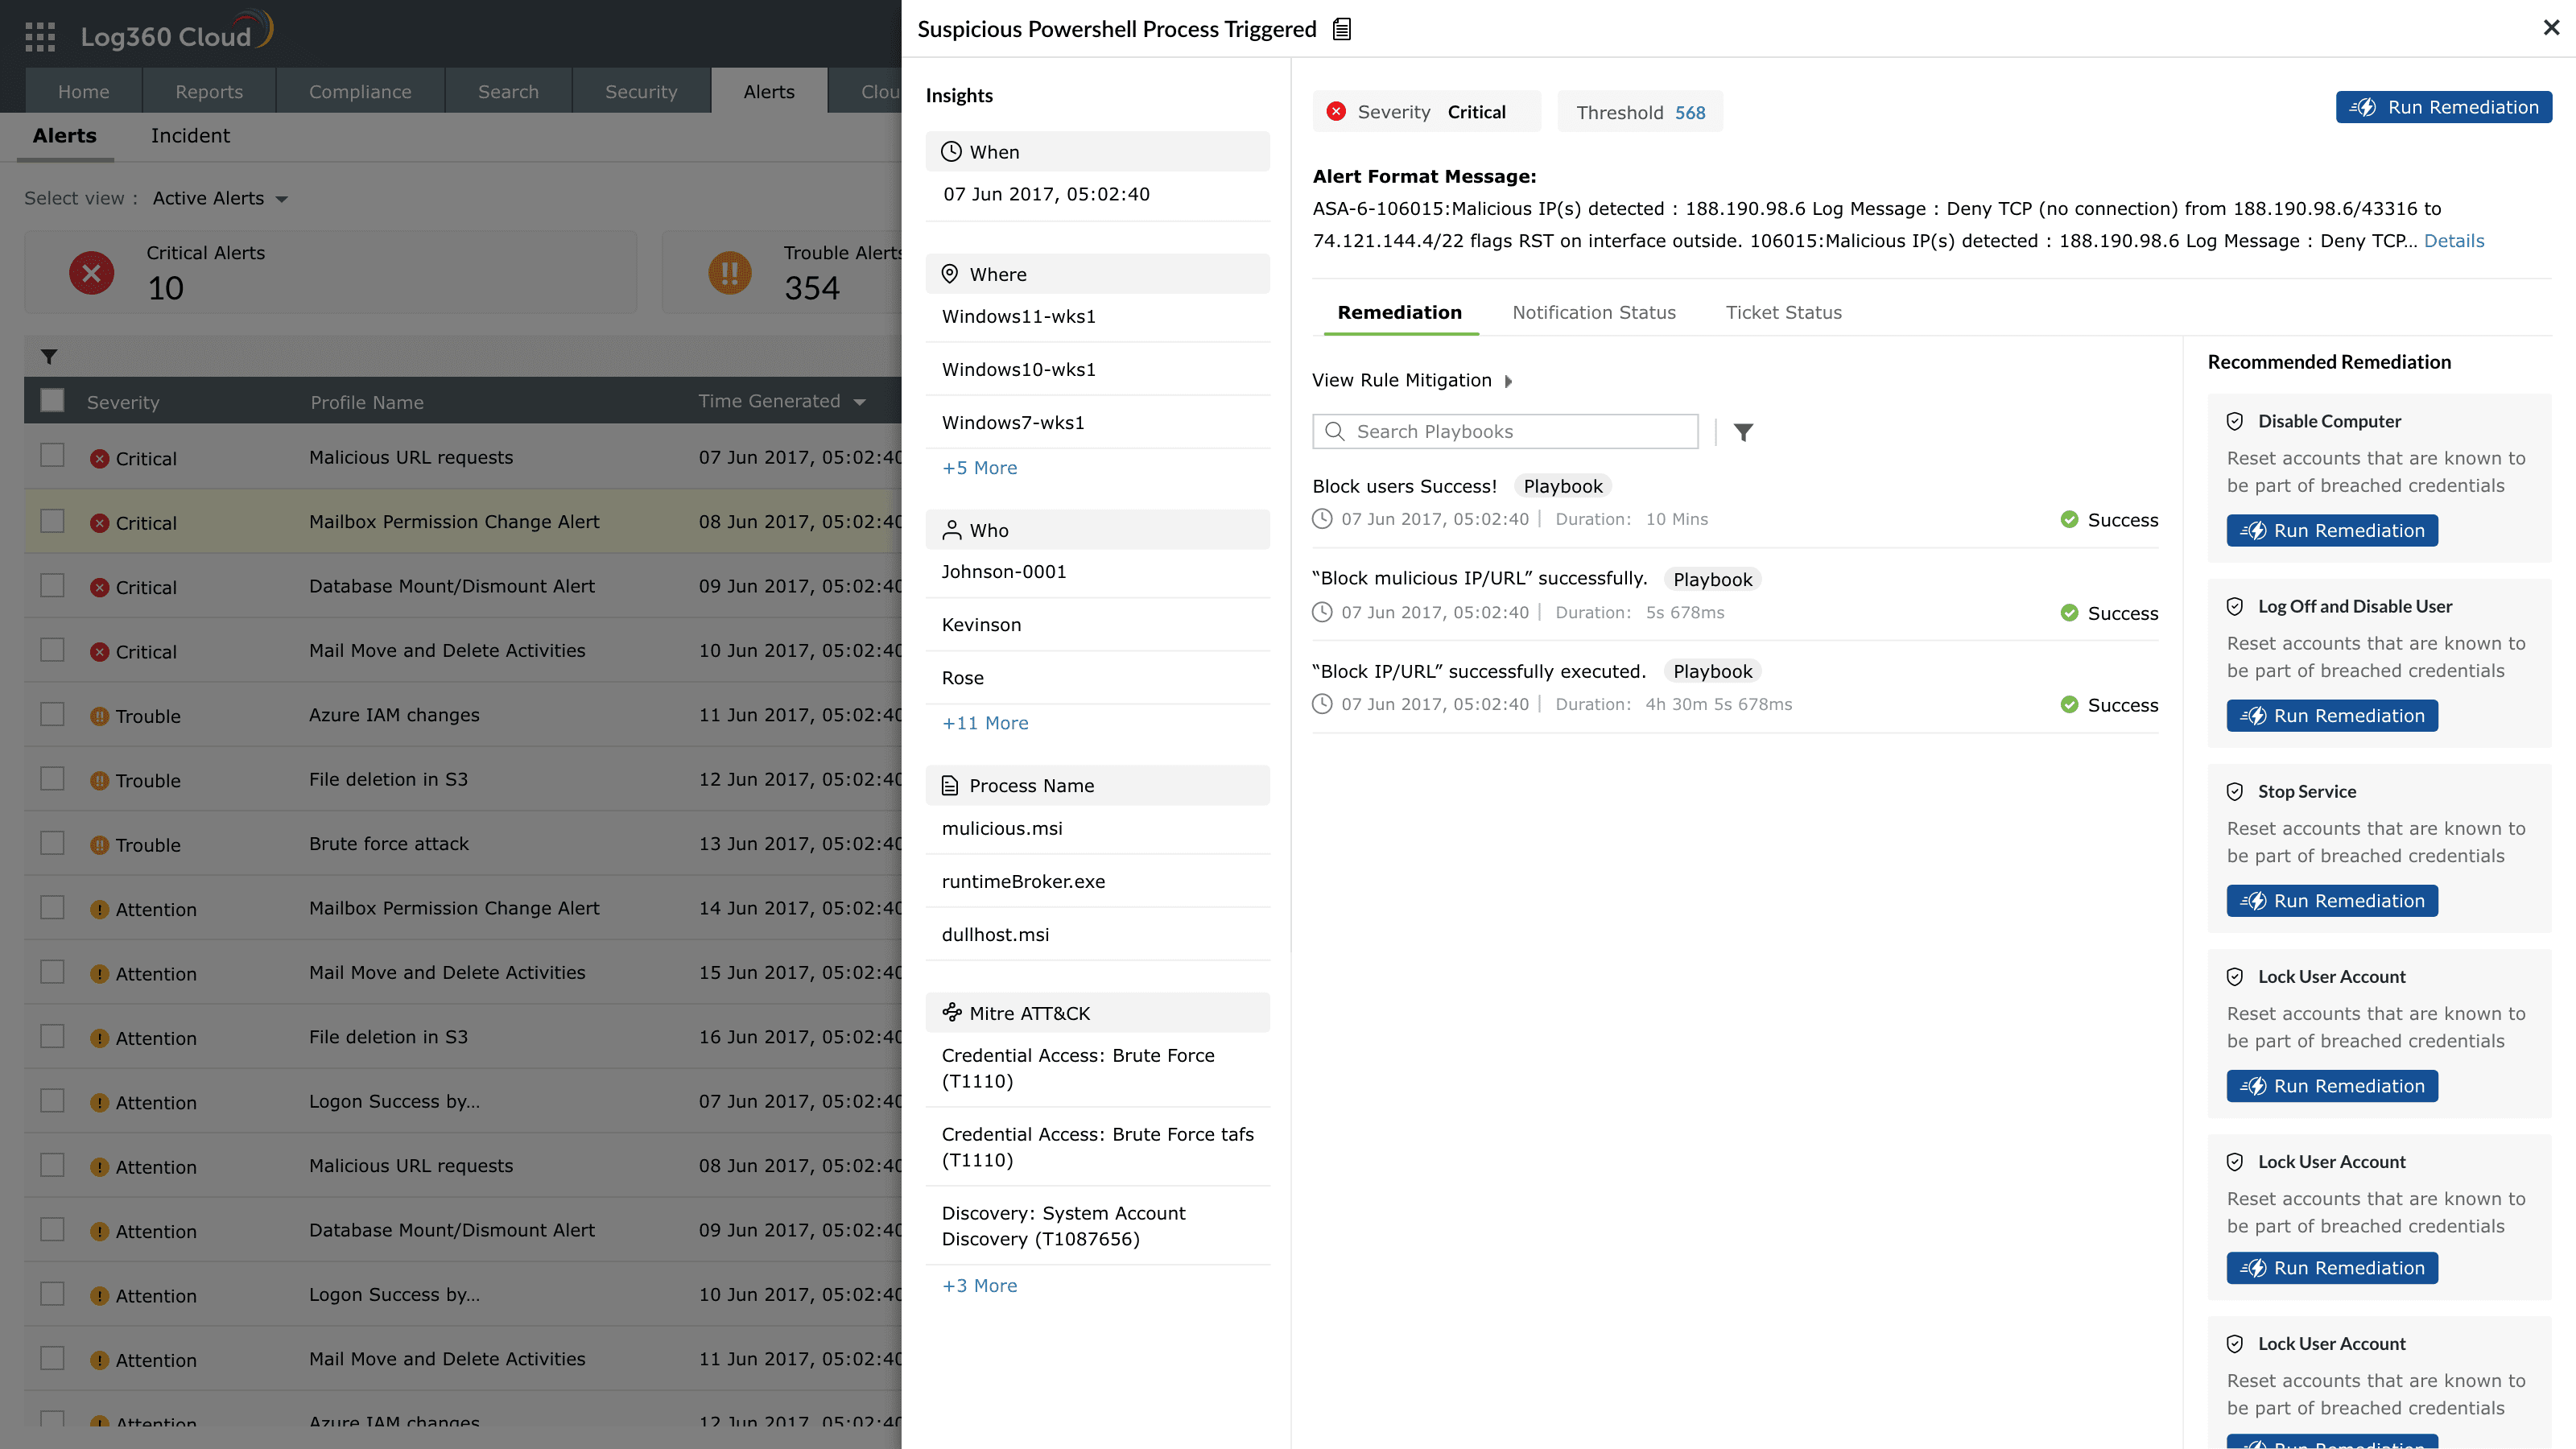
Image: Reviewing playbook status in Remediation Execution History
Playbook types
Playbooks are categorized based on where they will be triggered, as selected in the Applies to section, during the playbook creation. Each playbook type is context-aware, meaning its available actions and test scenarios vary depending on the associated data source.
- Alert-based playbooks: Associated with alert profiles to perform automatic or manual remediation when a specific alert is triggered.
- Detection-based playbooks: Applied to detection evidence to enrich and investigate anomalies.
- Incident-based playbooks: Executed on incidents that combine multiple alerts, evidence, and related entities for end-to-end remediation.
- Log-based playbooks: Designed to run directly on log evidence retrieved from searches or investigations, and can also be used inside other playbooks as a sub-playbook for modular execution sequences.
To understand more about playbook input types in the Applies To field refer to Understanding playbook payloads.
Association and execution
- Once created, playbooks can be associated with alert profiles for automatic execution or triggered manually from alerts and incidents (including incident evidences of type detection).
- Multiple playbooks can be associated with a single alert profile, allowing parallel execution of different remediation flows.
- Execution progress is displayed in real time, showing each state's status as running, success, failure, waiting, or aborted.
- A detailed execution summary is stored for every run, which can be accessed from the playbook's Execution history. Failed executions can be re-run from the start or re-tried from the point of failure.
- Playbooks can also be inserted as sub-playbooks within other playbooks.
NOTE When a parent playbook contains sub-playbooks, associations must be removed before deletion to maintain structural integrity.
Use cases
1. Automated isolation of infected endpointsUse case When a critical malware alert is generated by an endpoint, an alert-based playbook tied to the corresponding alert profile is triggered automatically.
With Alert-based playbook execution The playbook conducts contextual enrichment by gathering process details and hash values, validating them against a threat feed. If confirmed as malicious, the playbook triggers an integration action to isolate the infected endpoint from the corresponding remediation action configured in the playbook.
The security analyst is notified instantly via email, confirming the isolation and remediation status, ensuring swift and automated incident resolution.
2. Automated investigation of suspicious login patternsUse case An abnormal login pattern is detected by UEBA, prompting the activation of a detection-based playbook.
With UEBA-triggered playbook The playbook performs contextual enrichment by retrieving GeoIP data, cross-verifying the login source with known user behavior, and checking if the same credentials were used from different locations within a short timeframe.
Based on these findings, the playbook automatically generates an incident with associated evidence and alerts the administrator for further review and action.
Read also
This document introduced the concept and working model of playbooks in Log360 Cloud and explained how they fit into the automated response framework. To continue, see the following pages: