Business Views
Business views in OpManager provide a graphical representation of devices according to the business service they cater to. This ensures the availability of business critical applications at all times and helps in quicker troubleshooting. The Business View Tab can be accessed both from the Maps and Inventory section of OpManager.
- Creating a business view
- Creating links between devices
- Modifying business views
- Adding shortcuts
- Traffic load legend
- Business View Status
- Business view map settings
- Add Peripherals, Shapes and Texts
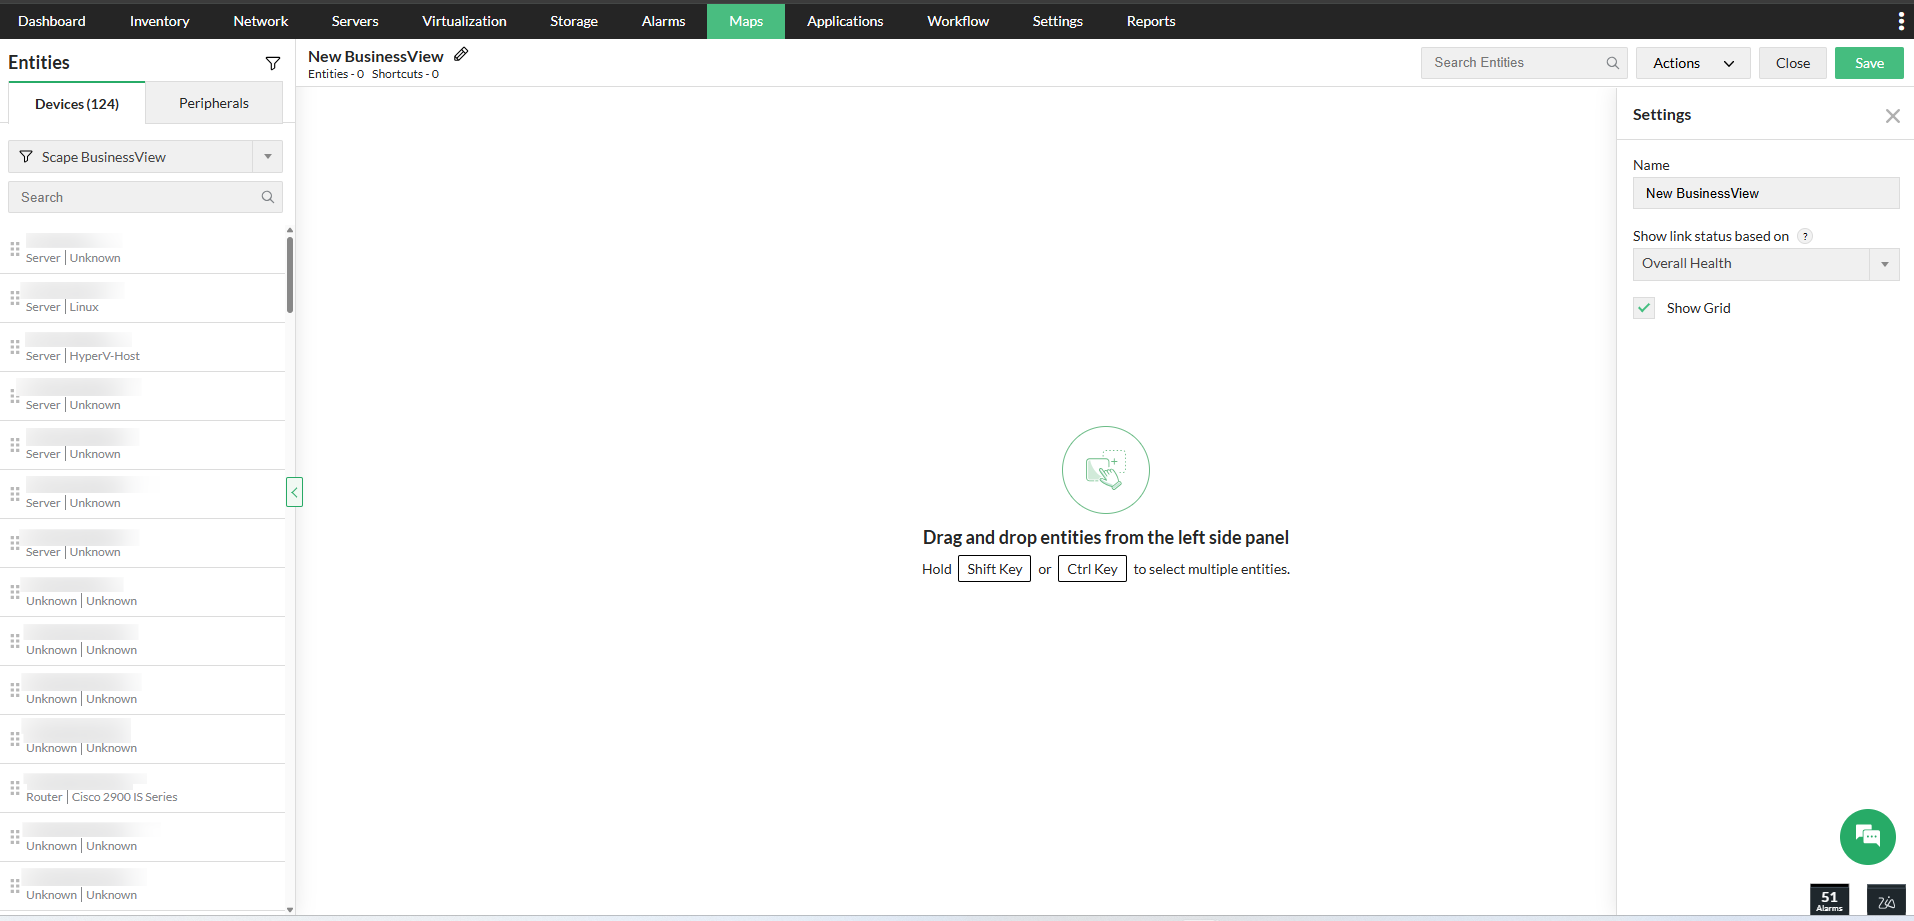
Creating a Business View:
- Go to Maps > Business Views > New Business View. Or go to Inventory > Business Views > Add Business View.
- From the list of available devices, drag and drop the required devices into the white board individually or add devices in bulk.
- Customize the view by changing font type, size or color and edit the background if necessary.
- Place the selected devices on the Map (background) based on your requirement.
- Rename and save the created business view.
Creating Links between devices:
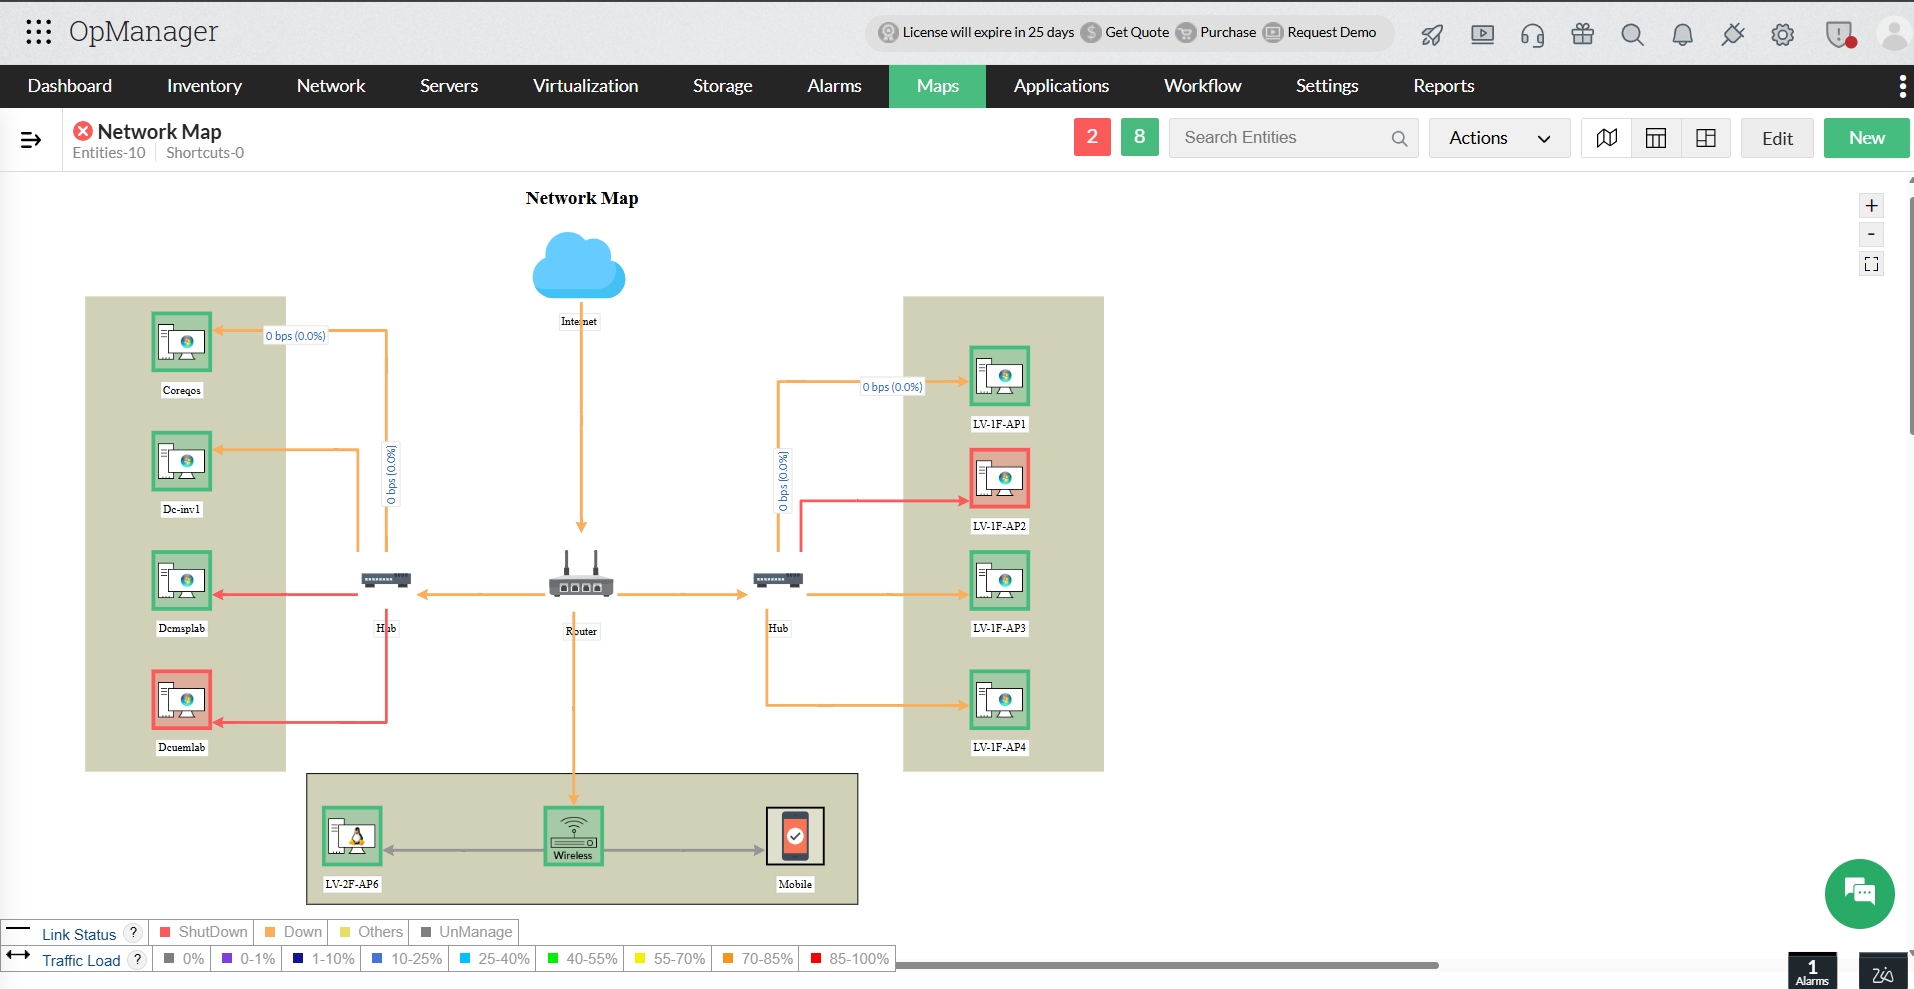
Adding links between devices in business views, helps to represent network diagram on the map. These links can be configured based on user requirements.
To add a link between two devices in a business view,
- Select the Add link button next to the Background tab. Drag a link from the source to the destination device and click that device. A link properties dialog pops up.
- Alternatively you can also drag the link button at the top right corner of the source device icon to create a link to the destination device.
- Configure a display name for the link.
- In the Get Status from field, select any interface from either the source device or the destination device. The link will inherit the status of the interface that you choose here. For instance, if the source device goes down, and if you have selected an interface from that device, the link also inherits the status of that device.
Note: You can also select to Get Status from either OpManager or NetFlow. If OpManager is selected, status is got through SNMP. If NetFlow is selected, detailed data like Top Source, Destination, QoS etc., can be obtained.
- Select the line type and size.
- Deselect the Show Arrow check box if you don't want to show the traffic arrows.
- Click Apply.
- Click Save on the right to save the changes.

Modifying Business Views:
From the Maps tab, open the Business View you want to edit and click the Edit icon to enter edit mode. You can perform the following operations from the editing toolbar at the top:
- You can customize the Font Family, Font Size & Style, and Font Color.
- To change the Background Color or click Select Background Image to upload a new image or choose from the library.
- Use the Toggle Grid option to show or hide the grid for precise alignment.
- Create links by clicking the Link icon and dragging between two devices.
- To create a shortcut, click the Shortcut button. This creates a nested business view, which can be helpful when drilling down into a business view for a specific building, such as viewing different floors or department-level business views.
- Delete any element such as device, link, shortcut, or shape by clicking the element and then the Delete icon.
When you’re done making changes, click Save to apply the updates.
Adding Shortcuts:
You can add shortcut icons to business views that helps to easily navigate to a view from another view when objects are grouped based on their geographical location.
- Go to the business view and click the Edit option on right-top corner of the view.
- Click the Add Shortcut button on the left. A shortcut properties dialog pops up.
- Configure a name for the shortcut in the Shortcut Name field.
- From the Open Submap list-box, select the map which should be opened when you click the shortcut.
- Select the icon to be used for the shortcut from the Default Icons or select from the Custom Icon combo-box.
- Click Apply for the shortcut to be added.
Note: You must create at least two business views to be able to add a shortcut from one view to another.

Traffic Load Legend:
Traffic load legend is a color coded representation of the status of the Link and Traffic load data of the devices in a Business view.
The Traffic load legend colors can be edited. To do this, go to the Maps tab, and click on the settings icon above the business view widget. Hover your cursor on the color that you wish to change and click the edit icon that appears. Choose a color of your preference and click Save.
Business View Link Status
The status of Business View links is displayed using a priority order. The rules below define how link severity and color are chosen:
Priority 1 — Interface Down
When an interface is associated, the link severity is determined primarily by the interface status:
- Shutdown — Interface is administratively disabled. Critical
- Down — Either Admin or Oper status is down. Severity follows the
Interface Down Settingsconfigured in OpManager. - Unmanaged — Interface is manually set to unmanaged in the GUI or suspended due to no data collection. The link will appear in grey.
- Others — Admin is Up but Oper is Testing. Severity follows the configured
Interface Down Settings.
Priority 2 — Threshold Violation
If the interface is Up but a threshold violation alert exists, the alarm's severity will be used as the link status.
Priority 3 — Traffic Load
If the interface is Up and there are no interface alerts, link severity is based on the traffic load:
- Traffic thresholds and severity levels can be customized under Map Settings.
- The most recent polled
Rx/Txtraffic values are shown per interface. - For Central servers, the last hourly archived traffic is displayed.

Note: Additionally , you can choose to show link status based on Traffic Load under New Business View > Settings > click on the drop down: Show link status based on > Traffic Load / Overall Health.

Business View Map Settings
Under the Maps tab, and click on the settings icon above the business view widget, you can customize the colors to indicate the traffic in links that interconnect various devices in a business view. Click on the color box next to the corresponding traffic percentage values and choose a color. The changes made here will be applied to all the existing business views.

Add Peripherals, Shapes and Texts
When creating a new Business View, add peripherals, shapes, and text elements to make your visualization more interactive and visually appealing.
Peripherals
Add visual assets to enrich the background and content of your Business View. They include:
- Images
- Icons
- Custom images / uploads
- Background images
Shapes
Use shapes to create structure, show relationships, and highlight important areas. They include:
- L-shaped lines
- Single-headed arrows
- Rectangles
- Squares
- Circles
Text
Text options let you label elements and improve readability across devices. Customize text styling for clarity and emphasis. They include:
- Font selection
- Font size
- Font color

- How to check the link connectivity status and traffc in GUI?
- Why the device icons in my BV are displayed in very smaller/negligible size ?
- How can I edit multiple links, devices or shortcuts in a Business view?
- How to add links between devices/shortcuts?
- Link arrows are not displayed for few interfaces in the Business View. Why?