Trend Reports
The Trend Reports are essential for monitoring and analyzing key performance metrics over time. They provide insights into resource utilization, performance fluctuations, and potential bottlenecks. By reviewing these trends, organizations can optimize resource allocation, enhance system efficiency, and predict future capacity requirements.
To access Trend Reports, navigate to Reports → Trend Reports from the main menu.
Trend Report Types
| Report Name | Description | Available Columns | Available Filters |
|---|---|---|---|
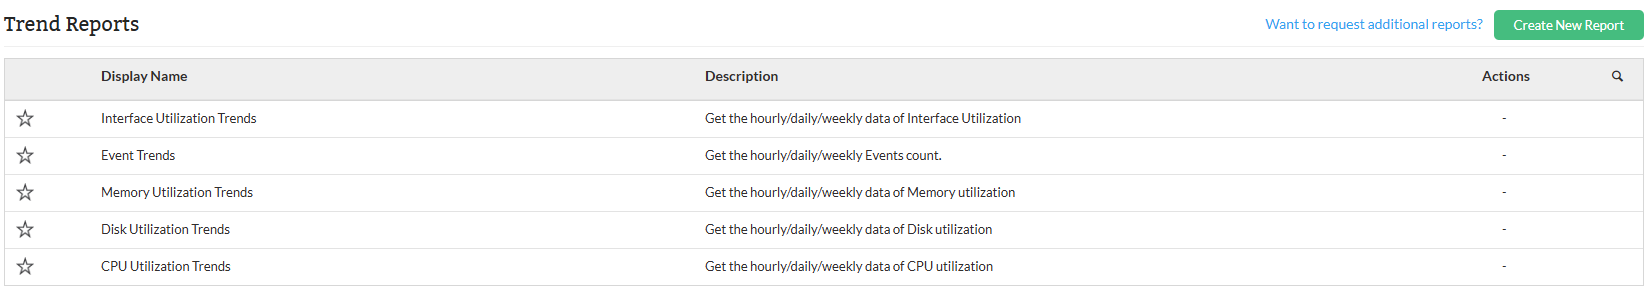
| Interface Utilization Trends Report | This report provides a detailed view of the interface utilization over time for various devices. It helps monitor the usage patterns of network interfaces on specific devices, allowing for better management of network traffic and identifying trends in utilization that may require attention. | Device Name, Interface Name, Time based on Period filter | Filter by, Period, Value Type, Monitors |
| Event Trends Report | This report tracks the occurrence of events on various devices over a specified period. It helps in monitoring the frequency of events for each device, allowing for proactive management and quick identification of any spikes or unusual activity. | Device Name, Event occurrence for each day or time based on period filter | Category, Filter by, Period, Event Type, Perf Group, Severity |
| Memory Utilization Trends Report | This report tracks memory utilization over time for various servers. It allows administrators to observe memory consumption trends on each device, helping to identify potential memory bottlenecks or overutilization, which may lead to performance issues. | Device Name, Memory Utilization percentage for each day or time based on period filter | Category, Filter by, Period, Value Type, and Perf Group |
| Disk Utilization Trends Report | This report tracks the disk utilization over time for various servers, helping administrators monitor storage capacity and trends. By analyzing disk usage, potential risks of running out of space can be identified, and appropriate actions can be taken to avoid performance degradation or outages. | Device Name, Disk Utilization percentage for each day or time based on period filter | Category, Filter by, Period, Value Type, and Perf Group |
| CPU Utilization Trends Report | This report provides insights into the CPU utilization for various servers, tracking the percentage of CPU usage over a set period. It helps identify when a device's CPU is under heavy load, which could lead to potential performance degradation or require optimization to prevent system slowdowns. | Device Name, CPU Utilization percentage for each day or time based on period filter | Category, Filter by, Period, Value Type, and Perf Group |
By reviewing these trends, you can proactively manage capacity, detect irregular behavior, and ensure optimal performance across your network.
Users can apply various filters to narrow down reports, such as filtering by category, device, or time period. You can also export reports to PDF or Excel, schedule them for automated generation within defined business hours or time windows. Click here to know more about other report types in OpManager.
To know more about the Available Filters in various reports of OpManager, Click here.