Dependency Mapping
Overview
Dependency Mapping is an automatic feature that allows you to map dependencies between resources that are discovered from the network using Application Discovery. The servers and applications that are discovered and added as monitors from the network are used to map dependencies between them.
Types of Dependency Mapping
There are two types of dependency mapping that can be done:
- Server to Application dependency: Displays all the applications that are running on a server and maps the applications that are interconnected with each other.
- Application to Application dependency: Displays all the applications that are running on the same and different servers and maps the ones that are interconnected.
Mapping dependencies between resources
Dependency Maps can be created in two ways:
- Direct mapping: Dependency Maps can be created directly by adding a new map under Settings → Add/Discover → Dependency Map. After clicking Add New option under Dependency Map, create the Dependency Map by specifying the Dependency Map name, selecting the required servers/applications for mapping and clicking Create. Before creating the view, You can also choose to view the demo of how the map will be created by clicking the View Demo option.
- Mapping via Discovery Profile: Dependency Maps can be created using discovery profile added via Network Discovery. Upon clicking Discover & Add in Network Discovery, you will be able to view the list of servers and applications that were discovered in the View Report page. Then click on View Application Dependency Map option and create the Dependency Map by selecting the required servers/applications.
Note: Make sure to enable the option Enable ADDM dependency view under Settings → Global Settings before proceeding with the above-given steps.
Dependency Map
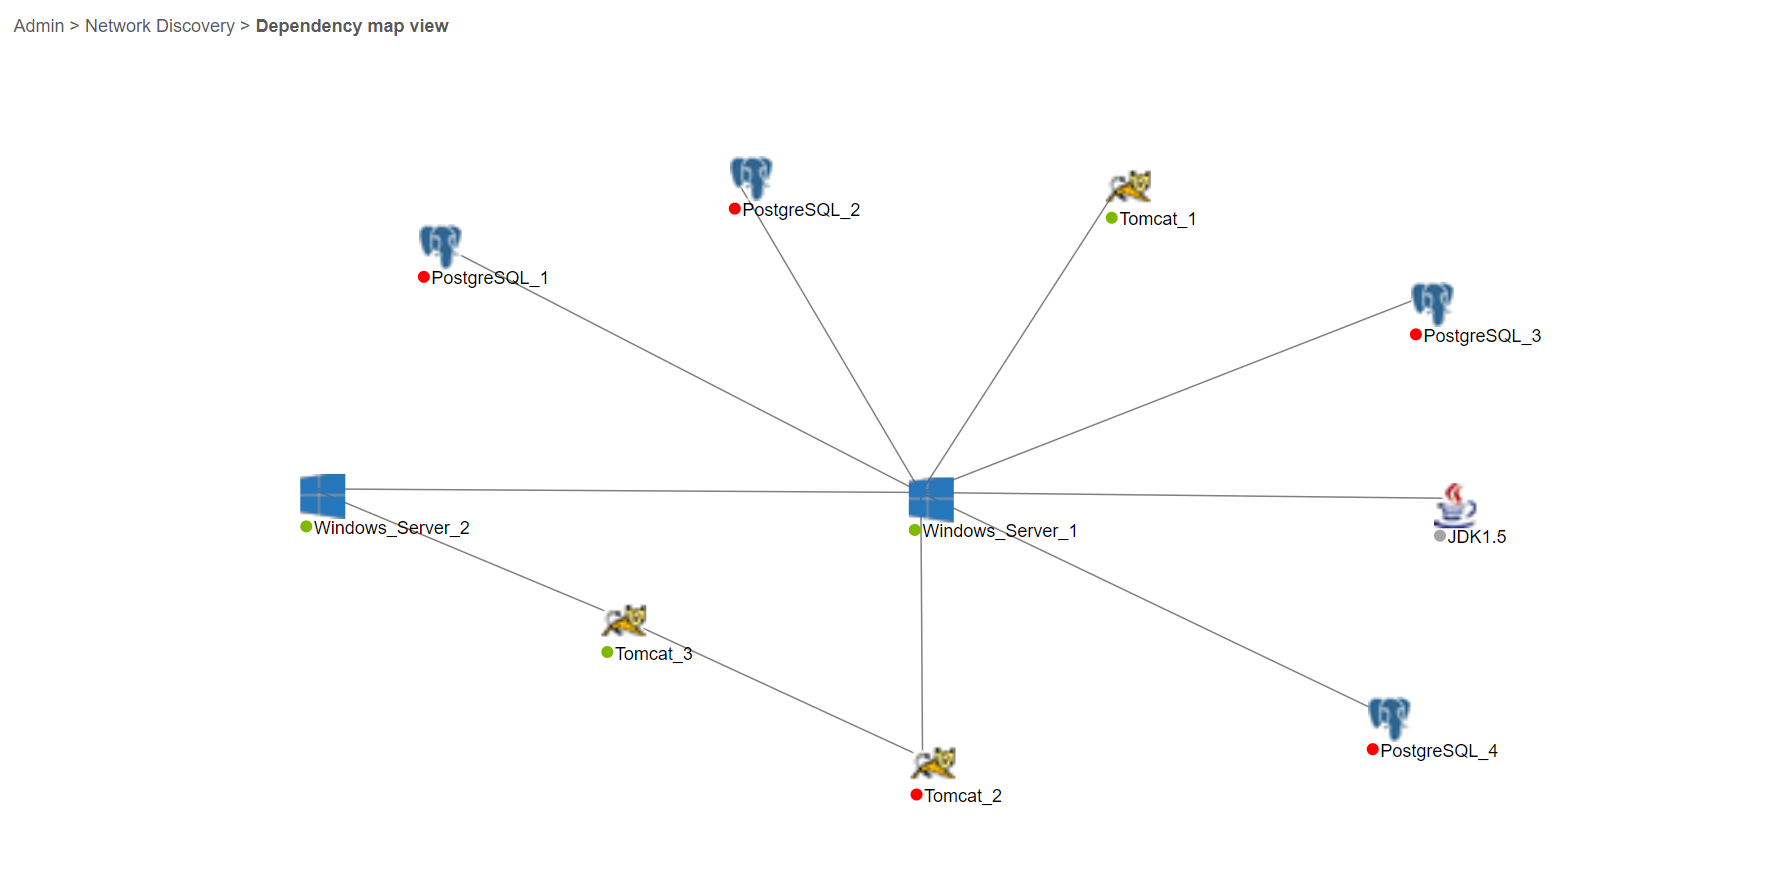
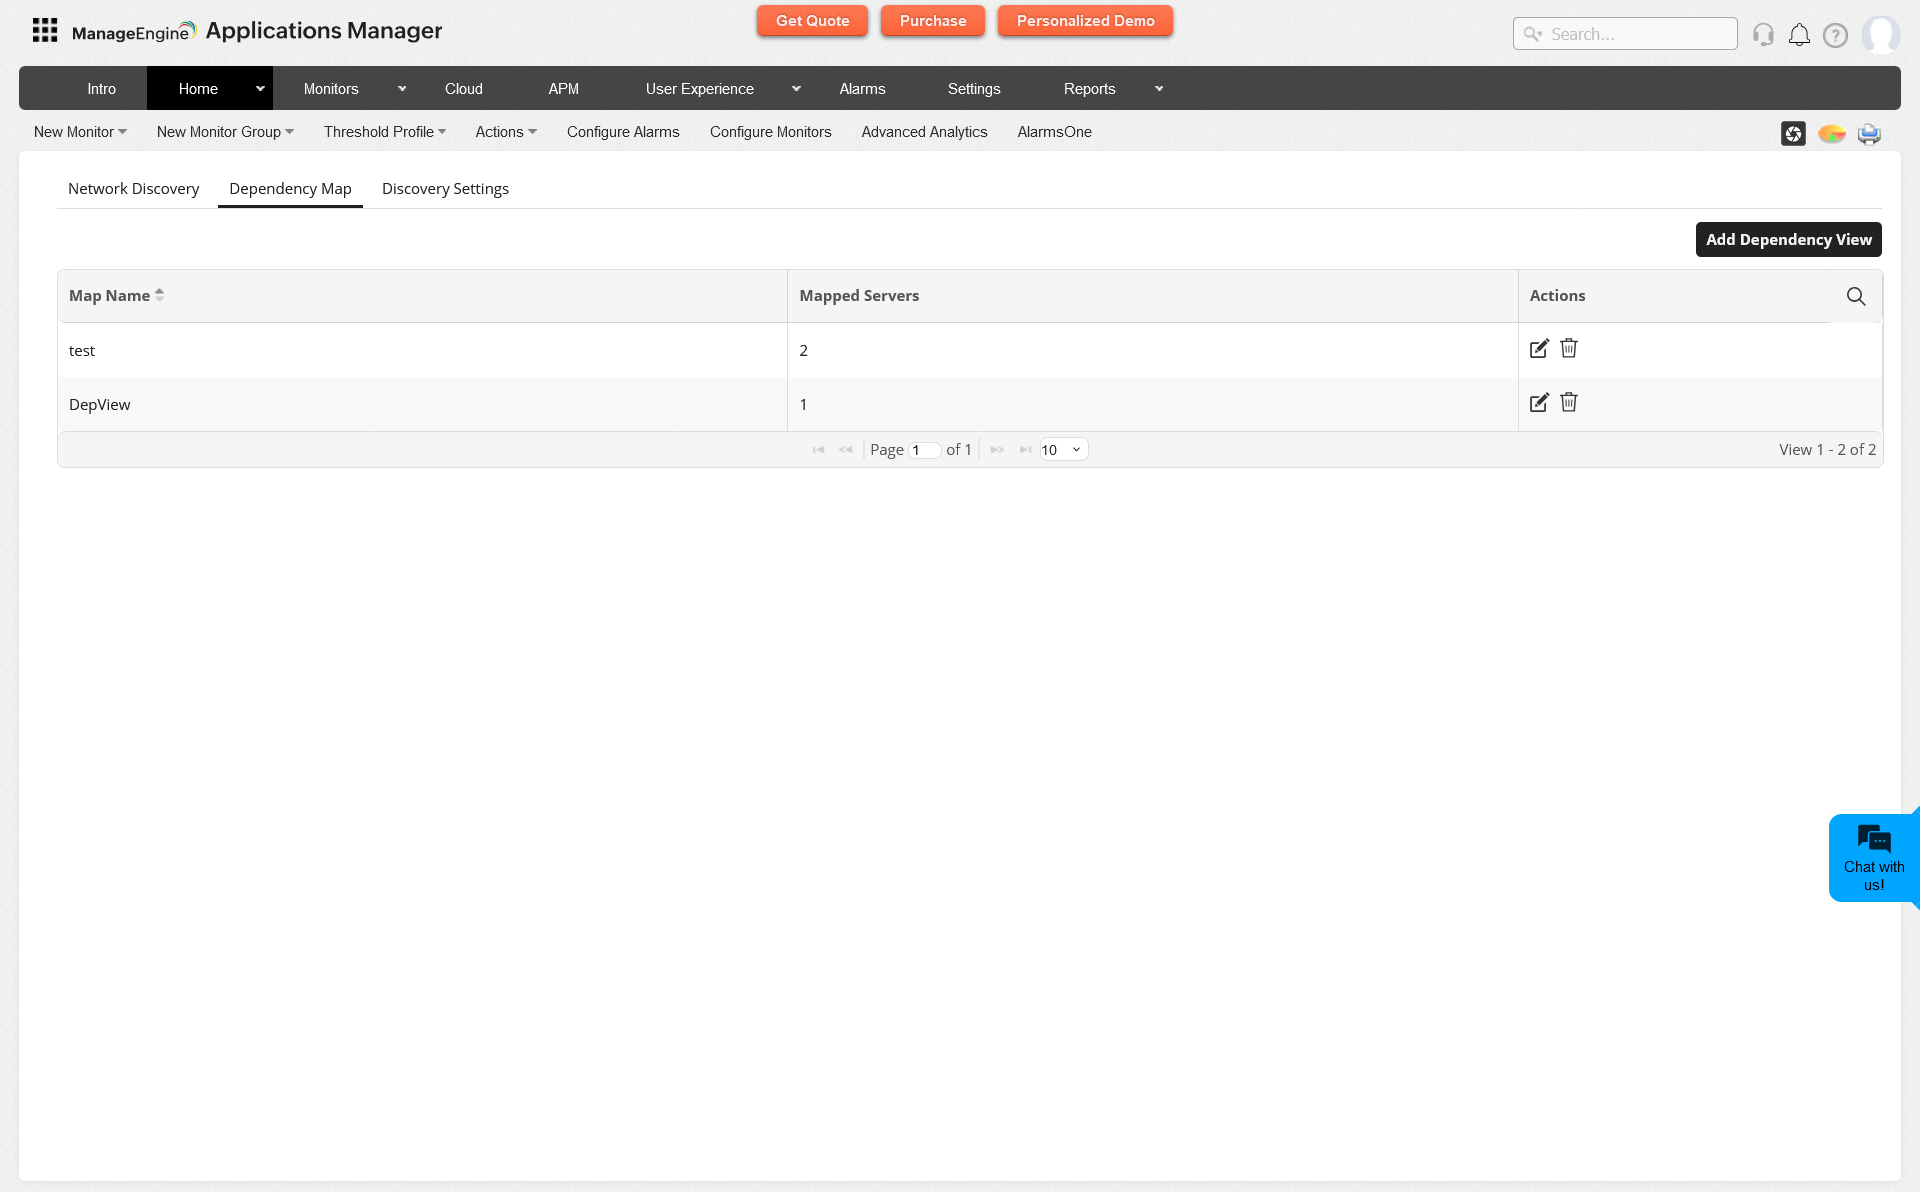
Besides the Network Discovery table, you can view Dependency Maps created with the discovered resources under the Dependency Map table. This table shows the list of various dependency maps created along with the number of servers and applications added to this map view. On clicking the map name, you can find a visual map view of all the servers and their associated applications that are available and connected to each other. There are two types of dependency maps that can be viewed:
- Graph View: Show a visual representation of all the servers and their associated applications connected in the form of graphs.
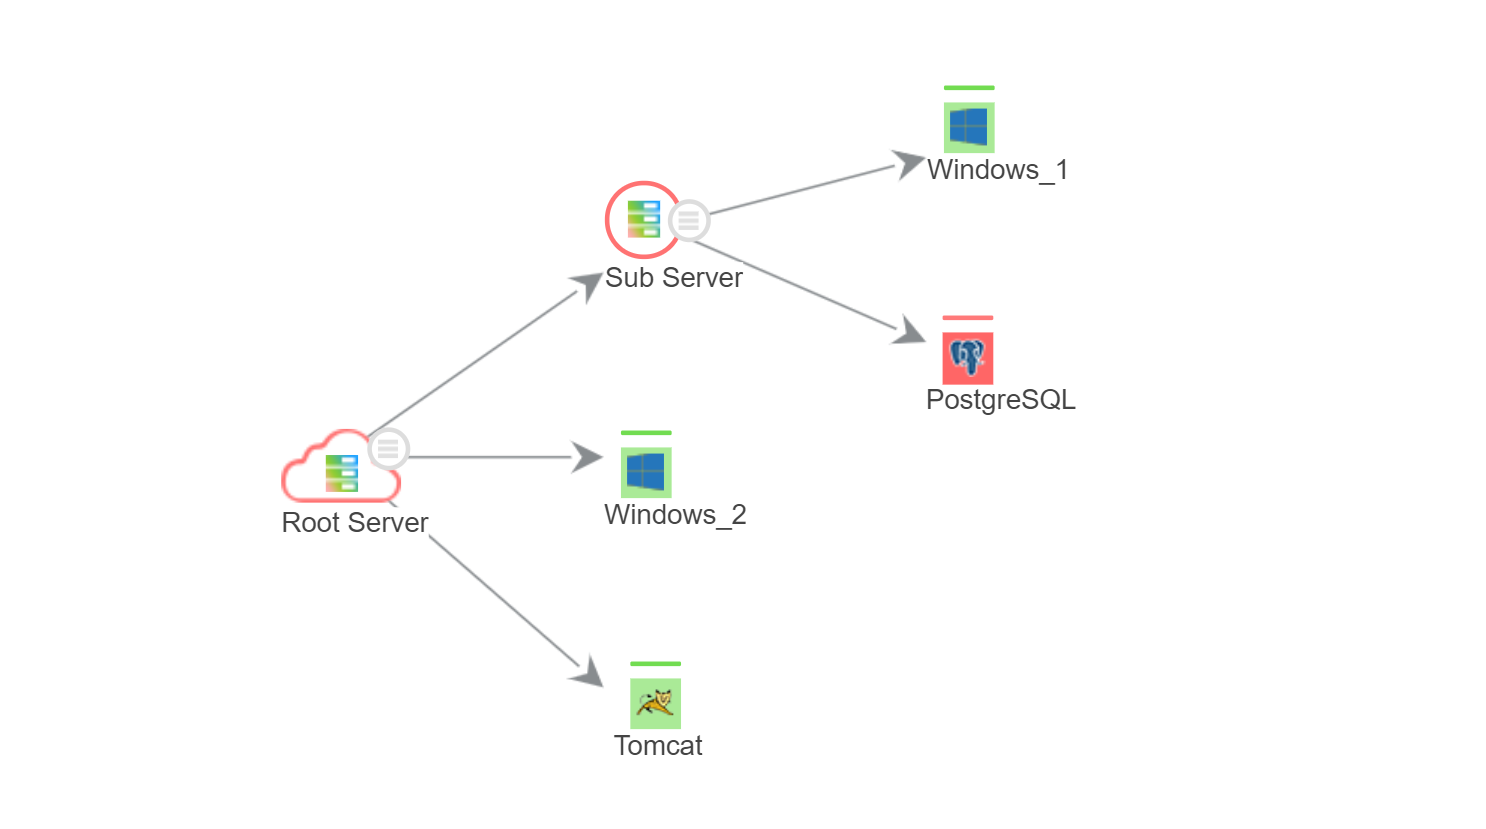
- Tree View: Shows a visual representation of all the applications connected in the form of flowchart. You can obtain this view by disabling the Enable ADDM Dependency View option under Settings → Global Settings. Learn more
You can add additional servers to an already-existing Dependency Map, and even remove server from an existing Dependency Map by using Edit icon for the required dependency map. You can also delete the Dependency Map using the Delete icon.
Mapping using Business View
Apart from the Dependency Map View, you can also choose to map dependencies between resources discovered from the network using Business View. To view dependency mapping with Business View, you need to disable the Enable ADDM dependency view option under Settings → Global Settings. Once this is done, go to Settings → Add/Discover → Discovery, click on View report page icon for the required discovery profile under Network Discovery section and then click on View Application Dependency Map option.
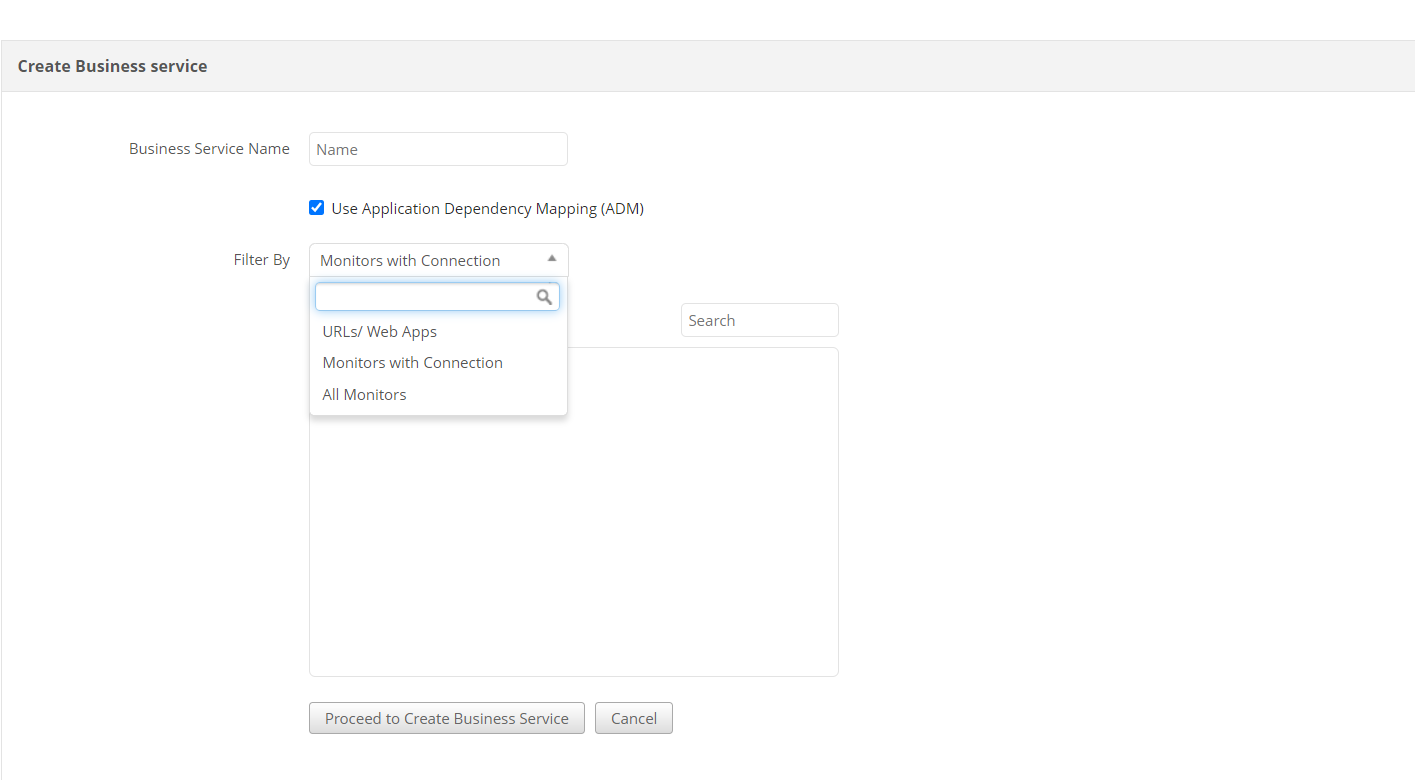
You will be asked to Create Business Service wherein you have to specify the Business Service Name with the Use Application Dependency Mapping (ADM) enabled by default, which will help you to view connections between applications. Then you can filter the monitors based on the options selected from the Filter by dropdown. When Monitors with connection option is selected from the dropdown, then it will list out only the applications that have connection with other applications. You can also view the server details along with application dependency by enabling the Show servers in Applications Dependency Mapping option under Settings → Global Settings.
Services - Using this option, you can choose which of the services needs to monitored by default.
The services are listed down along with their default ports. For eg., if you had already added a Windows Server monitor, by using this option, you can choose the services (that are running in that windows server) to be monitored. You choose to monitor all the tomcats & IIS servers that are running in the windows server. Data Collection does not happen for services that are not enabled, thereby increasing the efficiency of monitoring in general.
By using the edit option, you can edit the port number. If there are multiple ports, enter the ports as comma separated.
